Free Statistics

of Irreproducible Research!

Author's title

Author*The author of this computation has been verified*
R Software Modulerwasp_autocorrelation.wasp
Title produced by software(Partial) Autocorrelation Function
Date of computationWed, 02 Dec 2009 08:53:42 -0700
Cite this page as followsStatistical Computations at FreeStatistics.org, Office for Research Development and Education, URL https://freestatistics.org/blog/index.php?v=date/2009/Dec/02/t1259769262px71lo6pg9jgqmu.htm/, Retrieved Sat, 27 Apr 2024 22:44:46 +0000
Statistical Computations at FreeStatistics.org, Office for Research Development and Education, URL https://freestatistics.org/blog/index.php?pk=62391, Retrieved Sat, 27 Apr 2024 22:44:46 +0000
QR Codes:

Original text written by user:
IsPrivate?No (this computation is public)
User-defined keywords
Estimated Impact123
Family? (F = Feedback message, R = changed R code, M = changed R Module, P = changed Parameters, D = changed Data)
-     [Univariate Data Series] [data set] [2008-12-01 19:54:57] [b98453cac15ba1066b407e146608df68]
- RMP   [(Partial) Autocorrelation Function] [] [2009-11-27 14:48:46] [b98453cac15ba1066b407e146608df68]
-    D      [(Partial) Autocorrelation Function] [d=D=1] [2009-12-02 15:53:42] [cf272a759dc2b193d9a85354803ede7b] [Current]
Feedback Forum

Post a new message
Dataseries X:
108.5
112.3
116.6
115.5
120.1
132.9
128.1
129.3
132.5
131
124.9
120.8
122
122.1
127.4
135.2
137.3
135
136
138.4
134.7
138.4
133.9
133.6
141.2
151.8
155.4
156.6
161.6
160.7
156
159.5
168.7
169.9
169.9
185.9
190.8
195.8
211.9
227.1
251.3
256.7
251.9
251.2
270.3
267.2
243
229.9
187.2
178.2
175.2
192.4
187
184
194.1
212.7
217.5
200.5
205.9
196.5
206.3


Summary of computational transaction
Raw Inputview raw input (R code)
Raw Outputview raw output of R engine
Computing time1 seconds
R Server'Gwilym Jenkins' @ 72.249.127.135

\begin{tabular}{lllllllll}
\hline
Summary of computational transaction \tabularnewline
Raw Input & view raw input (R code)  \tabularnewline
Raw Output & view raw output of R engine  \tabularnewline
Computing time & 1 seconds \tabularnewline
R Server & 'Gwilym Jenkins' @ 72.249.127.135 \tabularnewline
\hline
\end{tabular}
%Source: https://freestatistics.org/blog/index.php?pk=62391&T=0

[TABLE]
[ROW][C]Summary of computational transaction[/C][/ROW]
[ROW][C]Raw Input[/C][C]view raw input (R code) [/C][/ROW]
[ROW][C]Raw Output[/C][C]view raw output of R engine [/C][/ROW]
[ROW][C]Computing time[/C][C]1 seconds[/C][/ROW]
[ROW][C]R Server[/C][C]'Gwilym Jenkins' @ 72.249.127.135[/C][/ROW]
[/TABLE]
Source: https://freestatistics.org/blog/index.php?pk=62391&T=0

Globally Unique Identifier (entire table): ba.freestatistics.org/blog/index.php?pk=62391&T=0

As an alternative you can also use a QR Code:  

The GUIDs for individual cells are displayed in the table below:

Summary of computational transaction
Raw Inputview raw input (R code)
Raw Outputview raw output of R engine
Computing time1 seconds
R Server'Gwilym Jenkins' @ 72.249.127.135


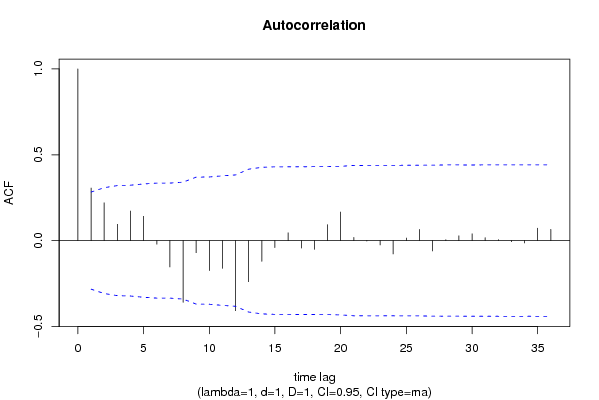
Autocorrelation Function
Time lag kACF(k)T-STATP-value
10.3060042.12010.019599
20.220391.52690.066674
30.0949040.65750.256996
40.1723291.19390.119186
50.1417230.98190.165539
6-0.020508-0.14210.443804
7-0.153093-1.06070.147077
8-0.359464-2.49040.008136
9-0.070456-0.48810.313839
10-0.174173-1.20670.11673
11-0.161466-1.11870.134425
12-0.408534-2.83040.003385
13-0.239234-1.65750.051974
14-0.120443-0.83450.20408
15-0.040328-0.27940.39057
160.0451760.3130.377822
17-0.043684-0.30270.381732
18-0.050775-0.35180.363272
190.0924470.64050.26245
200.1666151.15430.127038
210.0183530.12720.449674
22-0.002722-0.01890.492516
23-0.024923-0.17270.431819
24-0.077317-0.53570.29733
250.0149670.10370.458921
260.0651430.45130.326894
27-0.059816-0.41440.340206
280.0053810.03730.485208
290.0278940.19330.423787
300.0394930.27360.392777
310.016730.11590.454104
320.0051190.03550.485927
33-0.006223-0.04310.482895
34-0.01366-0.09460.462496
350.0722250.50040.309543
360.0654810.45370.326057

\begin{tabular}{lllllllll}
\hline
Autocorrelation Function \tabularnewline
Time lag k & ACF(k) & T-STAT & P-value \tabularnewline
1 & 0.306004 & 2.1201 & 0.019599 \tabularnewline
2 & 0.22039 & 1.5269 & 0.066674 \tabularnewline
3 & 0.094904 & 0.6575 & 0.256996 \tabularnewline
4 & 0.172329 & 1.1939 & 0.119186 \tabularnewline
5 & 0.141723 & 0.9819 & 0.165539 \tabularnewline
6 & -0.020508 & -0.1421 & 0.443804 \tabularnewline
7 & -0.153093 & -1.0607 & 0.147077 \tabularnewline
8 & -0.359464 & -2.4904 & 0.008136 \tabularnewline
9 & -0.070456 & -0.4881 & 0.313839 \tabularnewline
10 & -0.174173 & -1.2067 & 0.11673 \tabularnewline
11 & -0.161466 & -1.1187 & 0.134425 \tabularnewline
12 & -0.408534 & -2.8304 & 0.003385 \tabularnewline
13 & -0.239234 & -1.6575 & 0.051974 \tabularnewline
14 & -0.120443 & -0.8345 & 0.20408 \tabularnewline
15 & -0.040328 & -0.2794 & 0.39057 \tabularnewline
16 & 0.045176 & 0.313 & 0.377822 \tabularnewline
17 & -0.043684 & -0.3027 & 0.381732 \tabularnewline
18 & -0.050775 & -0.3518 & 0.363272 \tabularnewline
19 & 0.092447 & 0.6405 & 0.26245 \tabularnewline
20 & 0.166615 & 1.1543 & 0.127038 \tabularnewline
21 & 0.018353 & 0.1272 & 0.449674 \tabularnewline
22 & -0.002722 & -0.0189 & 0.492516 \tabularnewline
23 & -0.024923 & -0.1727 & 0.431819 \tabularnewline
24 & -0.077317 & -0.5357 & 0.29733 \tabularnewline
25 & 0.014967 & 0.1037 & 0.458921 \tabularnewline
26 & 0.065143 & 0.4513 & 0.326894 \tabularnewline
27 & -0.059816 & -0.4144 & 0.340206 \tabularnewline
28 & 0.005381 & 0.0373 & 0.485208 \tabularnewline
29 & 0.027894 & 0.1933 & 0.423787 \tabularnewline
30 & 0.039493 & 0.2736 & 0.392777 \tabularnewline
31 & 0.01673 & 0.1159 & 0.454104 \tabularnewline
32 & 0.005119 & 0.0355 & 0.485927 \tabularnewline
33 & -0.006223 & -0.0431 & 0.482895 \tabularnewline
34 & -0.01366 & -0.0946 & 0.462496 \tabularnewline
35 & 0.072225 & 0.5004 & 0.309543 \tabularnewline
36 & 0.065481 & 0.4537 & 0.326057 \tabularnewline
\hline
\end{tabular}
%Source: https://freestatistics.org/blog/index.php?pk=62391&T=1

[TABLE]
[ROW][C]Autocorrelation Function[/C][/ROW]
[ROW][C]Time lag k[/C][C]ACF(k)[/C][C]T-STAT[/C][C]P-value[/C][/ROW]
[ROW][C]1[/C][C]0.306004[/C][C]2.1201[/C][C]0.019599[/C][/ROW]
[ROW][C]2[/C][C]0.22039[/C][C]1.5269[/C][C]0.066674[/C][/ROW]
[ROW][C]3[/C][C]0.094904[/C][C]0.6575[/C][C]0.256996[/C][/ROW]
[ROW][C]4[/C][C]0.172329[/C][C]1.1939[/C][C]0.119186[/C][/ROW]
[ROW][C]5[/C][C]0.141723[/C][C]0.9819[/C][C]0.165539[/C][/ROW]
[ROW][C]6[/C][C]-0.020508[/C][C]-0.1421[/C][C]0.443804[/C][/ROW]
[ROW][C]7[/C][C]-0.153093[/C][C]-1.0607[/C][C]0.147077[/C][/ROW]
[ROW][C]8[/C][C]-0.359464[/C][C]-2.4904[/C][C]0.008136[/C][/ROW]
[ROW][C]9[/C][C]-0.070456[/C][C]-0.4881[/C][C]0.313839[/C][/ROW]
[ROW][C]10[/C][C]-0.174173[/C][C]-1.2067[/C][C]0.11673[/C][/ROW]
[ROW][C]11[/C][C]-0.161466[/C][C]-1.1187[/C][C]0.134425[/C][/ROW]
[ROW][C]12[/C][C]-0.408534[/C][C]-2.8304[/C][C]0.003385[/C][/ROW]
[ROW][C]13[/C][C]-0.239234[/C][C]-1.6575[/C][C]0.051974[/C][/ROW]
[ROW][C]14[/C][C]-0.120443[/C][C]-0.8345[/C][C]0.20408[/C][/ROW]
[ROW][C]15[/C][C]-0.040328[/C][C]-0.2794[/C][C]0.39057[/C][/ROW]
[ROW][C]16[/C][C]0.045176[/C][C]0.313[/C][C]0.377822[/C][/ROW]
[ROW][C]17[/C][C]-0.043684[/C][C]-0.3027[/C][C]0.381732[/C][/ROW]
[ROW][C]18[/C][C]-0.050775[/C][C]-0.3518[/C][C]0.363272[/C][/ROW]
[ROW][C]19[/C][C]0.092447[/C][C]0.6405[/C][C]0.26245[/C][/ROW]
[ROW][C]20[/C][C]0.166615[/C][C]1.1543[/C][C]0.127038[/C][/ROW]
[ROW][C]21[/C][C]0.018353[/C][C]0.1272[/C][C]0.449674[/C][/ROW]
[ROW][C]22[/C][C]-0.002722[/C][C]-0.0189[/C][C]0.492516[/C][/ROW]
[ROW][C]23[/C][C]-0.024923[/C][C]-0.1727[/C][C]0.431819[/C][/ROW]
[ROW][C]24[/C][C]-0.077317[/C][C]-0.5357[/C][C]0.29733[/C][/ROW]
[ROW][C]25[/C][C]0.014967[/C][C]0.1037[/C][C]0.458921[/C][/ROW]
[ROW][C]26[/C][C]0.065143[/C][C]0.4513[/C][C]0.326894[/C][/ROW]
[ROW][C]27[/C][C]-0.059816[/C][C]-0.4144[/C][C]0.340206[/C][/ROW]
[ROW][C]28[/C][C]0.005381[/C][C]0.0373[/C][C]0.485208[/C][/ROW]
[ROW][C]29[/C][C]0.027894[/C][C]0.1933[/C][C]0.423787[/C][/ROW]
[ROW][C]30[/C][C]0.039493[/C][C]0.2736[/C][C]0.392777[/C][/ROW]
[ROW][C]31[/C][C]0.01673[/C][C]0.1159[/C][C]0.454104[/C][/ROW]
[ROW][C]32[/C][C]0.005119[/C][C]0.0355[/C][C]0.485927[/C][/ROW]
[ROW][C]33[/C][C]-0.006223[/C][C]-0.0431[/C][C]0.482895[/C][/ROW]
[ROW][C]34[/C][C]-0.01366[/C][C]-0.0946[/C][C]0.462496[/C][/ROW]
[ROW][C]35[/C][C]0.072225[/C][C]0.5004[/C][C]0.309543[/C][/ROW]
[ROW][C]36[/C][C]0.065481[/C][C]0.4537[/C][C]0.326057[/C][/ROW]
[/TABLE]
Source: https://freestatistics.org/blog/index.php?pk=62391&T=1

Globally Unique Identifier (entire table): ba.freestatistics.org/blog/index.php?pk=62391&T=1

As an alternative you can also use a QR Code:  

The GUIDs for individual cells are displayed in the table below:

Autocorrelation Function
Time lag kACF(k)T-STATP-value
10.3060042.12010.019599
20.220391.52690.066674
30.0949040.65750.256996
40.1723291.19390.119186
50.1417230.98190.165539
6-0.020508-0.14210.443804
7-0.153093-1.06070.147077
8-0.359464-2.49040.008136
9-0.070456-0.48810.313839
10-0.174173-1.20670.11673
11-0.161466-1.11870.134425
12-0.408534-2.83040.003385
13-0.239234-1.65750.051974
14-0.120443-0.83450.20408
15-0.040328-0.27940.39057
160.0451760.3130.377822
17-0.043684-0.30270.381732
18-0.050775-0.35180.363272
190.0924470.64050.26245
200.1666151.15430.127038
210.0183530.12720.449674
22-0.002722-0.01890.492516
23-0.024923-0.17270.431819
24-0.077317-0.53570.29733
250.0149670.10370.458921
260.0651430.45130.326894
27-0.059816-0.41440.340206
280.0053810.03730.485208
290.0278940.19330.423787
300.0394930.27360.392777
310.016730.11590.454104
320.0051190.03550.485927
33-0.006223-0.04310.482895
34-0.01366-0.09460.462496
350.0722250.50040.309543
360.0654810.45370.326057


Partial Autocorrelation Function
Time lag kPACF(k)T-STATP-value
10.3060042.12010.019599
20.1398470.96890.16873
3-0.006638-0.0460.481755
40.1328920.92070.180905
50.0606420.42010.33813
6-0.135858-0.94130.175645
7-0.175979-1.21920.11436
8-0.33123-2.29480.013079
90.1342550.93010.178476
10-0.083148-0.57610.283631
11-0.05452-0.37770.35365
12-0.272682-1.88920.032457
13-0.008854-0.06130.475671
140.0120230.08330.466981
15-0.006678-0.04630.481646
160.0780310.54060.295636
170.0463950.32140.37464
18-0.183538-1.27160.104823
190.0503720.3490.364313
20-0.107351-0.74370.230327
21-0.097078-0.67260.252221
22-0.076829-0.53230.298492
23-0.057336-0.39720.346477
24-0.229265-1.58840.059382
25-0.024285-0.16830.433545
260.0725720.50280.308705
27-0.020044-0.13890.445068
280.0976550.67660.250962
290.0295090.20440.419436
30-0.118073-0.8180.20869
31-0.035688-0.24730.402884
32-0.104551-0.72430.236184
33-0.079908-0.55360.291204
34-0.061626-0.4270.33566
35-0.017582-0.12180.451779
36-0.05101-0.35340.362665

\begin{tabular}{lllllllll}
\hline
Partial Autocorrelation Function \tabularnewline
Time lag k & PACF(k) & T-STAT & P-value \tabularnewline
1 & 0.306004 & 2.1201 & 0.019599 \tabularnewline
2 & 0.139847 & 0.9689 & 0.16873 \tabularnewline
3 & -0.006638 & -0.046 & 0.481755 \tabularnewline
4 & 0.132892 & 0.9207 & 0.180905 \tabularnewline
5 & 0.060642 & 0.4201 & 0.33813 \tabularnewline
6 & -0.135858 & -0.9413 & 0.175645 \tabularnewline
7 & -0.175979 & -1.2192 & 0.11436 \tabularnewline
8 & -0.33123 & -2.2948 & 0.013079 \tabularnewline
9 & 0.134255 & 0.9301 & 0.178476 \tabularnewline
10 & -0.083148 & -0.5761 & 0.283631 \tabularnewline
11 & -0.05452 & -0.3777 & 0.35365 \tabularnewline
12 & -0.272682 & -1.8892 & 0.032457 \tabularnewline
13 & -0.008854 & -0.0613 & 0.475671 \tabularnewline
14 & 0.012023 & 0.0833 & 0.466981 \tabularnewline
15 & -0.006678 & -0.0463 & 0.481646 \tabularnewline
16 & 0.078031 & 0.5406 & 0.295636 \tabularnewline
17 & 0.046395 & 0.3214 & 0.37464 \tabularnewline
18 & -0.183538 & -1.2716 & 0.104823 \tabularnewline
19 & 0.050372 & 0.349 & 0.364313 \tabularnewline
20 & -0.107351 & -0.7437 & 0.230327 \tabularnewline
21 & -0.097078 & -0.6726 & 0.252221 \tabularnewline
22 & -0.076829 & -0.5323 & 0.298492 \tabularnewline
23 & -0.057336 & -0.3972 & 0.346477 \tabularnewline
24 & -0.229265 & -1.5884 & 0.059382 \tabularnewline
25 & -0.024285 & -0.1683 & 0.433545 \tabularnewline
26 & 0.072572 & 0.5028 & 0.308705 \tabularnewline
27 & -0.020044 & -0.1389 & 0.445068 \tabularnewline
28 & 0.097655 & 0.6766 & 0.250962 \tabularnewline
29 & 0.029509 & 0.2044 & 0.419436 \tabularnewline
30 & -0.118073 & -0.818 & 0.20869 \tabularnewline
31 & -0.035688 & -0.2473 & 0.402884 \tabularnewline
32 & -0.104551 & -0.7243 & 0.236184 \tabularnewline
33 & -0.079908 & -0.5536 & 0.291204 \tabularnewline
34 & -0.061626 & -0.427 & 0.33566 \tabularnewline
35 & -0.017582 & -0.1218 & 0.451779 \tabularnewline
36 & -0.05101 & -0.3534 & 0.362665 \tabularnewline
\hline
\end{tabular}
%Source: https://freestatistics.org/blog/index.php?pk=62391&T=2

[TABLE]
[ROW][C]Partial Autocorrelation Function[/C][/ROW]
[ROW][C]Time lag k[/C][C]PACF(k)[/C][C]T-STAT[/C][C]P-value[/C][/ROW]
[ROW][C]1[/C][C]0.306004[/C][C]2.1201[/C][C]0.019599[/C][/ROW]
[ROW][C]2[/C][C]0.139847[/C][C]0.9689[/C][C]0.16873[/C][/ROW]
[ROW][C]3[/C][C]-0.006638[/C][C]-0.046[/C][C]0.481755[/C][/ROW]
[ROW][C]4[/C][C]0.132892[/C][C]0.9207[/C][C]0.180905[/C][/ROW]
[ROW][C]5[/C][C]0.060642[/C][C]0.4201[/C][C]0.33813[/C][/ROW]
[ROW][C]6[/C][C]-0.135858[/C][C]-0.9413[/C][C]0.175645[/C][/ROW]
[ROW][C]7[/C][C]-0.175979[/C][C]-1.2192[/C][C]0.11436[/C][/ROW]
[ROW][C]8[/C][C]-0.33123[/C][C]-2.2948[/C][C]0.013079[/C][/ROW]
[ROW][C]9[/C][C]0.134255[/C][C]0.9301[/C][C]0.178476[/C][/ROW]
[ROW][C]10[/C][C]-0.083148[/C][C]-0.5761[/C][C]0.283631[/C][/ROW]
[ROW][C]11[/C][C]-0.05452[/C][C]-0.3777[/C][C]0.35365[/C][/ROW]
[ROW][C]12[/C][C]-0.272682[/C][C]-1.8892[/C][C]0.032457[/C][/ROW]
[ROW][C]13[/C][C]-0.008854[/C][C]-0.0613[/C][C]0.475671[/C][/ROW]
[ROW][C]14[/C][C]0.012023[/C][C]0.0833[/C][C]0.466981[/C][/ROW]
[ROW][C]15[/C][C]-0.006678[/C][C]-0.0463[/C][C]0.481646[/C][/ROW]
[ROW][C]16[/C][C]0.078031[/C][C]0.5406[/C][C]0.295636[/C][/ROW]
[ROW][C]17[/C][C]0.046395[/C][C]0.3214[/C][C]0.37464[/C][/ROW]
[ROW][C]18[/C][C]-0.183538[/C][C]-1.2716[/C][C]0.104823[/C][/ROW]
[ROW][C]19[/C][C]0.050372[/C][C]0.349[/C][C]0.364313[/C][/ROW]
[ROW][C]20[/C][C]-0.107351[/C][C]-0.7437[/C][C]0.230327[/C][/ROW]
[ROW][C]21[/C][C]-0.097078[/C][C]-0.6726[/C][C]0.252221[/C][/ROW]
[ROW][C]22[/C][C]-0.076829[/C][C]-0.5323[/C][C]0.298492[/C][/ROW]
[ROW][C]23[/C][C]-0.057336[/C][C]-0.3972[/C][C]0.346477[/C][/ROW]
[ROW][C]24[/C][C]-0.229265[/C][C]-1.5884[/C][C]0.059382[/C][/ROW]
[ROW][C]25[/C][C]-0.024285[/C][C]-0.1683[/C][C]0.433545[/C][/ROW]
[ROW][C]26[/C][C]0.072572[/C][C]0.5028[/C][C]0.308705[/C][/ROW]
[ROW][C]27[/C][C]-0.020044[/C][C]-0.1389[/C][C]0.445068[/C][/ROW]
[ROW][C]28[/C][C]0.097655[/C][C]0.6766[/C][C]0.250962[/C][/ROW]
[ROW][C]29[/C][C]0.029509[/C][C]0.2044[/C][C]0.419436[/C][/ROW]
[ROW][C]30[/C][C]-0.118073[/C][C]-0.818[/C][C]0.20869[/C][/ROW]
[ROW][C]31[/C][C]-0.035688[/C][C]-0.2473[/C][C]0.402884[/C][/ROW]
[ROW][C]32[/C][C]-0.104551[/C][C]-0.7243[/C][C]0.236184[/C][/ROW]
[ROW][C]33[/C][C]-0.079908[/C][C]-0.5536[/C][C]0.291204[/C][/ROW]
[ROW][C]34[/C][C]-0.061626[/C][C]-0.427[/C][C]0.33566[/C][/ROW]
[ROW][C]35[/C][C]-0.017582[/C][C]-0.1218[/C][C]0.451779[/C][/ROW]
[ROW][C]36[/C][C]-0.05101[/C][C]-0.3534[/C][C]0.362665[/C][/ROW]
[/TABLE]
Source: https://freestatistics.org/blog/index.php?pk=62391&T=2

Globally Unique Identifier (entire table): ba.freestatistics.org/blog/index.php?pk=62391&T=2

As an alternative you can also use a QR Code:  

The GUIDs for individual cells are displayed in the table below:

Partial Autocorrelation Function
Time lag kPACF(k)T-STATP-value
10.3060042.12010.019599
20.1398470.96890.16873
3-0.006638-0.0460.481755
40.1328920.92070.180905
50.0606420.42010.33813
6-0.135858-0.94130.175645
7-0.175979-1.21920.11436
8-0.33123-2.29480.013079
90.1342550.93010.178476
10-0.083148-0.57610.283631
11-0.05452-0.37770.35365
12-0.272682-1.88920.032457
13-0.008854-0.06130.475671
140.0120230.08330.466981
15-0.006678-0.04630.481646
160.0780310.54060.295636
170.0463950.32140.37464
18-0.183538-1.27160.104823
190.0503720.3490.364313
20-0.107351-0.74370.230327
21-0.097078-0.67260.252221
22-0.076829-0.53230.298492
23-0.057336-0.39720.346477
24-0.229265-1.58840.059382
25-0.024285-0.16830.433545
260.0725720.50280.308705
27-0.020044-0.13890.445068
280.0976550.67660.250962
290.0295090.20440.419436
30-0.118073-0.8180.20869
31-0.035688-0.24730.402884
32-0.104551-0.72430.236184
33-0.079908-0.55360.291204
34-0.061626-0.4270.33566
35-0.017582-0.12180.451779
36-0.05101-0.35340.362665


Parameters (Session):
par1 = 36 ; par2 = 1 ; par3 = 1 ; par4 = 1 ; par5 = 12 ; par6 = MA ; par7 = 0.95 ;
Parameters (R input):
par1 = 36 ; par2 = 1 ; par3 = 1 ; par4 = 1 ; par5 = 12 ; par6 = MA ; par7 = 0.95 ;
R code (references can be found in the software module):
if (par1 == 'Default') {
par1 = 10*log10(length(x))
} else {
par1 <- as.numeric(par1)
}
par2 <- as.numeric(par2)
par3 <- as.numeric(par3)
par4 <- as.numeric(par4)
par5 <- as.numeric(par5)
if (par6 == 'White Noise') par6 <- 'white' else par6 <- 'ma'
par7 <- as.numeric(par7)
if (par2 == 0) {
x <- log(x)
} else {
x <- (x ^ par2 - 1) / par2
}
if (par3 > 0) x <- diff(x,lag=1,difference=par3)
if (par4 > 0) x <- diff(x,lag=par5,difference=par4)
bitmap(file='pic1.png')
racf <- acf(x, par1, main='Autocorrelation', xlab='time lag', ylab='ACF', ci.type=par6, ci=par7, sub=paste('(lambda=',par2,', d=',par3,', D=',par4,', CI=', par7, ', CI type=',par6,')',sep=''))
dev.off()
bitmap(file='pic2.png')
rpacf <- pacf(x,par1,main='Partial Autocorrelation',xlab='lags',ylab='PACF')
dev.off()
(myacf <- c(racf$acf))
(mypacf <- c(rpacf$acf))
lengthx <- length(x)
sqrtn <- sqrt(lengthx)
load(file='createtable')
a<-table.start()
a<-table.row.start(a)
a<-table.element(a,'Autocorrelation Function',4,TRUE)
a<-table.row.end(a)
a<-table.row.start(a)
a<-table.element(a,'Time lag k',header=TRUE)
a<-table.element(a,hyperlink('basics.htm','ACF(k)','click here for more information about the Autocorrelation Function'),header=TRUE)
a<-table.element(a,'T-STAT',header=TRUE)
a<-table.element(a,'P-value',header=TRUE)
a<-table.row.end(a)
for (i in 2:(par1+1)) {
a<-table.row.start(a)
a<-table.element(a,i-1,header=TRUE)
a<-table.element(a,round(myacf[i],6))
mytstat <- myacf[i]*sqrtn
a<-table.element(a,round(mytstat,4))
a<-table.element(a,round(1-pt(abs(mytstat),lengthx),6))
a<-table.row.end(a)
}
a<-table.end(a)
table.save(a,file='mytable.tab')
a<-table.start()
a<-table.row.start(a)
a<-table.element(a,'Partial Autocorrelation Function',4,TRUE)
a<-table.row.end(a)
a<-table.row.start(a)
a<-table.element(a,'Time lag k',header=TRUE)
a<-table.element(a,hyperlink('basics.htm','PACF(k)','click here for more information about the Partial Autocorrelation Function'),header=TRUE)
a<-table.element(a,'T-STAT',header=TRUE)
a<-table.element(a,'P-value',header=TRUE)
a<-table.row.end(a)
for (i in 1:par1) {
a<-table.row.start(a)
a<-table.element(a,i,header=TRUE)
a<-table.element(a,round(mypacf[i],6))
mytstat <- mypacf[i]*sqrtn
a<-table.element(a,round(mytstat,4))
a<-table.element(a,round(1-pt(abs(mytstat),lengthx),6))
a<-table.row.end(a)
}
a<-table.end(a)
table.save(a,file='mytable1.tab')