Free Statistics

of Irreproducible Research!

Author's title

Author*The author of this computation has been verified*
R Software Modulerwasp_exponentialsmoothing.wasp
Title produced by softwareExponential Smoothing
Date of computationWed, 02 Dec 2009 09:10:30 -0700
Cite this page as followsStatistical Computations at FreeStatistics.org, Office for Research Development and Education, URL https://freestatistics.org/blog/index.php?v=date/2009/Dec/02/t125977027793qc5dff6stv62i.htm/, Retrieved Sun, 28 Apr 2024 13:57:54 +0000
Statistical Computations at FreeStatistics.org, Office for Research Development and Education, URL https://freestatistics.org/blog/index.php?pk=62410, Retrieved Sun, 28 Apr 2024 13:57:54 +0000
QR Codes:

Original text written by user:
IsPrivate?No (this computation is public)
User-defined keywords
Estimated Impact129
Family? (F = Feedback message, R = changed R code, M = changed R Module, P = changed Parameters, D = changed Data)
-     [Univariate Data Series] [data set] [2008-12-01 19:54:57] [b98453cac15ba1066b407e146608df68]
- RMP   [Exponential Smoothing] [] [2009-11-27 15:04:36] [b98453cac15ba1066b407e146608df68]
-   PD      [Exponential Smoothing] [Exponential smoot...] [2009-12-02 16:10:30] [cf272a759dc2b193d9a85354803ede7b] [Current]
Feedback Forum

Post a new message
Dataseries X:
108.5
112.3
116.6
115.5
120.1
132.9
128.1
129.3
132.5
131
124.9
120.8
122
122.1
127.4
135.2
137.3
135
136
138.4
134.7
138.4
133.9
133.6
141.2
151.8
155.4
156.6
161.6
160.7
156
159.5
168.7
169.9
169.9
185.9
190.8
195.8
211.9
227.1
251.3
256.7
251.9
251.2
270.3
267.2
243
229.9
187.2
178.2
175.2
192.4
187
184
194.1
212.7
217.5
200.5
205.9
196.5
206.3


Summary of computational transaction
Raw Inputview raw input (R code)
Raw Outputview raw output of R engine
Computing time1 seconds
R Server'Gwilym Jenkins' @ 72.249.127.135

\begin{tabular}{lllllllll}
\hline
Summary of computational transaction \tabularnewline
Raw Input & view raw input (R code)  \tabularnewline
Raw Output & view raw output of R engine  \tabularnewline
Computing time & 1 seconds \tabularnewline
R Server & 'Gwilym Jenkins' @ 72.249.127.135 \tabularnewline
\hline
\end{tabular}
%Source: https://freestatistics.org/blog/index.php?pk=62410&T=0

[TABLE]
[ROW][C]Summary of computational transaction[/C][/ROW]
[ROW][C]Raw Input[/C][C]view raw input (R code) [/C][/ROW]
[ROW][C]Raw Output[/C][C]view raw output of R engine [/C][/ROW]
[ROW][C]Computing time[/C][C]1 seconds[/C][/ROW]
[ROW][C]R Server[/C][C]'Gwilym Jenkins' @ 72.249.127.135[/C][/ROW]
[/TABLE]
Source: https://freestatistics.org/blog/index.php?pk=62410&T=0

Globally Unique Identifier (entire table): ba.freestatistics.org/blog/index.php?pk=62410&T=0

As an alternative you can also use a QR Code:  

The GUIDs for individual cells are displayed in the table below:

Summary of computational transaction
Raw Inputview raw input (R code)
Raw Outputview raw output of R engine
Computing time1 seconds
R Server'Gwilym Jenkins' @ 72.249.127.135


Estimated Parameters of Exponential Smoothing
ParameterValue
alpha1
beta0
gamma0

\begin{tabular}{lllllllll}
\hline
Estimated Parameters of Exponential Smoothing \tabularnewline
Parameter & Value \tabularnewline
alpha & 1 \tabularnewline
beta & 0 \tabularnewline
gamma & 0 \tabularnewline
\hline
\end{tabular}
%Source: https://freestatistics.org/blog/index.php?pk=62410&T=1

[TABLE]
[ROW][C]Estimated Parameters of Exponential Smoothing[/C][/ROW]
[ROW][C]Parameter[/C][C]Value[/C][/ROW]
[ROW][C]alpha[/C][C]1[/C][/ROW]
[ROW][C]beta[/C][C]0[/C][/ROW]
[ROW][C]gamma[/C][C]0[/C][/ROW]
[/TABLE]
Source: https://freestatistics.org/blog/index.php?pk=62410&T=1

Globally Unique Identifier (entire table): ba.freestatistics.org/blog/index.php?pk=62410&T=1

As an alternative you can also use a QR Code:  

The GUIDs for individual cells are displayed in the table below:

Estimated Parameters of Exponential Smoothing
ParameterValue
alpha1
beta0
gamma0


Interpolation Forecasts of Exponential Smoothing
tObservedFittedResiduals
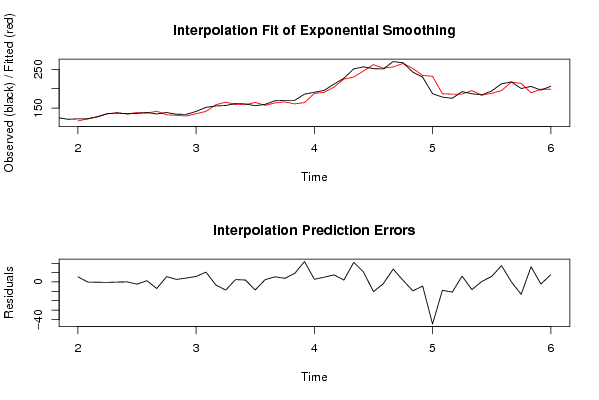
13122116.5163977263135.48360227368678
14122.1122.182945499263-0.0829454992628911
15127.4127.718432479231-0.318432479230864
16135.2135.610161653526-0.410161653525876
17137.3137.418292153351-0.118292153351263
18135134.8859201746690.114079825330947
19136138.310626170459-2.31062617045879
20138.4137.0303006886631.36969931133706
21134.7141.695776982594-6.99577698259381
22138.4132.6615482257445.73845177425594
23133.9131.1470735827212.75292641727867
24133.6129.4430170828364.15698291716396
25141.2135.2443357785065.955664221494
26151.8141.29385102903110.5061489709687
27155.4158.595650753974-3.19565075397423
28156.6165.233514265211-8.63351426521129
29161.6159.0376641526922.56233584730774
30160.7158.6148134071262.08518659287409
31156164.483294211696-8.48329421169589
32159.5157.0599088831382.44009111686202
33168.7163.1696196923915.53038030760914
34169.9165.9385963464483.961403653552
35169.9160.8192707296139.08072927038745
36185.9164.04373508561521.8562649143846
37190.8187.8934371198272.90656288017317
38195.8190.6636903142665.13630968573352
39211.9204.3396778276687.56032217233187
40227.1225.0092079280772.09079207192346
41251.3230.26036162715721.0396383728433
42256.7246.206653857810.4933461422000
43251.9262.248902459119-10.3489024591186
44251.2253.101880175646-1.90188017564591
45270.3256.49432947857113.8056705214294
46267.2265.3782460247871.82175397521314
47243252.473390805565-9.47339080556546
48229.9234.302415252370-4.40241525237033
49187.2232.18713614503-44.9871361450299
50178.2187.080395527435-8.8803955274349
51175.2186.042066998191-10.8420669981906
52192.4186.1814564691896.21854353081119
53187195.204650955328-8.20465095532813
54184183.4178540698590.582145930141422
55194.1188.2118220467475.88817795325252
56212.7195.21631249361317.4836875063870
57217.5217.3121994156710.187800584329267
58200.5213.700947766753-13.2009477667525
59205.9189.64369081516416.2563091848360
60196.5198.644453088395-2.14445308839490
61206.3198.5641918849897.73580811501066

\begin{tabular}{lllllllll}
\hline
Interpolation Forecasts of Exponential Smoothing \tabularnewline
t & Observed & Fitted & Residuals \tabularnewline
13 & 122 & 116.516397726313 & 5.48360227368678 \tabularnewline
14 & 122.1 & 122.182945499263 & -0.0829454992628911 \tabularnewline
15 & 127.4 & 127.718432479231 & -0.318432479230864 \tabularnewline
16 & 135.2 & 135.610161653526 & -0.410161653525876 \tabularnewline
17 & 137.3 & 137.418292153351 & -0.118292153351263 \tabularnewline
18 & 135 & 134.885920174669 & 0.114079825330947 \tabularnewline
19 & 136 & 138.310626170459 & -2.31062617045879 \tabularnewline
20 & 138.4 & 137.030300688663 & 1.36969931133706 \tabularnewline
21 & 134.7 & 141.695776982594 & -6.99577698259381 \tabularnewline
22 & 138.4 & 132.661548225744 & 5.73845177425594 \tabularnewline
23 & 133.9 & 131.147073582721 & 2.75292641727867 \tabularnewline
24 & 133.6 & 129.443017082836 & 4.15698291716396 \tabularnewline
25 & 141.2 & 135.244335778506 & 5.955664221494 \tabularnewline
26 & 151.8 & 141.293851029031 & 10.5061489709687 \tabularnewline
27 & 155.4 & 158.595650753974 & -3.19565075397423 \tabularnewline
28 & 156.6 & 165.233514265211 & -8.63351426521129 \tabularnewline
29 & 161.6 & 159.037664152692 & 2.56233584730774 \tabularnewline
30 & 160.7 & 158.614813407126 & 2.08518659287409 \tabularnewline
31 & 156 & 164.483294211696 & -8.48329421169589 \tabularnewline
32 & 159.5 & 157.059908883138 & 2.44009111686202 \tabularnewline
33 & 168.7 & 163.169619692391 & 5.53038030760914 \tabularnewline
34 & 169.9 & 165.938596346448 & 3.961403653552 \tabularnewline
35 & 169.9 & 160.819270729613 & 9.08072927038745 \tabularnewline
36 & 185.9 & 164.043735085615 & 21.8562649143846 \tabularnewline
37 & 190.8 & 187.893437119827 & 2.90656288017317 \tabularnewline
38 & 195.8 & 190.663690314266 & 5.13630968573352 \tabularnewline
39 & 211.9 & 204.339677827668 & 7.56032217233187 \tabularnewline
40 & 227.1 & 225.009207928077 & 2.09079207192346 \tabularnewline
41 & 251.3 & 230.260361627157 & 21.0396383728433 \tabularnewline
42 & 256.7 & 246.2066538578 & 10.4933461422000 \tabularnewline
43 & 251.9 & 262.248902459119 & -10.3489024591186 \tabularnewline
44 & 251.2 & 253.101880175646 & -1.90188017564591 \tabularnewline
45 & 270.3 & 256.494329478571 & 13.8056705214294 \tabularnewline
46 & 267.2 & 265.378246024787 & 1.82175397521314 \tabularnewline
47 & 243 & 252.473390805565 & -9.47339080556546 \tabularnewline
48 & 229.9 & 234.302415252370 & -4.40241525237033 \tabularnewline
49 & 187.2 & 232.18713614503 & -44.9871361450299 \tabularnewline
50 & 178.2 & 187.080395527435 & -8.8803955274349 \tabularnewline
51 & 175.2 & 186.042066998191 & -10.8420669981906 \tabularnewline
52 & 192.4 & 186.181456469189 & 6.21854353081119 \tabularnewline
53 & 187 & 195.204650955328 & -8.20465095532813 \tabularnewline
54 & 184 & 183.417854069859 & 0.582145930141422 \tabularnewline
55 & 194.1 & 188.211822046747 & 5.88817795325252 \tabularnewline
56 & 212.7 & 195.216312493613 & 17.4836875063870 \tabularnewline
57 & 217.5 & 217.312199415671 & 0.187800584329267 \tabularnewline
58 & 200.5 & 213.700947766753 & -13.2009477667525 \tabularnewline
59 & 205.9 & 189.643690815164 & 16.2563091848360 \tabularnewline
60 & 196.5 & 198.644453088395 & -2.14445308839490 \tabularnewline
61 & 206.3 & 198.564191884989 & 7.73580811501066 \tabularnewline
\hline
\end{tabular}
%Source: https://freestatistics.org/blog/index.php?pk=62410&T=2

[TABLE]
[ROW][C]Interpolation Forecasts of Exponential Smoothing[/C][/ROW]
[ROW][C]t[/C][C]Observed[/C][C]Fitted[/C][C]Residuals[/C][/ROW]
[ROW][C]13[/C][C]122[/C][C]116.516397726313[/C][C]5.48360227368678[/C][/ROW]
[ROW][C]14[/C][C]122.1[/C][C]122.182945499263[/C][C]-0.0829454992628911[/C][/ROW]
[ROW][C]15[/C][C]127.4[/C][C]127.718432479231[/C][C]-0.318432479230864[/C][/ROW]
[ROW][C]16[/C][C]135.2[/C][C]135.610161653526[/C][C]-0.410161653525876[/C][/ROW]
[ROW][C]17[/C][C]137.3[/C][C]137.418292153351[/C][C]-0.118292153351263[/C][/ROW]
[ROW][C]18[/C][C]135[/C][C]134.885920174669[/C][C]0.114079825330947[/C][/ROW]
[ROW][C]19[/C][C]136[/C][C]138.310626170459[/C][C]-2.31062617045879[/C][/ROW]
[ROW][C]20[/C][C]138.4[/C][C]137.030300688663[/C][C]1.36969931133706[/C][/ROW]
[ROW][C]21[/C][C]134.7[/C][C]141.695776982594[/C][C]-6.99577698259381[/C][/ROW]
[ROW][C]22[/C][C]138.4[/C][C]132.661548225744[/C][C]5.73845177425594[/C][/ROW]
[ROW][C]23[/C][C]133.9[/C][C]131.147073582721[/C][C]2.75292641727867[/C][/ROW]
[ROW][C]24[/C][C]133.6[/C][C]129.443017082836[/C][C]4.15698291716396[/C][/ROW]
[ROW][C]25[/C][C]141.2[/C][C]135.244335778506[/C][C]5.955664221494[/C][/ROW]
[ROW][C]26[/C][C]151.8[/C][C]141.293851029031[/C][C]10.5061489709687[/C][/ROW]
[ROW][C]27[/C][C]155.4[/C][C]158.595650753974[/C][C]-3.19565075397423[/C][/ROW]
[ROW][C]28[/C][C]156.6[/C][C]165.233514265211[/C][C]-8.63351426521129[/C][/ROW]
[ROW][C]29[/C][C]161.6[/C][C]159.037664152692[/C][C]2.56233584730774[/C][/ROW]
[ROW][C]30[/C][C]160.7[/C][C]158.614813407126[/C][C]2.08518659287409[/C][/ROW]
[ROW][C]31[/C][C]156[/C][C]164.483294211696[/C][C]-8.48329421169589[/C][/ROW]
[ROW][C]32[/C][C]159.5[/C][C]157.059908883138[/C][C]2.44009111686202[/C][/ROW]
[ROW][C]33[/C][C]168.7[/C][C]163.169619692391[/C][C]5.53038030760914[/C][/ROW]
[ROW][C]34[/C][C]169.9[/C][C]165.938596346448[/C][C]3.961403653552[/C][/ROW]
[ROW][C]35[/C][C]169.9[/C][C]160.819270729613[/C][C]9.08072927038745[/C][/ROW]
[ROW][C]36[/C][C]185.9[/C][C]164.043735085615[/C][C]21.8562649143846[/C][/ROW]
[ROW][C]37[/C][C]190.8[/C][C]187.893437119827[/C][C]2.90656288017317[/C][/ROW]
[ROW][C]38[/C][C]195.8[/C][C]190.663690314266[/C][C]5.13630968573352[/C][/ROW]
[ROW][C]39[/C][C]211.9[/C][C]204.339677827668[/C][C]7.56032217233187[/C][/ROW]
[ROW][C]40[/C][C]227.1[/C][C]225.009207928077[/C][C]2.09079207192346[/C][/ROW]
[ROW][C]41[/C][C]251.3[/C][C]230.260361627157[/C][C]21.0396383728433[/C][/ROW]
[ROW][C]42[/C][C]256.7[/C][C]246.2066538578[/C][C]10.4933461422000[/C][/ROW]
[ROW][C]43[/C][C]251.9[/C][C]262.248902459119[/C][C]-10.3489024591186[/C][/ROW]
[ROW][C]44[/C][C]251.2[/C][C]253.101880175646[/C][C]-1.90188017564591[/C][/ROW]
[ROW][C]45[/C][C]270.3[/C][C]256.494329478571[/C][C]13.8056705214294[/C][/ROW]
[ROW][C]46[/C][C]267.2[/C][C]265.378246024787[/C][C]1.82175397521314[/C][/ROW]
[ROW][C]47[/C][C]243[/C][C]252.473390805565[/C][C]-9.47339080556546[/C][/ROW]
[ROW][C]48[/C][C]229.9[/C][C]234.302415252370[/C][C]-4.40241525237033[/C][/ROW]
[ROW][C]49[/C][C]187.2[/C][C]232.18713614503[/C][C]-44.9871361450299[/C][/ROW]
[ROW][C]50[/C][C]178.2[/C][C]187.080395527435[/C][C]-8.8803955274349[/C][/ROW]
[ROW][C]51[/C][C]175.2[/C][C]186.042066998191[/C][C]-10.8420669981906[/C][/ROW]
[ROW][C]52[/C][C]192.4[/C][C]186.181456469189[/C][C]6.21854353081119[/C][/ROW]
[ROW][C]53[/C][C]187[/C][C]195.204650955328[/C][C]-8.20465095532813[/C][/ROW]
[ROW][C]54[/C][C]184[/C][C]183.417854069859[/C][C]0.582145930141422[/C][/ROW]
[ROW][C]55[/C][C]194.1[/C][C]188.211822046747[/C][C]5.88817795325252[/C][/ROW]
[ROW][C]56[/C][C]212.7[/C][C]195.216312493613[/C][C]17.4836875063870[/C][/ROW]
[ROW][C]57[/C][C]217.5[/C][C]217.312199415671[/C][C]0.187800584329267[/C][/ROW]
[ROW][C]58[/C][C]200.5[/C][C]213.700947766753[/C][C]-13.2009477667525[/C][/ROW]
[ROW][C]59[/C][C]205.9[/C][C]189.643690815164[/C][C]16.2563091848360[/C][/ROW]
[ROW][C]60[/C][C]196.5[/C][C]198.644453088395[/C][C]-2.14445308839490[/C][/ROW]
[ROW][C]61[/C][C]206.3[/C][C]198.564191884989[/C][C]7.73580811501066[/C][/ROW]
[/TABLE]
Source: https://freestatistics.org/blog/index.php?pk=62410&T=2

Globally Unique Identifier (entire table): ba.freestatistics.org/blog/index.php?pk=62410&T=2

As an alternative you can also use a QR Code:  

The GUIDs for individual cells are displayed in the table below:

Interpolation Forecasts of Exponential Smoothing
tObservedFittedResiduals
13122116.5163977263135.48360227368678
14122.1122.182945499263-0.0829454992628911
15127.4127.718432479231-0.318432479230864
16135.2135.610161653526-0.410161653525876
17137.3137.418292153351-0.118292153351263
18135134.8859201746690.114079825330947
19136138.310626170459-2.31062617045879
20138.4137.0303006886631.36969931133706
21134.7141.695776982594-6.99577698259381
22138.4132.6615482257445.73845177425594
23133.9131.1470735827212.75292641727867
24133.6129.4430170828364.15698291716396
25141.2135.2443357785065.955664221494
26151.8141.29385102903110.5061489709687
27155.4158.595650753974-3.19565075397423
28156.6165.233514265211-8.63351426521129
29161.6159.0376641526922.56233584730774
30160.7158.6148134071262.08518659287409
31156164.483294211696-8.48329421169589
32159.5157.0599088831382.44009111686202
33168.7163.1696196923915.53038030760914
34169.9165.9385963464483.961403653552
35169.9160.8192707296139.08072927038745
36185.9164.04373508561521.8562649143846
37190.8187.8934371198272.90656288017317
38195.8190.6636903142665.13630968573352
39211.9204.3396778276687.56032217233187
40227.1225.0092079280772.09079207192346
41251.3230.26036162715721.0396383728433
42256.7246.206653857810.4933461422000
43251.9262.248902459119-10.3489024591186
44251.2253.101880175646-1.90188017564591
45270.3256.49432947857113.8056705214294
46267.2265.3782460247871.82175397521314
47243252.473390805565-9.47339080556546
48229.9234.302415252370-4.40241525237033
49187.2232.18713614503-44.9871361450299
50178.2187.080395527435-8.8803955274349
51175.2186.042066998191-10.8420669981906
52192.4186.1814564691896.21854353081119
53187195.204650955328-8.20465095532813
54184183.4178540698590.582145930141422
55194.1188.2118220467475.88817795325252
56212.7195.21631249361317.4836875063870
57217.5217.3121994156710.187800584329267
58200.5213.700947766753-13.2009477667525
59205.9189.64369081516416.2563091848360
60196.5198.644453088395-2.14445308839490
61206.3198.5641918849897.73580811501066


Extrapolation Forecasts of Exponential Smoothing
tForecast95% Lower Bound95% Upper Bound
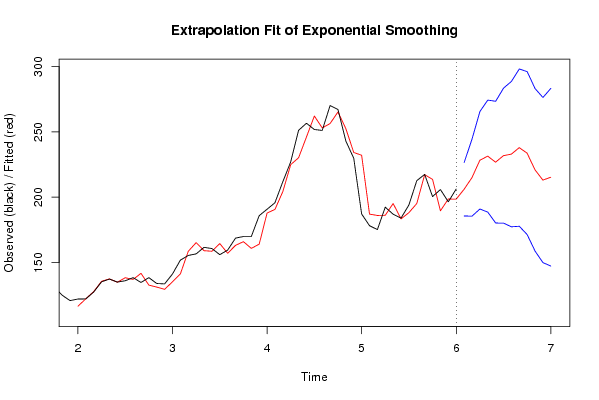
62206.091765090902185.623894483243226.559635698562
63215.039377394812185.514198788967244.564556000658
64228.330596626208190.985166291131265.676026961285
65231.503573133845188.580906818577274.426239449112
66226.875489269687180.231011058486273.519967480888
67231.875866706714180.151528484447283.600204928982
68233.048102960723177.350094443693288.746111477753
69238.020823227108177.753870261532298.287776192684
70233.785430766897171.349699910565296.22116162323
71220.997718238484158.725035072443283.270401404525
72213.155338956595149.900135738223276.410542174967
73215.330704860129147.258284662347283.403125057911

\begin{tabular}{lllllllll}
\hline
Extrapolation Forecasts of Exponential Smoothing \tabularnewline
t & Forecast & 95% Lower Bound & 95% Upper Bound \tabularnewline
62 & 206.091765090902 & 185.623894483243 & 226.559635698562 \tabularnewline
63 & 215.039377394812 & 185.514198788967 & 244.564556000658 \tabularnewline
64 & 228.330596626208 & 190.985166291131 & 265.676026961285 \tabularnewline
65 & 231.503573133845 & 188.580906818577 & 274.426239449112 \tabularnewline
66 & 226.875489269687 & 180.231011058486 & 273.519967480888 \tabularnewline
67 & 231.875866706714 & 180.151528484447 & 283.600204928982 \tabularnewline
68 & 233.048102960723 & 177.350094443693 & 288.746111477753 \tabularnewline
69 & 238.020823227108 & 177.753870261532 & 298.287776192684 \tabularnewline
70 & 233.785430766897 & 171.349699910565 & 296.22116162323 \tabularnewline
71 & 220.997718238484 & 158.725035072443 & 283.270401404525 \tabularnewline
72 & 213.155338956595 & 149.900135738223 & 276.410542174967 \tabularnewline
73 & 215.330704860129 & 147.258284662347 & 283.403125057911 \tabularnewline
\hline
\end{tabular}
%Source: https://freestatistics.org/blog/index.php?pk=62410&T=3

[TABLE]
[ROW][C]Extrapolation Forecasts of Exponential Smoothing[/C][/ROW]
[ROW][C]t[/C][C]Forecast[/C][C]95% Lower Bound[/C][C]95% Upper Bound[/C][/ROW]
[ROW][C]62[/C][C]206.091765090902[/C][C]185.623894483243[/C][C]226.559635698562[/C][/ROW]
[ROW][C]63[/C][C]215.039377394812[/C][C]185.514198788967[/C][C]244.564556000658[/C][/ROW]
[ROW][C]64[/C][C]228.330596626208[/C][C]190.985166291131[/C][C]265.676026961285[/C][/ROW]
[ROW][C]65[/C][C]231.503573133845[/C][C]188.580906818577[/C][C]274.426239449112[/C][/ROW]
[ROW][C]66[/C][C]226.875489269687[/C][C]180.231011058486[/C][C]273.519967480888[/C][/ROW]
[ROW][C]67[/C][C]231.875866706714[/C][C]180.151528484447[/C][C]283.600204928982[/C][/ROW]
[ROW][C]68[/C][C]233.048102960723[/C][C]177.350094443693[/C][C]288.746111477753[/C][/ROW]
[ROW][C]69[/C][C]238.020823227108[/C][C]177.753870261532[/C][C]298.287776192684[/C][/ROW]
[ROW][C]70[/C][C]233.785430766897[/C][C]171.349699910565[/C][C]296.22116162323[/C][/ROW]
[ROW][C]71[/C][C]220.997718238484[/C][C]158.725035072443[/C][C]283.270401404525[/C][/ROW]
[ROW][C]72[/C][C]213.155338956595[/C][C]149.900135738223[/C][C]276.410542174967[/C][/ROW]
[ROW][C]73[/C][C]215.330704860129[/C][C]147.258284662347[/C][C]283.403125057911[/C][/ROW]
[/TABLE]
Source: https://freestatistics.org/blog/index.php?pk=62410&T=3

Globally Unique Identifier (entire table): ba.freestatistics.org/blog/index.php?pk=62410&T=3

As an alternative you can also use a QR Code:  

The GUIDs for individual cells are displayed in the table below:

Extrapolation Forecasts of Exponential Smoothing
tForecast95% Lower Bound95% Upper Bound
62206.091765090902185.623894483243226.559635698562
63215.039377394812185.514198788967244.564556000658
64228.330596626208190.985166291131265.676026961285
65231.503573133845188.580906818577274.426239449112
66226.875489269687180.231011058486273.519967480888
67231.875866706714180.151528484447283.600204928982
68233.048102960723177.350094443693288.746111477753
69238.020823227108177.753870261532298.287776192684
70233.785430766897171.349699910565296.22116162323
71220.997718238484158.725035072443283.270401404525
72213.155338956595149.900135738223276.410542174967
73215.330704860129147.258284662347283.403125057911


Parameters (Session):
par1 = 12 ; par2 = periodic ; par3 = 0 ; par5 = 1 ; par7 = 1 ; par8 = FALSE ;
Parameters (R input):
par1 = 12 ; par2 = Triple ; par3 = multiplicative ;
R code (references can be found in the software module):
par1 <- as.numeric(par1)
if (par2 == 'Single') K <- 1
if (par2 == 'Double') K <- 2
if (par2 == 'Triple') K <- par1
nx <- length(x)
nxmK <- nx - K
x <- ts(x, frequency = par1)
if (par2 == 'Single') fit <- HoltWinters(x, gamma=0, beta=0)
if (par2 == 'Double') fit <- HoltWinters(x, gamma=0)
if (par2 == 'Triple') fit <- HoltWinters(x, seasonal=par3)
fit
myresid <- x - fit$fitted[,'xhat']
bitmap(file='test1.png')
op <- par(mfrow=c(2,1))
plot(fit,ylab='Observed (black) / Fitted (red)',main='Interpolation Fit of Exponential Smoothing')
plot(myresid,ylab='Residuals',main='Interpolation Prediction Errors')
par(op)
dev.off()
bitmap(file='test2.png')
p <- predict(fit, par1, prediction.interval=TRUE)
np <- length(p[,1])
plot(fit,p,ylab='Observed (black) / Fitted (red)',main='Extrapolation Fit of Exponential Smoothing')
dev.off()
bitmap(file='test3.png')
op <- par(mfrow = c(2,2))
acf(as.numeric(myresid),lag.max = nx/2,main='Residual ACF')
spectrum(myresid,main='Residals Periodogram')
cpgram(myresid,main='Residal Cumulative Periodogram')
qqnorm(myresid,main='Residual Normal QQ Plot')
qqline(myresid)
par(op)
dev.off()
load(file='createtable')
a<-table.start()
a<-table.row.start(a)
a<-table.element(a,'Estimated Parameters of Exponential Smoothing',2,TRUE)
a<-table.row.end(a)
a<-table.row.start(a)
a<-table.element(a,'Parameter',header=TRUE)
a<-table.element(a,'Value',header=TRUE)
a<-table.row.end(a)
a<-table.row.start(a)
a<-table.element(a,'alpha',header=TRUE)
a<-table.element(a,fit$alpha)
a<-table.row.end(a)
a<-table.row.start(a)
a<-table.element(a,'beta',header=TRUE)
a<-table.element(a,fit$beta)
a<-table.row.end(a)
a<-table.row.start(a)
a<-table.element(a,'gamma',header=TRUE)
a<-table.element(a,fit$gamma)
a<-table.row.end(a)
a<-table.end(a)
table.save(a,file='mytable.tab')
a<-table.start()
a<-table.row.start(a)
a<-table.element(a,'Interpolation Forecasts of Exponential Smoothing',4,TRUE)
a<-table.row.end(a)
a<-table.row.start(a)
a<-table.element(a,'t',header=TRUE)
a<-table.element(a,'Observed',header=TRUE)
a<-table.element(a,'Fitted',header=TRUE)
a<-table.element(a,'Residuals',header=TRUE)
a<-table.row.end(a)
for (i in 1:nxmK) {
a<-table.row.start(a)
a<-table.element(a,i+K,header=TRUE)
a<-table.element(a,x[i+K])
a<-table.element(a,fit$fitted[i,'xhat'])
a<-table.element(a,myresid[i])
a<-table.row.end(a)
}
a<-table.end(a)
table.save(a,file='mytable1.tab')
a<-table.start()
a<-table.row.start(a)
a<-table.element(a,'Extrapolation Forecasts of Exponential Smoothing',4,TRUE)
a<-table.row.end(a)
a<-table.row.start(a)
a<-table.element(a,'t',header=TRUE)
a<-table.element(a,'Forecast',header=TRUE)
a<-table.element(a,'95% Lower Bound',header=TRUE)
a<-table.element(a,'95% Upper Bound',header=TRUE)
a<-table.row.end(a)
for (i in 1:np) {
a<-table.row.start(a)
a<-table.element(a,nx+i,header=TRUE)
a<-table.element(a,p[i,'fit'])
a<-table.element(a,p[i,'lwr'])
a<-table.element(a,p[i,'upr'])
a<-table.row.end(a)
}
a<-table.end(a)
table.save(a,file='mytable2.tab')