Free Statistics

of Irreproducible Research!

Author's title

Author*The author of this computation has been verified*
R Software Modulerwasp_exponentialsmoothing.wasp
Title produced by softwareExponential Smoothing
Date of computationWed, 02 Dec 2009 11:05:56 -0700
Cite this page as followsStatistical Computations at FreeStatistics.org, Office for Research Development and Education, URL https://freestatistics.org/blog/index.php?v=date/2009/Dec/02/t1259777182nrnmu1q1j8xxvqr.htm/, Retrieved Sat, 27 Apr 2024 20:32:07 +0000
Statistical Computations at FreeStatistics.org, Office for Research Development and Education, URL https://freestatistics.org/blog/index.php?pk=62505, Retrieved Sat, 27 Apr 2024 20:32:07 +0000
QR Codes:

Original text written by user:
IsPrivate?No (this computation is public)
User-defined keywords
Estimated Impact202
Family? (F = Feedback message, R = changed R code, M = changed R Module, P = changed Parameters, D = changed Data)
-     [Univariate Data Series] [data set] [2008-12-01 19:54:57] [b98453cac15ba1066b407e146608df68]
- RMP   [Exponential Smoothing] [] [2009-11-27 15:04:36] [b98453cac15ba1066b407e146608df68]
-   PD    [Exponential Smoothing] [WS9 Berekening5 TVD] [2009-12-02 17:06:59] [42ad1186d39724f834063794eac7cea3]
-   P         [Exponential Smoothing] [TG 11] [2009-12-02 18:05:56] [81cf732ffd29c90ba583bd04c2d9af10] [Current]
-   P           [Exponential Smoothing] [WorkShop9 (SHW)] [2009-12-04 15:03:25] [37daf76adc256428993ec4063536c760]
Feedback Forum

Post a new message
Dataseries X:
101.3
106.3
94
102.8
102
105.1
92.4
81.4
105.8
120.3
100.7
88.8
94.3
99.9
103.4
103.3
98.8
104.2
91.2
74.7
108.5
114.5
96.9
89.6
97.1
100.3
122.6
115.4
109
129.1
102.8
96.2
127.7
128.9
126.5
119.8
113.2
114.1
134.1
130
121.8
132.1
105.3
103
117.1
126.3
138.1
119.5
138
135.5
178.6
162.2
176.9
204.9
132.2
142.5
164.3
174.9
175.4
143


Summary of computational transaction
Raw Inputview raw input (R code)
Raw Outputview raw output of R engine
Computing time2 seconds
R Server'Gwilym Jenkins' @ 72.249.127.135

\begin{tabular}{lllllllll}
\hline
Summary of computational transaction \tabularnewline
Raw Input & view raw input (R code)  \tabularnewline
Raw Output & view raw output of R engine  \tabularnewline
Computing time & 2 seconds \tabularnewline
R Server & 'Gwilym Jenkins' @ 72.249.127.135 \tabularnewline
\hline
\end{tabular}
%Source: https://freestatistics.org/blog/index.php?pk=62505&T=0

[TABLE]
[ROW][C]Summary of computational transaction[/C][/ROW]
[ROW][C]Raw Input[/C][C]view raw input (R code) [/C][/ROW]
[ROW][C]Raw Output[/C][C]view raw output of R engine [/C][/ROW]
[ROW][C]Computing time[/C][C]2 seconds[/C][/ROW]
[ROW][C]R Server[/C][C]'Gwilym Jenkins' @ 72.249.127.135[/C][/ROW]
[/TABLE]
Source: https://freestatistics.org/blog/index.php?pk=62505&T=0

Globally Unique Identifier (entire table): ba.freestatistics.org/blog/index.php?pk=62505&T=0

As an alternative you can also use a QR Code:  

The GUIDs for individual cells are displayed in the table below:

Summary of computational transaction
Raw Inputview raw input (R code)
Raw Outputview raw output of R engine
Computing time2 seconds
R Server'Gwilym Jenkins' @ 72.249.127.135


Estimated Parameters of Exponential Smoothing
ParameterValue
alpha0.538234095178943
beta0.0232178286592899
gamma1

\begin{tabular}{lllllllll}
\hline
Estimated Parameters of Exponential Smoothing \tabularnewline
Parameter & Value \tabularnewline
alpha & 0.538234095178943 \tabularnewline
beta & 0.0232178286592899 \tabularnewline
gamma & 1 \tabularnewline
\hline
\end{tabular}
%Source: https://freestatistics.org/blog/index.php?pk=62505&T=1

[TABLE]
[ROW][C]Estimated Parameters of Exponential Smoothing[/C][/ROW]
[ROW][C]Parameter[/C][C]Value[/C][/ROW]
[ROW][C]alpha[/C][C]0.538234095178943[/C][/ROW]
[ROW][C]beta[/C][C]0.0232178286592899[/C][/ROW]
[ROW][C]gamma[/C][C]1[/C][/ROW]
[/TABLE]
Source: https://freestatistics.org/blog/index.php?pk=62505&T=1

Globally Unique Identifier (entire table): ba.freestatistics.org/blog/index.php?pk=62505&T=1

As an alternative you can also use a QR Code:  

The GUIDs for individual cells are displayed in the table below:

Estimated Parameters of Exponential Smoothing
ParameterValue
alpha0.538234095178943
beta0.0232178286592899
gamma1


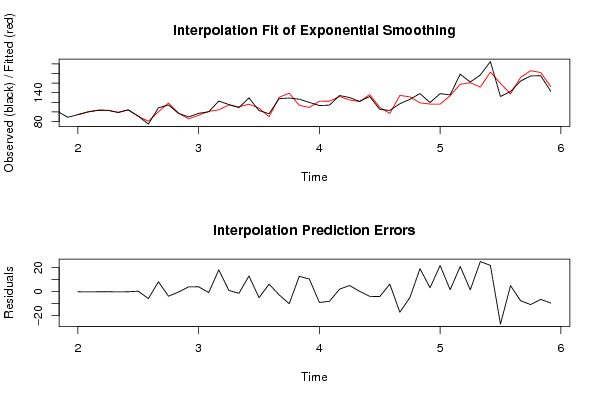
Interpolation Forecasts of Exponential Smoothing
tObservedFittedResiduals
1394.394.4541327487931-0.154132748793131
1499.9100.182665505570-0.282665505570307
15103.4103.576391634863-0.17639163486308
16103.3103.381132655799-0.0811326557986831
1798.899.1066978574685-0.306697857468507
18104.2104.339706776836-0.139706776835723
1991.290.90285782466630.29714217533369
2074.780.5651648994184-5.8651648994184
21108.5100.2495970842518.25040291574938
22114.5118.395883939474-3.89588393947369
2396.997.2942017659042-0.394201765904199
2489.685.60511077428653.99488922571346
2597.193.09442642636114.0055735736389
26100.3101.124895310867-0.824895310866722
27122.6104.36361068025318.2363893197466
28115.4114.4199624387520.980037561247855
29109110.428210848222-1.42821084822168
30129.1116.04372766805613.0562723319438
31102.8107.949789100898-5.14978910089761
3296.289.96124242340746.23875757659263
33127.7130.457030927630-2.75703092762963
34128.9139.082322558604-10.1823225586044
35126.5113.69382546656512.8061745334350
36119.8109.27619321751210.523806782488
37113.2122.355316398518-9.1553163985184
38114.1122.277683356958-8.17768335695764
39134.1132.0924307681232.00756923187706
40130124.9142636918785.08573630812199
41121.8121.5924029690720.207597030928483
42132.1136.134500215314-4.03450021531441
43105.3109.485738727959-4.18573872795943
4410396.75008735087086.24991264912924
45117.1134.434857984773-17.3348579847732
46126.3131.301664544883-5.0016645448831
47138.1118.90375329170519.1962467082949
48119.5116.3297606643563.17023933564421
49138116.10251430874121.8974856912592
50135.5133.9493867164321.55061328356837
51178.6157.52959282688421.0704071731165
52162.2160.7771251510301.42287484896968
53176.9151.70234536649825.1976546335016
54204.9182.98006245003021.9199375499696
55132.2159.446438274746-27.2464382747464
56142.5137.5017559802164.99824401978364
57164.3171.997508697770-7.69750869776959
58174.9185.817293055036-10.9172930550364
59175.4181.966006571080-6.56600657108038
60143152.630404480321-9.63040448032146

\begin{tabular}{lllllllll}
\hline
Interpolation Forecasts of Exponential Smoothing \tabularnewline
t & Observed & Fitted & Residuals \tabularnewline
13 & 94.3 & 94.4541327487931 & -0.154132748793131 \tabularnewline
14 & 99.9 & 100.182665505570 & -0.282665505570307 \tabularnewline
15 & 103.4 & 103.576391634863 & -0.17639163486308 \tabularnewline
16 & 103.3 & 103.381132655799 & -0.0811326557986831 \tabularnewline
17 & 98.8 & 99.1066978574685 & -0.306697857468507 \tabularnewline
18 & 104.2 & 104.339706776836 & -0.139706776835723 \tabularnewline
19 & 91.2 & 90.9028578246663 & 0.29714217533369 \tabularnewline
20 & 74.7 & 80.5651648994184 & -5.8651648994184 \tabularnewline
21 & 108.5 & 100.249597084251 & 8.25040291574938 \tabularnewline
22 & 114.5 & 118.395883939474 & -3.89588393947369 \tabularnewline
23 & 96.9 & 97.2942017659042 & -0.394201765904199 \tabularnewline
24 & 89.6 & 85.6051107742865 & 3.99488922571346 \tabularnewline
25 & 97.1 & 93.0944264263611 & 4.0055735736389 \tabularnewline
26 & 100.3 & 101.124895310867 & -0.824895310866722 \tabularnewline
27 & 122.6 & 104.363610680253 & 18.2363893197466 \tabularnewline
28 & 115.4 & 114.419962438752 & 0.980037561247855 \tabularnewline
29 & 109 & 110.428210848222 & -1.42821084822168 \tabularnewline
30 & 129.1 & 116.043727668056 & 13.0562723319438 \tabularnewline
31 & 102.8 & 107.949789100898 & -5.14978910089761 \tabularnewline
32 & 96.2 & 89.9612424234074 & 6.23875757659263 \tabularnewline
33 & 127.7 & 130.457030927630 & -2.75703092762963 \tabularnewline
34 & 128.9 & 139.082322558604 & -10.1823225586044 \tabularnewline
35 & 126.5 & 113.693825466565 & 12.8061745334350 \tabularnewline
36 & 119.8 & 109.276193217512 & 10.523806782488 \tabularnewline
37 & 113.2 & 122.355316398518 & -9.1553163985184 \tabularnewline
38 & 114.1 & 122.277683356958 & -8.17768335695764 \tabularnewline
39 & 134.1 & 132.092430768123 & 2.00756923187706 \tabularnewline
40 & 130 & 124.914263691878 & 5.08573630812199 \tabularnewline
41 & 121.8 & 121.592402969072 & 0.207597030928483 \tabularnewline
42 & 132.1 & 136.134500215314 & -4.03450021531441 \tabularnewline
43 & 105.3 & 109.485738727959 & -4.18573872795943 \tabularnewline
44 & 103 & 96.7500873508708 & 6.24991264912924 \tabularnewline
45 & 117.1 & 134.434857984773 & -17.3348579847732 \tabularnewline
46 & 126.3 & 131.301664544883 & -5.0016645448831 \tabularnewline
47 & 138.1 & 118.903753291705 & 19.1962467082949 \tabularnewline
48 & 119.5 & 116.329760664356 & 3.17023933564421 \tabularnewline
49 & 138 & 116.102514308741 & 21.8974856912592 \tabularnewline
50 & 135.5 & 133.949386716432 & 1.55061328356837 \tabularnewline
51 & 178.6 & 157.529592826884 & 21.0704071731165 \tabularnewline
52 & 162.2 & 160.777125151030 & 1.42287484896968 \tabularnewline
53 & 176.9 & 151.702345366498 & 25.1976546335016 \tabularnewline
54 & 204.9 & 182.980062450030 & 21.9199375499696 \tabularnewline
55 & 132.2 & 159.446438274746 & -27.2464382747464 \tabularnewline
56 & 142.5 & 137.501755980216 & 4.99824401978364 \tabularnewline
57 & 164.3 & 171.997508697770 & -7.69750869776959 \tabularnewline
58 & 174.9 & 185.817293055036 & -10.9172930550364 \tabularnewline
59 & 175.4 & 181.966006571080 & -6.56600657108038 \tabularnewline
60 & 143 & 152.630404480321 & -9.63040448032146 \tabularnewline
\hline
\end{tabular}
%Source: https://freestatistics.org/blog/index.php?pk=62505&T=2

[TABLE]
[ROW][C]Interpolation Forecasts of Exponential Smoothing[/C][/ROW]
[ROW][C]t[/C][C]Observed[/C][C]Fitted[/C][C]Residuals[/C][/ROW]
[ROW][C]13[/C][C]94.3[/C][C]94.4541327487931[/C][C]-0.154132748793131[/C][/ROW]
[ROW][C]14[/C][C]99.9[/C][C]100.182665505570[/C][C]-0.282665505570307[/C][/ROW]
[ROW][C]15[/C][C]103.4[/C][C]103.576391634863[/C][C]-0.17639163486308[/C][/ROW]
[ROW][C]16[/C][C]103.3[/C][C]103.381132655799[/C][C]-0.0811326557986831[/C][/ROW]
[ROW][C]17[/C][C]98.8[/C][C]99.1066978574685[/C][C]-0.306697857468507[/C][/ROW]
[ROW][C]18[/C][C]104.2[/C][C]104.339706776836[/C][C]-0.139706776835723[/C][/ROW]
[ROW][C]19[/C][C]91.2[/C][C]90.9028578246663[/C][C]0.29714217533369[/C][/ROW]
[ROW][C]20[/C][C]74.7[/C][C]80.5651648994184[/C][C]-5.8651648994184[/C][/ROW]
[ROW][C]21[/C][C]108.5[/C][C]100.249597084251[/C][C]8.25040291574938[/C][/ROW]
[ROW][C]22[/C][C]114.5[/C][C]118.395883939474[/C][C]-3.89588393947369[/C][/ROW]
[ROW][C]23[/C][C]96.9[/C][C]97.2942017659042[/C][C]-0.394201765904199[/C][/ROW]
[ROW][C]24[/C][C]89.6[/C][C]85.6051107742865[/C][C]3.99488922571346[/C][/ROW]
[ROW][C]25[/C][C]97.1[/C][C]93.0944264263611[/C][C]4.0055735736389[/C][/ROW]
[ROW][C]26[/C][C]100.3[/C][C]101.124895310867[/C][C]-0.824895310866722[/C][/ROW]
[ROW][C]27[/C][C]122.6[/C][C]104.363610680253[/C][C]18.2363893197466[/C][/ROW]
[ROW][C]28[/C][C]115.4[/C][C]114.419962438752[/C][C]0.980037561247855[/C][/ROW]
[ROW][C]29[/C][C]109[/C][C]110.428210848222[/C][C]-1.42821084822168[/C][/ROW]
[ROW][C]30[/C][C]129.1[/C][C]116.043727668056[/C][C]13.0562723319438[/C][/ROW]
[ROW][C]31[/C][C]102.8[/C][C]107.949789100898[/C][C]-5.14978910089761[/C][/ROW]
[ROW][C]32[/C][C]96.2[/C][C]89.9612424234074[/C][C]6.23875757659263[/C][/ROW]
[ROW][C]33[/C][C]127.7[/C][C]130.457030927630[/C][C]-2.75703092762963[/C][/ROW]
[ROW][C]34[/C][C]128.9[/C][C]139.082322558604[/C][C]-10.1823225586044[/C][/ROW]
[ROW][C]35[/C][C]126.5[/C][C]113.693825466565[/C][C]12.8061745334350[/C][/ROW]
[ROW][C]36[/C][C]119.8[/C][C]109.276193217512[/C][C]10.523806782488[/C][/ROW]
[ROW][C]37[/C][C]113.2[/C][C]122.355316398518[/C][C]-9.1553163985184[/C][/ROW]
[ROW][C]38[/C][C]114.1[/C][C]122.277683356958[/C][C]-8.17768335695764[/C][/ROW]
[ROW][C]39[/C][C]134.1[/C][C]132.092430768123[/C][C]2.00756923187706[/C][/ROW]
[ROW][C]40[/C][C]130[/C][C]124.914263691878[/C][C]5.08573630812199[/C][/ROW]
[ROW][C]41[/C][C]121.8[/C][C]121.592402969072[/C][C]0.207597030928483[/C][/ROW]
[ROW][C]42[/C][C]132.1[/C][C]136.134500215314[/C][C]-4.03450021531441[/C][/ROW]
[ROW][C]43[/C][C]105.3[/C][C]109.485738727959[/C][C]-4.18573872795943[/C][/ROW]
[ROW][C]44[/C][C]103[/C][C]96.7500873508708[/C][C]6.24991264912924[/C][/ROW]
[ROW][C]45[/C][C]117.1[/C][C]134.434857984773[/C][C]-17.3348579847732[/C][/ROW]
[ROW][C]46[/C][C]126.3[/C][C]131.301664544883[/C][C]-5.0016645448831[/C][/ROW]
[ROW][C]47[/C][C]138.1[/C][C]118.903753291705[/C][C]19.1962467082949[/C][/ROW]
[ROW][C]48[/C][C]119.5[/C][C]116.329760664356[/C][C]3.17023933564421[/C][/ROW]
[ROW][C]49[/C][C]138[/C][C]116.102514308741[/C][C]21.8974856912592[/C][/ROW]
[ROW][C]50[/C][C]135.5[/C][C]133.949386716432[/C][C]1.55061328356837[/C][/ROW]
[ROW][C]51[/C][C]178.6[/C][C]157.529592826884[/C][C]21.0704071731165[/C][/ROW]
[ROW][C]52[/C][C]162.2[/C][C]160.777125151030[/C][C]1.42287484896968[/C][/ROW]
[ROW][C]53[/C][C]176.9[/C][C]151.702345366498[/C][C]25.1976546335016[/C][/ROW]
[ROW][C]54[/C][C]204.9[/C][C]182.980062450030[/C][C]21.9199375499696[/C][/ROW]
[ROW][C]55[/C][C]132.2[/C][C]159.446438274746[/C][C]-27.2464382747464[/C][/ROW]
[ROW][C]56[/C][C]142.5[/C][C]137.501755980216[/C][C]4.99824401978364[/C][/ROW]
[ROW][C]57[/C][C]164.3[/C][C]171.997508697770[/C][C]-7.69750869776959[/C][/ROW]
[ROW][C]58[/C][C]174.9[/C][C]185.817293055036[/C][C]-10.9172930550364[/C][/ROW]
[ROW][C]59[/C][C]175.4[/C][C]181.966006571080[/C][C]-6.56600657108038[/C][/ROW]
[ROW][C]60[/C][C]143[/C][C]152.630404480321[/C][C]-9.63040448032146[/C][/ROW]
[/TABLE]
Source: https://freestatistics.org/blog/index.php?pk=62505&T=2

Globally Unique Identifier (entire table): ba.freestatistics.org/blog/index.php?pk=62505&T=2

As an alternative you can also use a QR Code:  

The GUIDs for individual cells are displayed in the table below:

Interpolation Forecasts of Exponential Smoothing
tObservedFittedResiduals
1394.394.4541327487931-0.154132748793131
1499.9100.182665505570-0.282665505570307
15103.4103.576391634863-0.17639163486308
16103.3103.381132655799-0.0811326557986831
1798.899.1066978574685-0.306697857468507
18104.2104.339706776836-0.139706776835723
1991.290.90285782466630.29714217533369
2074.780.5651648994184-5.8651648994184
21108.5100.2495970842518.25040291574938
22114.5118.395883939474-3.89588393947369
2396.997.2942017659042-0.394201765904199
2489.685.60511077428653.99488922571346
2597.193.09442642636114.0055735736389
26100.3101.124895310867-0.824895310866722
27122.6104.36361068025318.2363893197466
28115.4114.4199624387520.980037561247855
29109110.428210848222-1.42821084822168
30129.1116.04372766805613.0562723319438
31102.8107.949789100898-5.14978910089761
3296.289.96124242340746.23875757659263
33127.7130.457030927630-2.75703092762963
34128.9139.082322558604-10.1823225586044
35126.5113.69382546656512.8061745334350
36119.8109.27619321751210.523806782488
37113.2122.355316398518-9.1553163985184
38114.1122.277683356958-8.17768335695764
39134.1132.0924307681232.00756923187706
40130124.9142636918785.08573630812199
41121.8121.5924029690720.207597030928483
42132.1136.134500215314-4.03450021531441
43105.3109.485738727959-4.18573872795943
4410396.75008735087086.24991264912924
45117.1134.434857984773-17.3348579847732
46126.3131.301664544883-5.0016645448831
47138.1118.90375329170519.1962467082949
48119.5116.3297606643563.17023933564421
49138116.10251430874121.8974856912592
50135.5133.9493867164321.55061328356837
51178.6157.52959282688421.0704071731165
52162.2160.7771251510301.42287484896968
53176.9151.70234536649825.1976546335016
54204.9182.98006245003021.9199375499696
55132.2159.446438274746-27.2464382747464
56142.5137.5017559802164.99824401978364
57164.3171.997508697770-7.69750869776959
58174.9185.817293055036-10.9172930550364
59175.4181.966006571080-6.56600657108038
60143152.630404480321-9.63040448032146


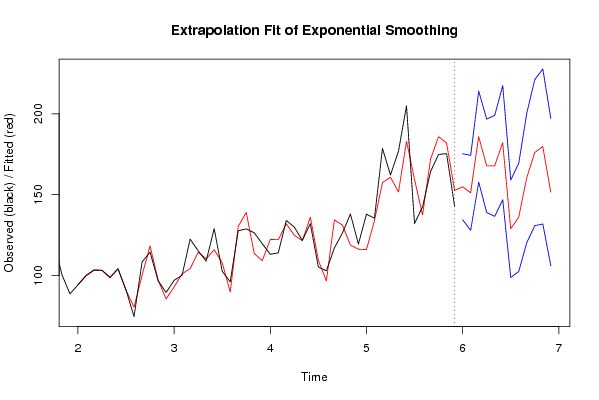
Extrapolation Forecasts of Exponential Smoothing
tForecast95% Lower Bound95% Upper Bound
61154.906145319681134.516619699860175.295670939502
62151.190887041065128.068184598979174.313589483151
63185.917537707719157.797222696804214.037852718633
64167.855878973763138.977903161071196.733854786455
65167.844387759039136.648748792447199.040026725632
66182.164835445819146.925425754458217.404245137179
67128.98454359807798.877419175487159.091668020667
68136.100008959898102.645128914268169.554889005528
69160.433767175071120.445197018018200.422337332123
70176.040609525912130.901917426485221.179301625339
71179.813767407059131.931985657152227.695549156967
72151.614316411782106.124975628897197.103657194668

\begin{tabular}{lllllllll}
\hline
Extrapolation Forecasts of Exponential Smoothing \tabularnewline
t & Forecast & 95% Lower Bound & 95% Upper Bound \tabularnewline
61 & 154.906145319681 & 134.516619699860 & 175.295670939502 \tabularnewline
62 & 151.190887041065 & 128.068184598979 & 174.313589483151 \tabularnewline
63 & 185.917537707719 & 157.797222696804 & 214.037852718633 \tabularnewline
64 & 167.855878973763 & 138.977903161071 & 196.733854786455 \tabularnewline
65 & 167.844387759039 & 136.648748792447 & 199.040026725632 \tabularnewline
66 & 182.164835445819 & 146.925425754458 & 217.404245137179 \tabularnewline
67 & 128.984543598077 & 98.877419175487 & 159.091668020667 \tabularnewline
68 & 136.100008959898 & 102.645128914268 & 169.554889005528 \tabularnewline
69 & 160.433767175071 & 120.445197018018 & 200.422337332123 \tabularnewline
70 & 176.040609525912 & 130.901917426485 & 221.179301625339 \tabularnewline
71 & 179.813767407059 & 131.931985657152 & 227.695549156967 \tabularnewline
72 & 151.614316411782 & 106.124975628897 & 197.103657194668 \tabularnewline
\hline
\end{tabular}
%Source: https://freestatistics.org/blog/index.php?pk=62505&T=3

[TABLE]
[ROW][C]Extrapolation Forecasts of Exponential Smoothing[/C][/ROW]
[ROW][C]t[/C][C]Forecast[/C][C]95% Lower Bound[/C][C]95% Upper Bound[/C][/ROW]
[ROW][C]61[/C][C]154.906145319681[/C][C]134.516619699860[/C][C]175.295670939502[/C][/ROW]
[ROW][C]62[/C][C]151.190887041065[/C][C]128.068184598979[/C][C]174.313589483151[/C][/ROW]
[ROW][C]63[/C][C]185.917537707719[/C][C]157.797222696804[/C][C]214.037852718633[/C][/ROW]
[ROW][C]64[/C][C]167.855878973763[/C][C]138.977903161071[/C][C]196.733854786455[/C][/ROW]
[ROW][C]65[/C][C]167.844387759039[/C][C]136.648748792447[/C][C]199.040026725632[/C][/ROW]
[ROW][C]66[/C][C]182.164835445819[/C][C]146.925425754458[/C][C]217.404245137179[/C][/ROW]
[ROW][C]67[/C][C]128.984543598077[/C][C]98.877419175487[/C][C]159.091668020667[/C][/ROW]
[ROW][C]68[/C][C]136.100008959898[/C][C]102.645128914268[/C][C]169.554889005528[/C][/ROW]
[ROW][C]69[/C][C]160.433767175071[/C][C]120.445197018018[/C][C]200.422337332123[/C][/ROW]
[ROW][C]70[/C][C]176.040609525912[/C][C]130.901917426485[/C][C]221.179301625339[/C][/ROW]
[ROW][C]71[/C][C]179.813767407059[/C][C]131.931985657152[/C][C]227.695549156967[/C][/ROW]
[ROW][C]72[/C][C]151.614316411782[/C][C]106.124975628897[/C][C]197.103657194668[/C][/ROW]
[/TABLE]
Source: https://freestatistics.org/blog/index.php?pk=62505&T=3

Globally Unique Identifier (entire table): ba.freestatistics.org/blog/index.php?pk=62505&T=3

As an alternative you can also use a QR Code:  

The GUIDs for individual cells are displayed in the table below:

Extrapolation Forecasts of Exponential Smoothing
tForecast95% Lower Bound95% Upper Bound
61154.906145319681134.516619699860175.295670939502
62151.190887041065128.068184598979174.313589483151
63185.917537707719157.797222696804214.037852718633
64167.855878973763138.977903161071196.733854786455
65167.844387759039136.648748792447199.040026725632
66182.164835445819146.925425754458217.404245137179
67128.98454359807798.877419175487159.091668020667
68136.100008959898102.645128914268169.554889005528
69160.433767175071120.445197018018200.422337332123
70176.040609525912130.901917426485221.179301625339
71179.813767407059131.931985657152227.695549156967
72151.614316411782106.124975628897197.103657194668


Parameters (Session):
par1 = 12 ; par2 = Triple ; par3 = multiplicative ;
Parameters (R input):
par1 = 12 ; par2 = Triple ; par3 = multiplicative ; par4 = ; par5 = ; par6 = ; par7 = ; par8 = ; par9 = ; par10 = ; par11 = ; par12 = ; par13 = ; par14 = ; par15 = ; par16 = ; par17 = ; par18 = ; par19 = ; par20 = ;
R code (references can be found in the software module):
par1 <- as.numeric(par1)
if (par2 == 'Single') K <- 1
if (par2 == 'Double') K <- 2
if (par2 == 'Triple') K <- par1
nx <- length(x)
nxmK <- nx - K
x <- ts(x, frequency = par1)
if (par2 == 'Single') fit <- HoltWinters(x, gamma=0, beta=0)
if (par2 == 'Double') fit <- HoltWinters(x, gamma=0)
if (par2 == 'Triple') fit <- HoltWinters(x, seasonal=par3)
fit
myresid <- x - fit$fitted[,'xhat']
bitmap(file='test1.png')
op <- par(mfrow=c(2,1))
plot(fit,ylab='Observed (black) / Fitted (red)',main='Interpolation Fit of Exponential Smoothing')
plot(myresid,ylab='Residuals',main='Interpolation Prediction Errors')
par(op)
dev.off()
bitmap(file='test2.png')
p <- predict(fit, par1, prediction.interval=TRUE)
np <- length(p[,1])
plot(fit,p,ylab='Observed (black) / Fitted (red)',main='Extrapolation Fit of Exponential Smoothing')
dev.off()
bitmap(file='test3.png')
op <- par(mfrow = c(2,2))
acf(as.numeric(myresid),lag.max = nx/2,main='Residual ACF')
spectrum(myresid,main='Residals Periodogram')
cpgram(myresid,main='Residal Cumulative Periodogram')
qqnorm(myresid,main='Residual Normal QQ Plot')
qqline(myresid)
par(op)
dev.off()
load(file='createtable')
a<-table.start()
a<-table.row.start(a)
a<-table.element(a,'Estimated Parameters of Exponential Smoothing',2,TRUE)
a<-table.row.end(a)
a<-table.row.start(a)
a<-table.element(a,'Parameter',header=TRUE)
a<-table.element(a,'Value',header=TRUE)
a<-table.row.end(a)
a<-table.row.start(a)
a<-table.element(a,'alpha',header=TRUE)
a<-table.element(a,fit$alpha)
a<-table.row.end(a)
a<-table.row.start(a)
a<-table.element(a,'beta',header=TRUE)
a<-table.element(a,fit$beta)
a<-table.row.end(a)
a<-table.row.start(a)
a<-table.element(a,'gamma',header=TRUE)
a<-table.element(a,fit$gamma)
a<-table.row.end(a)
a<-table.end(a)
table.save(a,file='mytable.tab')
a<-table.start()
a<-table.row.start(a)
a<-table.element(a,'Interpolation Forecasts of Exponential Smoothing',4,TRUE)
a<-table.row.end(a)
a<-table.row.start(a)
a<-table.element(a,'t',header=TRUE)
a<-table.element(a,'Observed',header=TRUE)
a<-table.element(a,'Fitted',header=TRUE)
a<-table.element(a,'Residuals',header=TRUE)
a<-table.row.end(a)
for (i in 1:nxmK) {
a<-table.row.start(a)
a<-table.element(a,i+K,header=TRUE)
a<-table.element(a,x[i+K])
a<-table.element(a,fit$fitted[i,'xhat'])
a<-table.element(a,myresid[i])
a<-table.row.end(a)
}
a<-table.end(a)
table.save(a,file='mytable1.tab')
a<-table.start()
a<-table.row.start(a)
a<-table.element(a,'Extrapolation Forecasts of Exponential Smoothing',4,TRUE)
a<-table.row.end(a)
a<-table.row.start(a)
a<-table.element(a,'t',header=TRUE)
a<-table.element(a,'Forecast',header=TRUE)
a<-table.element(a,'95% Lower Bound',header=TRUE)
a<-table.element(a,'95% Upper Bound',header=TRUE)
a<-table.row.end(a)
for (i in 1:np) {
a<-table.row.start(a)
a<-table.element(a,nx+i,header=TRUE)
a<-table.element(a,p[i,'fit'])
a<-table.element(a,p[i,'lwr'])
a<-table.element(a,p[i,'upr'])
a<-table.row.end(a)
}
a<-table.end(a)
table.save(a,file='mytable2.tab')