Free Statistics
of Irreproducible Research!
Description of Statistical Computation | |||||||||||||||||||||||||||||||||||||||||
|---|---|---|---|---|---|---|---|---|---|---|---|---|---|---|---|---|---|---|---|---|---|---|---|---|---|---|---|---|---|---|---|---|---|---|---|---|---|---|---|---|---|
| Author's title | |||||||||||||||||||||||||||||||||||||||||
| Author | *The author of this computation has been verified* | ||||||||||||||||||||||||||||||||||||||||
| R Software Module | rwasp_univariatedataseries.wasp | ||||||||||||||||||||||||||||||||||||||||
| Title produced by software | Univariate Data Series | ||||||||||||||||||||||||||||||||||||||||
| Date of computation | Wed, 02 Dec 2009 11:06:02 -0700 | ||||||||||||||||||||||||||||||||||||||||
| Cite this page as follows | Statistical Computations at FreeStatistics.org, Office for Research Development and Education, URL https://freestatistics.org/blog/index.php?v=date/2009/Dec/02/t12597772421jphxsnxxoj7noe.htm/, Retrieved Sun, 28 Apr 2024 11:30:39 +0000 | ||||||||||||||||||||||||||||||||||||||||
| Statistical Computations at FreeStatistics.org, Office for Research Development and Education, URL https://freestatistics.org/blog/index.php?pk=62506, Retrieved Sun, 28 Apr 2024 11:30:39 +0000 | |||||||||||||||||||||||||||||||||||||||||
| QR Codes: | |||||||||||||||||||||||||||||||||||||||||
|
| |||||||||||||||||||||||||||||||||||||||||
| Original text written by user: | |||||||||||||||||||||||||||||||||||||||||
| IsPrivate? | No (this computation is public) | ||||||||||||||||||||||||||||||||||||||||
| User-defined keywords | |||||||||||||||||||||||||||||||||||||||||
| Estimated Impact | 122 | ||||||||||||||||||||||||||||||||||||||||
Tree of Dependent Computations | |||||||||||||||||||||||||||||||||||||||||
| Family? (F = Feedback message, R = changed R code, M = changed R Module, P = changed Parameters, D = changed Data) | |||||||||||||||||||||||||||||||||||||||||
| F [Univariate Data Series] [Omzetcijfer Bouwn...] [2009-10-08 20:44:00] [74be16979710d4c4e7c6647856088456] - MPD [Univariate Data Series] [Omzet Voedings en...] [2009-12-02 18:06:02] [026d431dc78a3ce53a040b5408fc0322] [Current] - PD [Univariate Data Series] [workshop 8 ] [2009-12-04 13:46:43] [af8eb90b4bf1bcfcc4325c143dbee260] | |||||||||||||||||||||||||||||||||||||||||
| Feedback Forum | |||||||||||||||||||||||||||||||||||||||||
Post a new message | |||||||||||||||||||||||||||||||||||||||||
Dataset | |||||||||||||||||||||||||||||||||||||||||
| Dataseries X: | |||||||||||||||||||||||||||||||||||||||||
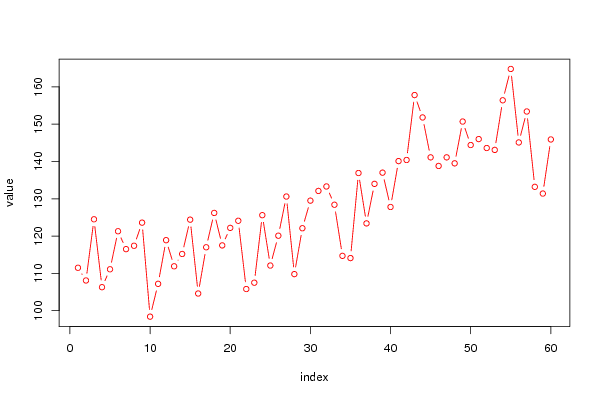
111.5 108.1 124.5 106.3 111.1 121.3 116.5 117.4 123.6 98.4 107.2 118.9 111.9 115.2 124.4 104.6 117 126.2 117.5 122.2 124.1 105.8 107.5 125.6 112.1 120.1 130.6 109.8 122.1 129.5 132.1 133.3 128.4 114.7 114.1 136.9 123.4 134 137 127.8 140.1 140.4 157.8 151.8 141.1 138.8 141.1 139.5 150.7 144.4 146 143.6 143.1 156.4 164.8 145.1 153.4 133.2 131.4 145.9 | |||||||||||||||||||||||||||||||||||||||||
Tables (Output of Computation) | |||||||||||||||||||||||||||||||||||||||||
| |||||||||||||||||||||||||||||||||||||||||
Figures (Output of Computation) | |||||||||||||||||||||||||||||||||||||||||
Input Parameters & R Code | |||||||||||||||||||||||||||||||||||||||||
| Parameters (Session): | |||||||||||||||||||||||||||||||||||||||||
| par1 = Omzetcijfer Voedings- en genotsmiddelen Industrie 04-2004 - 03-2009 ; par2 = http://www.nbb.be/belgostat/PresentationLinker?TableId=383000075&Lang=N ; par3 = Omzetcijfer volgens BTW - Totale industrie (indexcijfers jaar 2000 = 100), Bewerkende industrie, Voedings- en genotmiddelen ; | |||||||||||||||||||||||||||||||||||||||||
| Parameters (R input): | |||||||||||||||||||||||||||||||||||||||||
| par1 = Omzetcijfer Voedings- en genotsmiddelen Industrie 04-2004 - 03-2009 ; par2 = http://www.nbb.be/belgostat/PresentationLinker?TableId=383000075&Lang=N ; par3 = Omzetcijfer volgens BTW - Totale industrie (indexcijfers jaar 2000 = 100), Bewerkende industrie, Voedings- en genotmiddelen ; | |||||||||||||||||||||||||||||||||||||||||
| R code (references can be found in the software module): | |||||||||||||||||||||||||||||||||||||||||
bitmap(file='test1.png') | |||||||||||||||||||||||||||||||||||||||||