Free Statistics

of Irreproducible Research!

Author's title

Author*The author of this computation has been verified*
R Software Modulerwasp_autocorrelation.wasp
Title produced by software(Partial) Autocorrelation Function
Date of computationWed, 02 Dec 2009 11:27:30 -0700
Cite this page as followsStatistical Computations at FreeStatistics.org, Office for Research Development and Education, URL https://freestatistics.org/blog/index.php?v=date/2009/Dec/02/t12597784962rwewez0vk2nrho.htm/, Retrieved Sun, 28 Apr 2024 07:06:56 +0000
Statistical Computations at FreeStatistics.org, Office for Research Development and Education, URL https://freestatistics.org/blog/index.php?pk=62519, Retrieved Sun, 28 Apr 2024 07:06:56 +0000
QR Codes:

Original text written by user:
IsPrivate?No (this computation is public)
User-defined keywords
Estimated Impact143
Family? (F = Feedback message, R = changed R code, M = changed R Module, P = changed Parameters, D = changed Data)
-     [Univariate Data Series] [data set] [2008-12-01 19:54:57] [b98453cac15ba1066b407e146608df68]
- RMP   [(Partial) Autocorrelation Function] [] [2009-11-27 14:46:03] [b98453cac15ba1066b407e146608df68]
- R PD      [(Partial) Autocorrelation Function] [] [2009-12-02 18:27:30] [fbab597368601c68e80be601720d8ff9] [Current]
Feedback Forum

Post a new message
Dataseries X:
79.8
83.4
113.6
112.9
104
109.9
99
106.3
128.9
111.1
102.9
130
87
87.5
117.6
103.4
110.8
112.6
102.5
112.4
135.6
105.1
127.7
137
91
90.5
122.4
123.3
124.3
120
118.1
119
142.7
123.6
129.6
151.6
110.4
99.2
130.5
136.2
129.7
128
121.6
135.8
143.8
147.5
136.2
156.6
123.3
104.5
139.8
136.5
112.1
118.5
94.4
102.3
111.4
99.2
87.8
115.8


Summary of computational transaction
Raw Inputview raw input (R code)
Raw Outputview raw output of R engine
Computing time1 seconds
R Server'Gwilym Jenkins' @ 72.249.127.135

\begin{tabular}{lllllllll}
\hline
Summary of computational transaction \tabularnewline
Raw Input & view raw input (R code)  \tabularnewline
Raw Output & view raw output of R engine  \tabularnewline
Computing time & 1 seconds \tabularnewline
R Server & 'Gwilym Jenkins' @ 72.249.127.135 \tabularnewline
\hline
\end{tabular}
%Source: https://freestatistics.org/blog/index.php?pk=62519&T=0

[TABLE]
[ROW][C]Summary of computational transaction[/C][/ROW]
[ROW][C]Raw Input[/C][C]view raw input (R code) [/C][/ROW]
[ROW][C]Raw Output[/C][C]view raw output of R engine [/C][/ROW]
[ROW][C]Computing time[/C][C]1 seconds[/C][/ROW]
[ROW][C]R Server[/C][C]'Gwilym Jenkins' @ 72.249.127.135[/C][/ROW]
[/TABLE]
Source: https://freestatistics.org/blog/index.php?pk=62519&T=0

Globally Unique Identifier (entire table): ba.freestatistics.org/blog/index.php?pk=62519&T=0

As an alternative you can also use a QR Code:  

The GUIDs for individual cells are displayed in the table below:

Summary of computational transaction
Raw Inputview raw input (R code)
Raw Outputview raw output of R engine
Computing time1 seconds
R Server'Gwilym Jenkins' @ 72.249.127.135


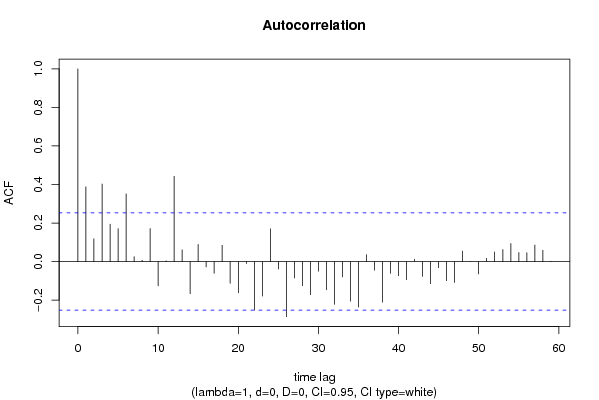
Autocorrelation Function
Time lag kACF(k)T-STATP-value
10.3877673.00360.001944
20.1176970.91170.182793
30.4021513.1150.00141
40.1939571.50240.069121
50.1707871.32290.095443
60.351242.72070.004256
70.0247650.19180.424262
80.0061180.04740.481181
90.1711751.32590.094947
10-0.126376-0.97890.165778
110.0036410.02820.488796
120.4426773.4290.000551
130.0606820.470.320015
14-0.167091-1.29430.100264
150.0888760.68840.246916
16-0.028071-0.21740.414303
17-0.06139-0.47550.318069
180.0842960.6530.258139
19-0.113004-0.87530.192444
20-0.162647-1.25990.1063
21-0.01042-0.08070.46797
22-0.252338-1.95460.027647
23-0.179518-1.39050.084751
240.1700581.31730.096379
25-0.039296-0.30440.380943
26-0.286355-2.21810.015172
27-0.085202-0.660.255899
28-0.125289-0.97050.167851
29-0.173228-1.34180.092356
30-0.050436-0.39070.348711
31-0.146779-1.13690.130041
32-0.222261-1.72160.045145
33-0.080369-0.62250.267975
34-0.205774-1.59390.058105
35-0.236709-1.83350.035842
360.0356970.27650.391554
37-0.045397-0.35160.363167
38-0.211277-1.63650.053481
39-0.061449-0.4760.317909
40-0.074515-0.57720.282984
41-0.094401-0.73120.233744
420.0111620.08650.465694
43-0.077691-0.60180.27479
44-0.114966-0.89050.18837
45-0.032534-0.2520.400948
46-0.099402-0.770.222171
47-0.108444-0.840.20212
480.0541410.41940.33822
490.00130.01010.495999
50-0.064251-0.49770.310261
510.0164330.12730.44957
520.0494170.38280.351616
530.0619830.48010.316446
540.09310.72120.236808
550.0465540.36060.359829
560.0460050.35640.361413
570.0854550.66190.255274
580.05810.450.327151
590.0016430.01270.494945
60NANANA

\begin{tabular}{lllllllll}
\hline
Autocorrelation Function \tabularnewline
Time lag k & ACF(k) & T-STAT & P-value \tabularnewline
1 & 0.387767 & 3.0036 & 0.001944 \tabularnewline
2 & 0.117697 & 0.9117 & 0.182793 \tabularnewline
3 & 0.402151 & 3.115 & 0.00141 \tabularnewline
4 & 0.193957 & 1.5024 & 0.069121 \tabularnewline
5 & 0.170787 & 1.3229 & 0.095443 \tabularnewline
6 & 0.35124 & 2.7207 & 0.004256 \tabularnewline
7 & 0.024765 & 0.1918 & 0.424262 \tabularnewline
8 & 0.006118 & 0.0474 & 0.481181 \tabularnewline
9 & 0.171175 & 1.3259 & 0.094947 \tabularnewline
10 & -0.126376 & -0.9789 & 0.165778 \tabularnewline
11 & 0.003641 & 0.0282 & 0.488796 \tabularnewline
12 & 0.442677 & 3.429 & 0.000551 \tabularnewline
13 & 0.060682 & 0.47 & 0.320015 \tabularnewline
14 & -0.167091 & -1.2943 & 0.100264 \tabularnewline
15 & 0.088876 & 0.6884 & 0.246916 \tabularnewline
16 & -0.028071 & -0.2174 & 0.414303 \tabularnewline
17 & -0.06139 & -0.4755 & 0.318069 \tabularnewline
18 & 0.084296 & 0.653 & 0.258139 \tabularnewline
19 & -0.113004 & -0.8753 & 0.192444 \tabularnewline
20 & -0.162647 & -1.2599 & 0.1063 \tabularnewline
21 & -0.01042 & -0.0807 & 0.46797 \tabularnewline
22 & -0.252338 & -1.9546 & 0.027647 \tabularnewline
23 & -0.179518 & -1.3905 & 0.084751 \tabularnewline
24 & 0.170058 & 1.3173 & 0.096379 \tabularnewline
25 & -0.039296 & -0.3044 & 0.380943 \tabularnewline
26 & -0.286355 & -2.2181 & 0.015172 \tabularnewline
27 & -0.085202 & -0.66 & 0.255899 \tabularnewline
28 & -0.125289 & -0.9705 & 0.167851 \tabularnewline
29 & -0.173228 & -1.3418 & 0.092356 \tabularnewline
30 & -0.050436 & -0.3907 & 0.348711 \tabularnewline
31 & -0.146779 & -1.1369 & 0.130041 \tabularnewline
32 & -0.222261 & -1.7216 & 0.045145 \tabularnewline
33 & -0.080369 & -0.6225 & 0.267975 \tabularnewline
34 & -0.205774 & -1.5939 & 0.058105 \tabularnewline
35 & -0.236709 & -1.8335 & 0.035842 \tabularnewline
36 & 0.035697 & 0.2765 & 0.391554 \tabularnewline
37 & -0.045397 & -0.3516 & 0.363167 \tabularnewline
38 & -0.211277 & -1.6365 & 0.053481 \tabularnewline
39 & -0.061449 & -0.476 & 0.317909 \tabularnewline
40 & -0.074515 & -0.5772 & 0.282984 \tabularnewline
41 & -0.094401 & -0.7312 & 0.233744 \tabularnewline
42 & 0.011162 & 0.0865 & 0.465694 \tabularnewline
43 & -0.077691 & -0.6018 & 0.27479 \tabularnewline
44 & -0.114966 & -0.8905 & 0.18837 \tabularnewline
45 & -0.032534 & -0.252 & 0.400948 \tabularnewline
46 & -0.099402 & -0.77 & 0.222171 \tabularnewline
47 & -0.108444 & -0.84 & 0.20212 \tabularnewline
48 & 0.054141 & 0.4194 & 0.33822 \tabularnewline
49 & 0.0013 & 0.0101 & 0.495999 \tabularnewline
50 & -0.064251 & -0.4977 & 0.310261 \tabularnewline
51 & 0.016433 & 0.1273 & 0.44957 \tabularnewline
52 & 0.049417 & 0.3828 & 0.351616 \tabularnewline
53 & 0.061983 & 0.4801 & 0.316446 \tabularnewline
54 & 0.0931 & 0.7212 & 0.236808 \tabularnewline
55 & 0.046554 & 0.3606 & 0.359829 \tabularnewline
56 & 0.046005 & 0.3564 & 0.361413 \tabularnewline
57 & 0.085455 & 0.6619 & 0.255274 \tabularnewline
58 & 0.0581 & 0.45 & 0.327151 \tabularnewline
59 & 0.001643 & 0.0127 & 0.494945 \tabularnewline
60 & NA & NA & NA \tabularnewline
\hline
\end{tabular}
%Source: https://freestatistics.org/blog/index.php?pk=62519&T=1

[TABLE]
[ROW][C]Autocorrelation Function[/C][/ROW]
[ROW][C]Time lag k[/C][C]ACF(k)[/C][C]T-STAT[/C][C]P-value[/C][/ROW]
[ROW][C]1[/C][C]0.387767[/C][C]3.0036[/C][C]0.001944[/C][/ROW]
[ROW][C]2[/C][C]0.117697[/C][C]0.9117[/C][C]0.182793[/C][/ROW]
[ROW][C]3[/C][C]0.402151[/C][C]3.115[/C][C]0.00141[/C][/ROW]
[ROW][C]4[/C][C]0.193957[/C][C]1.5024[/C][C]0.069121[/C][/ROW]
[ROW][C]5[/C][C]0.170787[/C][C]1.3229[/C][C]0.095443[/C][/ROW]
[ROW][C]6[/C][C]0.35124[/C][C]2.7207[/C][C]0.004256[/C][/ROW]
[ROW][C]7[/C][C]0.024765[/C][C]0.1918[/C][C]0.424262[/C][/ROW]
[ROW][C]8[/C][C]0.006118[/C][C]0.0474[/C][C]0.481181[/C][/ROW]
[ROW][C]9[/C][C]0.171175[/C][C]1.3259[/C][C]0.094947[/C][/ROW]
[ROW][C]10[/C][C]-0.126376[/C][C]-0.9789[/C][C]0.165778[/C][/ROW]
[ROW][C]11[/C][C]0.003641[/C][C]0.0282[/C][C]0.488796[/C][/ROW]
[ROW][C]12[/C][C]0.442677[/C][C]3.429[/C][C]0.000551[/C][/ROW]
[ROW][C]13[/C][C]0.060682[/C][C]0.47[/C][C]0.320015[/C][/ROW]
[ROW][C]14[/C][C]-0.167091[/C][C]-1.2943[/C][C]0.100264[/C][/ROW]
[ROW][C]15[/C][C]0.088876[/C][C]0.6884[/C][C]0.246916[/C][/ROW]
[ROW][C]16[/C][C]-0.028071[/C][C]-0.2174[/C][C]0.414303[/C][/ROW]
[ROW][C]17[/C][C]-0.06139[/C][C]-0.4755[/C][C]0.318069[/C][/ROW]
[ROW][C]18[/C][C]0.084296[/C][C]0.653[/C][C]0.258139[/C][/ROW]
[ROW][C]19[/C][C]-0.113004[/C][C]-0.8753[/C][C]0.192444[/C][/ROW]
[ROW][C]20[/C][C]-0.162647[/C][C]-1.2599[/C][C]0.1063[/C][/ROW]
[ROW][C]21[/C][C]-0.01042[/C][C]-0.0807[/C][C]0.46797[/C][/ROW]
[ROW][C]22[/C][C]-0.252338[/C][C]-1.9546[/C][C]0.027647[/C][/ROW]
[ROW][C]23[/C][C]-0.179518[/C][C]-1.3905[/C][C]0.084751[/C][/ROW]
[ROW][C]24[/C][C]0.170058[/C][C]1.3173[/C][C]0.096379[/C][/ROW]
[ROW][C]25[/C][C]-0.039296[/C][C]-0.3044[/C][C]0.380943[/C][/ROW]
[ROW][C]26[/C][C]-0.286355[/C][C]-2.2181[/C][C]0.015172[/C][/ROW]
[ROW][C]27[/C][C]-0.085202[/C][C]-0.66[/C][C]0.255899[/C][/ROW]
[ROW][C]28[/C][C]-0.125289[/C][C]-0.9705[/C][C]0.167851[/C][/ROW]
[ROW][C]29[/C][C]-0.173228[/C][C]-1.3418[/C][C]0.092356[/C][/ROW]
[ROW][C]30[/C][C]-0.050436[/C][C]-0.3907[/C][C]0.348711[/C][/ROW]
[ROW][C]31[/C][C]-0.146779[/C][C]-1.1369[/C][C]0.130041[/C][/ROW]
[ROW][C]32[/C][C]-0.222261[/C][C]-1.7216[/C][C]0.045145[/C][/ROW]
[ROW][C]33[/C][C]-0.080369[/C][C]-0.6225[/C][C]0.267975[/C][/ROW]
[ROW][C]34[/C][C]-0.205774[/C][C]-1.5939[/C][C]0.058105[/C][/ROW]
[ROW][C]35[/C][C]-0.236709[/C][C]-1.8335[/C][C]0.035842[/C][/ROW]
[ROW][C]36[/C][C]0.035697[/C][C]0.2765[/C][C]0.391554[/C][/ROW]
[ROW][C]37[/C][C]-0.045397[/C][C]-0.3516[/C][C]0.363167[/C][/ROW]
[ROW][C]38[/C][C]-0.211277[/C][C]-1.6365[/C][C]0.053481[/C][/ROW]
[ROW][C]39[/C][C]-0.061449[/C][C]-0.476[/C][C]0.317909[/C][/ROW]
[ROW][C]40[/C][C]-0.074515[/C][C]-0.5772[/C][C]0.282984[/C][/ROW]
[ROW][C]41[/C][C]-0.094401[/C][C]-0.7312[/C][C]0.233744[/C][/ROW]
[ROW][C]42[/C][C]0.011162[/C][C]0.0865[/C][C]0.465694[/C][/ROW]
[ROW][C]43[/C][C]-0.077691[/C][C]-0.6018[/C][C]0.27479[/C][/ROW]
[ROW][C]44[/C][C]-0.114966[/C][C]-0.8905[/C][C]0.18837[/C][/ROW]
[ROW][C]45[/C][C]-0.032534[/C][C]-0.252[/C][C]0.400948[/C][/ROW]
[ROW][C]46[/C][C]-0.099402[/C][C]-0.77[/C][C]0.222171[/C][/ROW]
[ROW][C]47[/C][C]-0.108444[/C][C]-0.84[/C][C]0.20212[/C][/ROW]
[ROW][C]48[/C][C]0.054141[/C][C]0.4194[/C][C]0.33822[/C][/ROW]
[ROW][C]49[/C][C]0.0013[/C][C]0.0101[/C][C]0.495999[/C][/ROW]
[ROW][C]50[/C][C]-0.064251[/C][C]-0.4977[/C][C]0.310261[/C][/ROW]
[ROW][C]51[/C][C]0.016433[/C][C]0.1273[/C][C]0.44957[/C][/ROW]
[ROW][C]52[/C][C]0.049417[/C][C]0.3828[/C][C]0.351616[/C][/ROW]
[ROW][C]53[/C][C]0.061983[/C][C]0.4801[/C][C]0.316446[/C][/ROW]
[ROW][C]54[/C][C]0.0931[/C][C]0.7212[/C][C]0.236808[/C][/ROW]
[ROW][C]55[/C][C]0.046554[/C][C]0.3606[/C][C]0.359829[/C][/ROW]
[ROW][C]56[/C][C]0.046005[/C][C]0.3564[/C][C]0.361413[/C][/ROW]
[ROW][C]57[/C][C]0.085455[/C][C]0.6619[/C][C]0.255274[/C][/ROW]
[ROW][C]58[/C][C]0.0581[/C][C]0.45[/C][C]0.327151[/C][/ROW]
[ROW][C]59[/C][C]0.001643[/C][C]0.0127[/C][C]0.494945[/C][/ROW]
[ROW][C]60[/C][C]NA[/C][C]NA[/C][C]NA[/C][/ROW]
[/TABLE]
Source: https://freestatistics.org/blog/index.php?pk=62519&T=1

Globally Unique Identifier (entire table): ba.freestatistics.org/blog/index.php?pk=62519&T=1

As an alternative you can also use a QR Code:  

The GUIDs for individual cells are displayed in the table below:

Autocorrelation Function
Time lag kACF(k)T-STATP-value
10.3877673.00360.001944
20.1176970.91170.182793
30.4021513.1150.00141
40.1939571.50240.069121
50.1707871.32290.095443
60.351242.72070.004256
70.0247650.19180.424262
80.0061180.04740.481181
90.1711751.32590.094947
10-0.126376-0.97890.165778
110.0036410.02820.488796
120.4426773.4290.000551
130.0606820.470.320015
14-0.167091-1.29430.100264
150.0888760.68840.246916
16-0.028071-0.21740.414303
17-0.06139-0.47550.318069
180.0842960.6530.258139
19-0.113004-0.87530.192444
20-0.162647-1.25990.1063
21-0.01042-0.08070.46797
22-0.252338-1.95460.027647
23-0.179518-1.39050.084751
240.1700581.31730.096379
25-0.039296-0.30440.380943
26-0.286355-2.21810.015172
27-0.085202-0.660.255899
28-0.125289-0.97050.167851
29-0.173228-1.34180.092356
30-0.050436-0.39070.348711
31-0.146779-1.13690.130041
32-0.222261-1.72160.045145
33-0.080369-0.62250.267975
34-0.205774-1.59390.058105
35-0.236709-1.83350.035842
360.0356970.27650.391554
37-0.045397-0.35160.363167
38-0.211277-1.63650.053481
39-0.061449-0.4760.317909
40-0.074515-0.57720.282984
41-0.094401-0.73120.233744
420.0111620.08650.465694
43-0.077691-0.60180.27479
44-0.114966-0.89050.18837
45-0.032534-0.2520.400948
46-0.099402-0.770.222171
47-0.108444-0.840.20212
480.0541410.41940.33822
490.00130.01010.495999
50-0.064251-0.49770.310261
510.0164330.12730.44957
520.0494170.38280.351616
530.0619830.48010.316446
540.09310.72120.236808
550.0465540.36060.359829
560.0460050.35640.361413
570.0854550.66190.255274
580.05810.450.327151
590.0016430.01270.494945
60NANANA


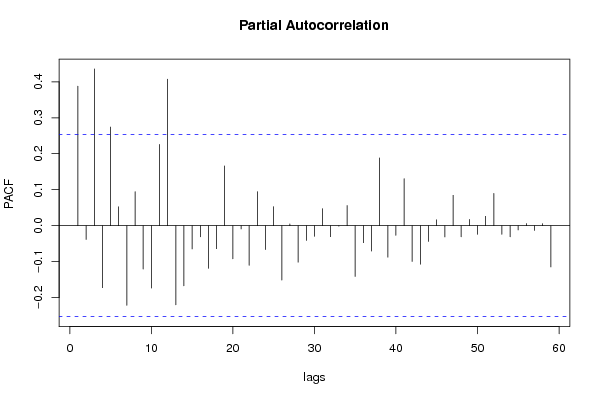
Partial Autocorrelation Function
Time lag kPACF(k)T-STATP-value
10.3877673.00360.001944
2-0.038447-0.29780.383438
30.4357313.37520.000649
4-0.172415-1.33550.093375
50.2740842.1230.018942
60.0524790.40650.342911
7-0.221568-1.71630.045637
80.0945440.73230.233407
9-0.120663-0.93470.176857
10-0.173509-1.3440.092006
110.225761.74870.042726
120.4072493.15450.001256
13-0.220117-1.7050.046682
14-0.167244-1.29550.10006
15-0.064698-0.50110.30905
16-0.031012-0.24020.405491
17-0.118646-0.9190.18088
18-0.063987-0.49560.310979
190.166141.28690.101534
20-0.092221-0.71430.238894
21-0.009037-0.070.472213
22-0.110387-0.85510.197961
230.0945770.73260.233331
24-0.066436-0.51460.304359
250.0527770.40880.342068
26-0.151325-1.17220.122883
270.0046120.03570.485811
28-0.101444-0.78580.217545
29-0.041181-0.3190.375422
30-0.029578-0.22910.409782
310.0472730.36620.357761
32-0.030709-0.23790.406396
33-0.00147-0.01140.495476
340.0559930.43370.333025
35-0.141333-1.09480.138998
36-0.047327-0.36660.357605
37-0.070495-0.54610.293527
380.1883931.45930.074851
39-0.087594-0.67850.250032
40-0.0267-0.20680.418425
410.1305271.01110.158024
42-0.099614-0.77160.221689
43-0.107249-0.83070.204705
44-0.043779-0.33910.367854
450.016310.12630.449942
46-0.031295-0.24240.404644
470.0844110.65380.257855
48-0.031122-0.24110.40516
490.017450.13520.446466
50-0.024171-0.18720.426057
510.0258320.20010.421042
520.08950.69330.24541
53-0.024242-0.18780.425841
54-0.030978-0.240.405591
55-0.012021-0.09310.463062
560.0057560.04460.482293
57-0.013411-0.10390.458805
580.0054060.04190.483369
59-0.114786-0.88910.188743
60NANANA

\begin{tabular}{lllllllll}
\hline
Partial Autocorrelation Function \tabularnewline
Time lag k & PACF(k) & T-STAT & P-value \tabularnewline
1 & 0.387767 & 3.0036 & 0.001944 \tabularnewline
2 & -0.038447 & -0.2978 & 0.383438 \tabularnewline
3 & 0.435731 & 3.3752 & 0.000649 \tabularnewline
4 & -0.172415 & -1.3355 & 0.093375 \tabularnewline
5 & 0.274084 & 2.123 & 0.018942 \tabularnewline
6 & 0.052479 & 0.4065 & 0.342911 \tabularnewline
7 & -0.221568 & -1.7163 & 0.045637 \tabularnewline
8 & 0.094544 & 0.7323 & 0.233407 \tabularnewline
9 & -0.120663 & -0.9347 & 0.176857 \tabularnewline
10 & -0.173509 & -1.344 & 0.092006 \tabularnewline
11 & 0.22576 & 1.7487 & 0.042726 \tabularnewline
12 & 0.407249 & 3.1545 & 0.001256 \tabularnewline
13 & -0.220117 & -1.705 & 0.046682 \tabularnewline
14 & -0.167244 & -1.2955 & 0.10006 \tabularnewline
15 & -0.064698 & -0.5011 & 0.30905 \tabularnewline
16 & -0.031012 & -0.2402 & 0.405491 \tabularnewline
17 & -0.118646 & -0.919 & 0.18088 \tabularnewline
18 & -0.063987 & -0.4956 & 0.310979 \tabularnewline
19 & 0.16614 & 1.2869 & 0.101534 \tabularnewline
20 & -0.092221 & -0.7143 & 0.238894 \tabularnewline
21 & -0.009037 & -0.07 & 0.472213 \tabularnewline
22 & -0.110387 & -0.8551 & 0.197961 \tabularnewline
23 & 0.094577 & 0.7326 & 0.233331 \tabularnewline
24 & -0.066436 & -0.5146 & 0.304359 \tabularnewline
25 & 0.052777 & 0.4088 & 0.342068 \tabularnewline
26 & -0.151325 & -1.1722 & 0.122883 \tabularnewline
27 & 0.004612 & 0.0357 & 0.485811 \tabularnewline
28 & -0.101444 & -0.7858 & 0.217545 \tabularnewline
29 & -0.041181 & -0.319 & 0.375422 \tabularnewline
30 & -0.029578 & -0.2291 & 0.409782 \tabularnewline
31 & 0.047273 & 0.3662 & 0.357761 \tabularnewline
32 & -0.030709 & -0.2379 & 0.406396 \tabularnewline
33 & -0.00147 & -0.0114 & 0.495476 \tabularnewline
34 & 0.055993 & 0.4337 & 0.333025 \tabularnewline
35 & -0.141333 & -1.0948 & 0.138998 \tabularnewline
36 & -0.047327 & -0.3666 & 0.357605 \tabularnewline
37 & -0.070495 & -0.5461 & 0.293527 \tabularnewline
38 & 0.188393 & 1.4593 & 0.074851 \tabularnewline
39 & -0.087594 & -0.6785 & 0.250032 \tabularnewline
40 & -0.0267 & -0.2068 & 0.418425 \tabularnewline
41 & 0.130527 & 1.0111 & 0.158024 \tabularnewline
42 & -0.099614 & -0.7716 & 0.221689 \tabularnewline
43 & -0.107249 & -0.8307 & 0.204705 \tabularnewline
44 & -0.043779 & -0.3391 & 0.367854 \tabularnewline
45 & 0.01631 & 0.1263 & 0.449942 \tabularnewline
46 & -0.031295 & -0.2424 & 0.404644 \tabularnewline
47 & 0.084411 & 0.6538 & 0.257855 \tabularnewline
48 & -0.031122 & -0.2411 & 0.40516 \tabularnewline
49 & 0.01745 & 0.1352 & 0.446466 \tabularnewline
50 & -0.024171 & -0.1872 & 0.426057 \tabularnewline
51 & 0.025832 & 0.2001 & 0.421042 \tabularnewline
52 & 0.0895 & 0.6933 & 0.24541 \tabularnewline
53 & -0.024242 & -0.1878 & 0.425841 \tabularnewline
54 & -0.030978 & -0.24 & 0.405591 \tabularnewline
55 & -0.012021 & -0.0931 & 0.463062 \tabularnewline
56 & 0.005756 & 0.0446 & 0.482293 \tabularnewline
57 & -0.013411 & -0.1039 & 0.458805 \tabularnewline
58 & 0.005406 & 0.0419 & 0.483369 \tabularnewline
59 & -0.114786 & -0.8891 & 0.188743 \tabularnewline
60 & NA & NA & NA \tabularnewline
\hline
\end{tabular}
%Source: https://freestatistics.org/blog/index.php?pk=62519&T=2

[TABLE]
[ROW][C]Partial Autocorrelation Function[/C][/ROW]
[ROW][C]Time lag k[/C][C]PACF(k)[/C][C]T-STAT[/C][C]P-value[/C][/ROW]
[ROW][C]1[/C][C]0.387767[/C][C]3.0036[/C][C]0.001944[/C][/ROW]
[ROW][C]2[/C][C]-0.038447[/C][C]-0.2978[/C][C]0.383438[/C][/ROW]
[ROW][C]3[/C][C]0.435731[/C][C]3.3752[/C][C]0.000649[/C][/ROW]
[ROW][C]4[/C][C]-0.172415[/C][C]-1.3355[/C][C]0.093375[/C][/ROW]
[ROW][C]5[/C][C]0.274084[/C][C]2.123[/C][C]0.018942[/C][/ROW]
[ROW][C]6[/C][C]0.052479[/C][C]0.4065[/C][C]0.342911[/C][/ROW]
[ROW][C]7[/C][C]-0.221568[/C][C]-1.7163[/C][C]0.045637[/C][/ROW]
[ROW][C]8[/C][C]0.094544[/C][C]0.7323[/C][C]0.233407[/C][/ROW]
[ROW][C]9[/C][C]-0.120663[/C][C]-0.9347[/C][C]0.176857[/C][/ROW]
[ROW][C]10[/C][C]-0.173509[/C][C]-1.344[/C][C]0.092006[/C][/ROW]
[ROW][C]11[/C][C]0.22576[/C][C]1.7487[/C][C]0.042726[/C][/ROW]
[ROW][C]12[/C][C]0.407249[/C][C]3.1545[/C][C]0.001256[/C][/ROW]
[ROW][C]13[/C][C]-0.220117[/C][C]-1.705[/C][C]0.046682[/C][/ROW]
[ROW][C]14[/C][C]-0.167244[/C][C]-1.2955[/C][C]0.10006[/C][/ROW]
[ROW][C]15[/C][C]-0.064698[/C][C]-0.5011[/C][C]0.30905[/C][/ROW]
[ROW][C]16[/C][C]-0.031012[/C][C]-0.2402[/C][C]0.405491[/C][/ROW]
[ROW][C]17[/C][C]-0.118646[/C][C]-0.919[/C][C]0.18088[/C][/ROW]
[ROW][C]18[/C][C]-0.063987[/C][C]-0.4956[/C][C]0.310979[/C][/ROW]
[ROW][C]19[/C][C]0.16614[/C][C]1.2869[/C][C]0.101534[/C][/ROW]
[ROW][C]20[/C][C]-0.092221[/C][C]-0.7143[/C][C]0.238894[/C][/ROW]
[ROW][C]21[/C][C]-0.009037[/C][C]-0.07[/C][C]0.472213[/C][/ROW]
[ROW][C]22[/C][C]-0.110387[/C][C]-0.8551[/C][C]0.197961[/C][/ROW]
[ROW][C]23[/C][C]0.094577[/C][C]0.7326[/C][C]0.233331[/C][/ROW]
[ROW][C]24[/C][C]-0.066436[/C][C]-0.5146[/C][C]0.304359[/C][/ROW]
[ROW][C]25[/C][C]0.052777[/C][C]0.4088[/C][C]0.342068[/C][/ROW]
[ROW][C]26[/C][C]-0.151325[/C][C]-1.1722[/C][C]0.122883[/C][/ROW]
[ROW][C]27[/C][C]0.004612[/C][C]0.0357[/C][C]0.485811[/C][/ROW]
[ROW][C]28[/C][C]-0.101444[/C][C]-0.7858[/C][C]0.217545[/C][/ROW]
[ROW][C]29[/C][C]-0.041181[/C][C]-0.319[/C][C]0.375422[/C][/ROW]
[ROW][C]30[/C][C]-0.029578[/C][C]-0.2291[/C][C]0.409782[/C][/ROW]
[ROW][C]31[/C][C]0.047273[/C][C]0.3662[/C][C]0.357761[/C][/ROW]
[ROW][C]32[/C][C]-0.030709[/C][C]-0.2379[/C][C]0.406396[/C][/ROW]
[ROW][C]33[/C][C]-0.00147[/C][C]-0.0114[/C][C]0.495476[/C][/ROW]
[ROW][C]34[/C][C]0.055993[/C][C]0.4337[/C][C]0.333025[/C][/ROW]
[ROW][C]35[/C][C]-0.141333[/C][C]-1.0948[/C][C]0.138998[/C][/ROW]
[ROW][C]36[/C][C]-0.047327[/C][C]-0.3666[/C][C]0.357605[/C][/ROW]
[ROW][C]37[/C][C]-0.070495[/C][C]-0.5461[/C][C]0.293527[/C][/ROW]
[ROW][C]38[/C][C]0.188393[/C][C]1.4593[/C][C]0.074851[/C][/ROW]
[ROW][C]39[/C][C]-0.087594[/C][C]-0.6785[/C][C]0.250032[/C][/ROW]
[ROW][C]40[/C][C]-0.0267[/C][C]-0.2068[/C][C]0.418425[/C][/ROW]
[ROW][C]41[/C][C]0.130527[/C][C]1.0111[/C][C]0.158024[/C][/ROW]
[ROW][C]42[/C][C]-0.099614[/C][C]-0.7716[/C][C]0.221689[/C][/ROW]
[ROW][C]43[/C][C]-0.107249[/C][C]-0.8307[/C][C]0.204705[/C][/ROW]
[ROW][C]44[/C][C]-0.043779[/C][C]-0.3391[/C][C]0.367854[/C][/ROW]
[ROW][C]45[/C][C]0.01631[/C][C]0.1263[/C][C]0.449942[/C][/ROW]
[ROW][C]46[/C][C]-0.031295[/C][C]-0.2424[/C][C]0.404644[/C][/ROW]
[ROW][C]47[/C][C]0.084411[/C][C]0.6538[/C][C]0.257855[/C][/ROW]
[ROW][C]48[/C][C]-0.031122[/C][C]-0.2411[/C][C]0.40516[/C][/ROW]
[ROW][C]49[/C][C]0.01745[/C][C]0.1352[/C][C]0.446466[/C][/ROW]
[ROW][C]50[/C][C]-0.024171[/C][C]-0.1872[/C][C]0.426057[/C][/ROW]
[ROW][C]51[/C][C]0.025832[/C][C]0.2001[/C][C]0.421042[/C][/ROW]
[ROW][C]52[/C][C]0.0895[/C][C]0.6933[/C][C]0.24541[/C][/ROW]
[ROW][C]53[/C][C]-0.024242[/C][C]-0.1878[/C][C]0.425841[/C][/ROW]
[ROW][C]54[/C][C]-0.030978[/C][C]-0.24[/C][C]0.405591[/C][/ROW]
[ROW][C]55[/C][C]-0.012021[/C][C]-0.0931[/C][C]0.463062[/C][/ROW]
[ROW][C]56[/C][C]0.005756[/C][C]0.0446[/C][C]0.482293[/C][/ROW]
[ROW][C]57[/C][C]-0.013411[/C][C]-0.1039[/C][C]0.458805[/C][/ROW]
[ROW][C]58[/C][C]0.005406[/C][C]0.0419[/C][C]0.483369[/C][/ROW]
[ROW][C]59[/C][C]-0.114786[/C][C]-0.8891[/C][C]0.188743[/C][/ROW]
[ROW][C]60[/C][C]NA[/C][C]NA[/C][C]NA[/C][/ROW]
[/TABLE]
Source: https://freestatistics.org/blog/index.php?pk=62519&T=2

Globally Unique Identifier (entire table): ba.freestatistics.org/blog/index.php?pk=62519&T=2

As an alternative you can also use a QR Code:  

The GUIDs for individual cells are displayed in the table below:

Partial Autocorrelation Function
Time lag kPACF(k)T-STATP-value
10.3877673.00360.001944
2-0.038447-0.29780.383438
30.4357313.37520.000649
4-0.172415-1.33550.093375
50.2740842.1230.018942
60.0524790.40650.342911
7-0.221568-1.71630.045637
80.0945440.73230.233407
9-0.120663-0.93470.176857
10-0.173509-1.3440.092006
110.225761.74870.042726
120.4072493.15450.001256
13-0.220117-1.7050.046682
14-0.167244-1.29550.10006
15-0.064698-0.50110.30905
16-0.031012-0.24020.405491
17-0.118646-0.9190.18088
18-0.063987-0.49560.310979
190.166141.28690.101534
20-0.092221-0.71430.238894
21-0.009037-0.070.472213
22-0.110387-0.85510.197961
230.0945770.73260.233331
24-0.066436-0.51460.304359
250.0527770.40880.342068
26-0.151325-1.17220.122883
270.0046120.03570.485811
28-0.101444-0.78580.217545
29-0.041181-0.3190.375422
30-0.029578-0.22910.409782
310.0472730.36620.357761
32-0.030709-0.23790.406396
33-0.00147-0.01140.495476
340.0559930.43370.333025
35-0.141333-1.09480.138998
36-0.047327-0.36660.357605
37-0.070495-0.54610.293527
380.1883931.45930.074851
39-0.087594-0.67850.250032
40-0.0267-0.20680.418425
410.1305271.01110.158024
42-0.099614-0.77160.221689
43-0.107249-0.83070.204705
44-0.043779-0.33910.367854
450.016310.12630.449942
46-0.031295-0.24240.404644
470.0844110.65380.257855
48-0.031122-0.24110.40516
490.017450.13520.446466
50-0.024171-0.18720.426057
510.0258320.20010.421042
520.08950.69330.24541
53-0.024242-0.18780.425841
54-0.030978-0.240.405591
55-0.012021-0.09310.463062
560.0057560.04460.482293
57-0.013411-0.10390.458805
580.0054060.04190.483369
59-0.114786-0.88910.188743
60NANANA


Parameters (Session):
par1 = 60 ; par2 = 1 ; par3 = 0 ; par4 = 0 ; par5 = 12 ; par6 = White Noise ; par7 = 0.95 ;
Parameters (R input):
par1 = 60 ; par2 = 1 ; par3 = 0 ; par4 = 0 ; par5 = 12 ; par6 = White Noise ; par7 = 0.95 ;
R code (references can be found in the software module):
if (par1 == 'Default') {
par1 = 10*log10(length(x))
} else {
par1 <- as.numeric(par1)
}
par2 <- as.numeric(par2)
par3 <- as.numeric(par3)
par4 <- as.numeric(par4)
par5 <- as.numeric(par5)
if (par6 == 'White Noise') par6 <- 'white' else par6 <- 'ma'
par7 <- as.numeric(par7)
if (par2 == 0) {
x <- log(x)
} else {
x <- (x ^ par2 - 1) / par2
}
if (par3 > 0) x <- diff(x,lag=1,difference=par3)
if (par4 > 0) x <- diff(x,lag=par5,difference=par4)
bitmap(file='pic1.png')
racf <- acf(x, par1, main='Autocorrelation', xlab='time lag', ylab='ACF', ci.type=par6, ci=par7, sub=paste('(lambda=',par2,', d=',par3,', D=',par4,', CI=', par7, ', CI type=',par6,')',sep=''))
dev.off()
bitmap(file='pic2.png')
rpacf <- pacf(x,par1,main='Partial Autocorrelation',xlab='lags',ylab='PACF')
dev.off()
(myacf <- c(racf$acf))
(mypacf <- c(rpacf$acf))
lengthx <- length(x)
sqrtn <- sqrt(lengthx)
load(file='createtable')
a<-table.start()
a<-table.row.start(a)
a<-table.element(a,'Autocorrelation Function',4,TRUE)
a<-table.row.end(a)
a<-table.row.start(a)
a<-table.element(a,'Time lag k',header=TRUE)
a<-table.element(a,hyperlink('basics.htm','ACF(k)','click here for more information about the Autocorrelation Function'),header=TRUE)
a<-table.element(a,'T-STAT',header=TRUE)
a<-table.element(a,'P-value',header=TRUE)
a<-table.row.end(a)
for (i in 2:(par1+1)) {
a<-table.row.start(a)
a<-table.element(a,i-1,header=TRUE)
a<-table.element(a,round(myacf[i],6))
mytstat <- myacf[i]*sqrtn
a<-table.element(a,round(mytstat,4))
a<-table.element(a,round(1-pt(abs(mytstat),lengthx),6))
a<-table.row.end(a)
}
a<-table.end(a)
table.save(a,file='mytable.tab')
a<-table.start()
a<-table.row.start(a)
a<-table.element(a,'Partial Autocorrelation Function',4,TRUE)
a<-table.row.end(a)
a<-table.row.start(a)
a<-table.element(a,'Time lag k',header=TRUE)
a<-table.element(a,hyperlink('basics.htm','PACF(k)','click here for more information about the Partial Autocorrelation Function'),header=TRUE)
a<-table.element(a,'T-STAT',header=TRUE)
a<-table.element(a,'P-value',header=TRUE)
a<-table.row.end(a)
for (i in 1:par1) {
a<-table.row.start(a)
a<-table.element(a,i,header=TRUE)
a<-table.element(a,round(mypacf[i],6))
mytstat <- mypacf[i]*sqrtn
a<-table.element(a,round(mytstat,4))
a<-table.element(a,round(1-pt(abs(mytstat),lengthx),6))
a<-table.row.end(a)
}
a<-table.end(a)
table.save(a,file='mytable1.tab')