Free Statistics

of Irreproducible Research!

Author's title

Author*The author of this computation has been verified*
R Software Modulerwasp_arimabackwardselection.wasp
Title produced by softwareARIMA Backward Selection
Date of computationWed, 02 Dec 2009 13:17:40 -0700
Cite this page as followsStatistical Computations at FreeStatistics.org, Office for Research Development and Education, URL https://freestatistics.org/blog/index.php?v=date/2009/Dec/02/t1259785119jpyxky1qnhq75cm.htm/, Retrieved Sun, 28 Apr 2024 03:08:24 +0000
Statistical Computations at FreeStatistics.org, Office for Research Development and Education, URL https://freestatistics.org/blog/index.php?pk=62572, Retrieved Sun, 28 Apr 2024 03:08:24 +0000
QR Codes:

Original text written by user:
IsPrivate?No (this computation is public)
User-defined keywords
Estimated Impact174
Family? (F = Feedback message, R = changed R code, M = changed R Module, P = changed Parameters, D = changed Data)
-     [Univariate Data Series] [data set] [2008-12-01 19:54:57] [b98453cac15ba1066b407e146608df68]
- RMP   [ARIMA Backward Selection] [] [2009-11-27 14:53:14] [b98453cac15ba1066b407e146608df68]
-   PD    [ARIMA Backward Selection] [WS09 - Problem if...] [2009-12-02 16:23:55] [df6326eec97a6ca984a853b142930499]
-             [ARIMA Backward Selection] [WS09 - Backward A...] [2009-12-02 20:17:40] [0cc924834281808eda7297686c82928f] [Current]
- RM            [ARIMA Forecasting] [WS10 - Voorspelling] [2009-12-02 21:21:36] [df6326eec97a6ca984a853b142930499]
-    D            [ARIMA Forecasting] [CaseStatistiek - ...] [2009-12-30 23:46:48] [df6326eec97a6ca984a853b142930499]
- R P           [ARIMA Backward Selection] [WS10 -Backward AR...] [2009-12-09 16:27:46] [df6326eec97a6ca984a853b142930499]
-    D            [ARIMA Backward Selection] [ws10 - ARIMA] [2009-12-09 17:44:33] [df6326eec97a6ca984a853b142930499]
-    D          [ARIMA Backward Selection] [CaseStatistiek - ...] [2009-12-30 23:31:49] [df6326eec97a6ca984a853b142930499]
Feedback Forum

Post a new message
Dataseries X:
423.4
404.1
500
472.6
496.1
562
434.8
538.2
577.6
518.1
625.2
561.2
523.3
536.1
607.3
637.3
606.9
652.9
617.2
670.4
729.9
677.2
710
844.3
748.2
653.9
742.6
854.2
808.4
1819
1936.5
1966.1
2083.1
1620.1
1527.6
1795
1685.1
1851.8
2164.4
1981.8
1726.5
2144.6
1758.2
1672.9
1837.3
1596.1
1446
1898.4
1964.1
1755.9
2255.3
1881.2
2117.9
1656.5
1544.1
2098.9
2133.3
1963.5
1801.2
2365.4
1936.5
1667.6
1983.5
2058.6
2448.3
1858.1
1625.4
2130.6
2515.7
2230.2
2086.9
2235
2100.2
2288.6
2490
2573.7
2543.8
2004.7
2390
2338.4
2724.5
2292.5
2386
2477.9
2337
2605.1
2560.8
2839.3
2407.2
2085.2
2735.6
2798.7
3053.2
2405
2471.9
2727.3
2790.7
2385.4
3206.6
2705.6
3518.4
1954.9
2584.3
2535.8
2685.9
2866
2236.6
2934.9
2668.6
2371.2
3165.9
2887.2
3112.2
2671.2
2432.6
2812.3
3095.7
2862.9
2607.3
2862.5


Summary of computational transaction
Raw Inputview raw input (R code)
Raw Outputview raw output of R engine
Computing time10 seconds
R Server'Gwilym Jenkins' @ 72.249.127.135

\begin{tabular}{lllllllll}
\hline
Summary of computational transaction \tabularnewline
Raw Input & view raw input (R code)  \tabularnewline
Raw Output & view raw output of R engine  \tabularnewline
Computing time & 10 seconds \tabularnewline
R Server & 'Gwilym Jenkins' @ 72.249.127.135 \tabularnewline
\hline
\end{tabular}
%Source: https://freestatistics.org/blog/index.php?pk=62572&T=0

[TABLE]
[ROW][C]Summary of computational transaction[/C][/ROW]
[ROW][C]Raw Input[/C][C]view raw input (R code) [/C][/ROW]
[ROW][C]Raw Output[/C][C]view raw output of R engine [/C][/ROW]
[ROW][C]Computing time[/C][C]10 seconds[/C][/ROW]
[ROW][C]R Server[/C][C]'Gwilym Jenkins' @ 72.249.127.135[/C][/ROW]
[/TABLE]
Source: https://freestatistics.org/blog/index.php?pk=62572&T=0

Globally Unique Identifier (entire table): ba.freestatistics.org/blog/index.php?pk=62572&T=0

As an alternative you can also use a QR Code:  

The GUIDs for individual cells are displayed in the table below:

Summary of computational transaction
Raw Inputview raw input (R code)
Raw Outputview raw output of R engine
Computing time10 seconds
R Server'Gwilym Jenkins' @ 72.249.127.135


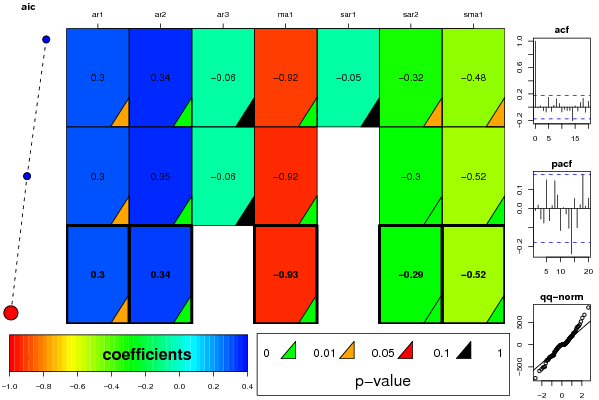
ARIMA Parameter Estimation and Backward Selection
Iterationar1ar2ar3ma1sar1sar2sma1
Estimates ( 1 )0.29680.3442-0.0588-0.9155-0.0488-0.3184-0.4763
(p-val)(0.0234 )(0.0047 )(0.5811 )(0 )(0.7904 )(0.0146 )(0.0105 )
Estimates ( 2 )0.30180.3471-0.0636-0.91660-0.2993-0.5158
(p-val)(0.0192 )(0.004 )(0.5431 )(0 )(NA )(0.0068 )(0 )
Estimates ( 3 )0.29640.34140-0.9320-0.2889-0.5203
(p-val)(0.0104 )(0.0021 )(NA )(0 )(NA )(0.0077 )(0 )
Estimates ( 4 )NANANANANANANA
(p-val)(NA )(NA )(NA )(NA )(NA )(NA )(NA )
Estimates ( 5 )NANANANANANANA
(p-val)(NA )(NA )(NA )(NA )(NA )(NA )(NA )
Estimates ( 6 )NANANANANANANA
(p-val)(NA )(NA )(NA )(NA )(NA )(NA )(NA )
Estimates ( 7 )NANANANANANANA
(p-val)(NA )(NA )(NA )(NA )(NA )(NA )(NA )
Estimates ( 8 )NANANANANANANA
(p-val)(NA )(NA )(NA )(NA )(NA )(NA )(NA )
Estimates ( 9 )NANANANANANANA
(p-val)(NA )(NA )(NA )(NA )(NA )(NA )(NA )
Estimates ( 10 )NANANANANANANA
(p-val)(NA )(NA )(NA )(NA )(NA )(NA )(NA )
Estimates ( 11 )NANANANANANANA
(p-val)(NA )(NA )(NA )(NA )(NA )(NA )(NA )
Estimates ( 12 )NANANANANANANA
(p-val)(NA )(NA )(NA )(NA )(NA )(NA )(NA )
Estimates ( 13 )NANANANANANANA
(p-val)(NA )(NA )(NA )(NA )(NA )(NA )(NA )

\begin{tabular}{lllllllll}
\hline
ARIMA Parameter Estimation and Backward Selection \tabularnewline
Iteration & ar1 & ar2 & ar3 & ma1 & sar1 & sar2 & sma1 \tabularnewline
Estimates ( 1 ) & 0.2968 & 0.3442 & -0.0588 & -0.9155 & -0.0488 & -0.3184 & -0.4763 \tabularnewline
(p-val) & (0.0234 ) & (0.0047 ) & (0.5811 ) & (0 ) & (0.7904 ) & (0.0146 ) & (0.0105 ) \tabularnewline
Estimates ( 2 ) & 0.3018 & 0.3471 & -0.0636 & -0.9166 & 0 & -0.2993 & -0.5158 \tabularnewline
(p-val) & (0.0192 ) & (0.004 ) & (0.5431 ) & (0 ) & (NA ) & (0.0068 ) & (0 ) \tabularnewline
Estimates ( 3 ) & 0.2964 & 0.3414 & 0 & -0.932 & 0 & -0.2889 & -0.5203 \tabularnewline
(p-val) & (0.0104 ) & (0.0021 ) & (NA ) & (0 ) & (NA ) & (0.0077 ) & (0 ) \tabularnewline
Estimates ( 4 ) & NA & NA & NA & NA & NA & NA & NA \tabularnewline
(p-val) & (NA ) & (NA ) & (NA ) & (NA ) & (NA ) & (NA ) & (NA ) \tabularnewline
Estimates ( 5 ) & NA & NA & NA & NA & NA & NA & NA \tabularnewline
(p-val) & (NA ) & (NA ) & (NA ) & (NA ) & (NA ) & (NA ) & (NA ) \tabularnewline
Estimates ( 6 ) & NA & NA & NA & NA & NA & NA & NA \tabularnewline
(p-val) & (NA ) & (NA ) & (NA ) & (NA ) & (NA ) & (NA ) & (NA ) \tabularnewline
Estimates ( 7 ) & NA & NA & NA & NA & NA & NA & NA \tabularnewline
(p-val) & (NA ) & (NA ) & (NA ) & (NA ) & (NA ) & (NA ) & (NA ) \tabularnewline
Estimates ( 8 ) & NA & NA & NA & NA & NA & NA & NA \tabularnewline
(p-val) & (NA ) & (NA ) & (NA ) & (NA ) & (NA ) & (NA ) & (NA ) \tabularnewline
Estimates ( 9 ) & NA & NA & NA & NA & NA & NA & NA \tabularnewline
(p-val) & (NA ) & (NA ) & (NA ) & (NA ) & (NA ) & (NA ) & (NA ) \tabularnewline
Estimates ( 10 ) & NA & NA & NA & NA & NA & NA & NA \tabularnewline
(p-val) & (NA ) & (NA ) & (NA ) & (NA ) & (NA ) & (NA ) & (NA ) \tabularnewline
Estimates ( 11 ) & NA & NA & NA & NA & NA & NA & NA \tabularnewline
(p-val) & (NA ) & (NA ) & (NA ) & (NA ) & (NA ) & (NA ) & (NA ) \tabularnewline
Estimates ( 12 ) & NA & NA & NA & NA & NA & NA & NA \tabularnewline
(p-val) & (NA ) & (NA ) & (NA ) & (NA ) & (NA ) & (NA ) & (NA ) \tabularnewline
Estimates ( 13 ) & NA & NA & NA & NA & NA & NA & NA \tabularnewline
(p-val) & (NA ) & (NA ) & (NA ) & (NA ) & (NA ) & (NA ) & (NA ) \tabularnewline
\hline
\end{tabular}
%Source: https://freestatistics.org/blog/index.php?pk=62572&T=1

[TABLE]
[ROW][C]ARIMA Parameter Estimation and Backward Selection[/C][/ROW]
[ROW][C]Iteration[/C][C]ar1[/C][C]ar2[/C][C]ar3[/C][C]ma1[/C][C]sar1[/C][C]sar2[/C][C]sma1[/C][/ROW]
[ROW][C]Estimates ( 1 )[/C][C]0.2968[/C][C]0.3442[/C][C]-0.0588[/C][C]-0.9155[/C][C]-0.0488[/C][C]-0.3184[/C][C]-0.4763[/C][/ROW]
[ROW][C](p-val)[/C][C](0.0234 )[/C][C](0.0047 )[/C][C](0.5811 )[/C][C](0 )[/C][C](0.7904 )[/C][C](0.0146 )[/C][C](0.0105 )[/C][/ROW]
[ROW][C]Estimates ( 2 )[/C][C]0.3018[/C][C]0.3471[/C][C]-0.0636[/C][C]-0.9166[/C][C]0[/C][C]-0.2993[/C][C]-0.5158[/C][/ROW]
[ROW][C](p-val)[/C][C](0.0192 )[/C][C](0.004 )[/C][C](0.5431 )[/C][C](0 )[/C][C](NA )[/C][C](0.0068 )[/C][C](0 )[/C][/ROW]
[ROW][C]Estimates ( 3 )[/C][C]0.2964[/C][C]0.3414[/C][C]0[/C][C]-0.932[/C][C]0[/C][C]-0.2889[/C][C]-0.5203[/C][/ROW]
[ROW][C](p-val)[/C][C](0.0104 )[/C][C](0.0021 )[/C][C](NA )[/C][C](0 )[/C][C](NA )[/C][C](0.0077 )[/C][C](0 )[/C][/ROW]
[ROW][C]Estimates ( 4 )[/C][C]NA[/C][C]NA[/C][C]NA[/C][C]NA[/C][C]NA[/C][C]NA[/C][C]NA[/C][/ROW]
[ROW][C](p-val)[/C][C](NA )[/C][C](NA )[/C][C](NA )[/C][C](NA )[/C][C](NA )[/C][C](NA )[/C][C](NA )[/C][/ROW]
[ROW][C]Estimates ( 5 )[/C][C]NA[/C][C]NA[/C][C]NA[/C][C]NA[/C][C]NA[/C][C]NA[/C][C]NA[/C][/ROW]
[ROW][C](p-val)[/C][C](NA )[/C][C](NA )[/C][C](NA )[/C][C](NA )[/C][C](NA )[/C][C](NA )[/C][C](NA )[/C][/ROW]
[ROW][C]Estimates ( 6 )[/C][C]NA[/C][C]NA[/C][C]NA[/C][C]NA[/C][C]NA[/C][C]NA[/C][C]NA[/C][/ROW]
[ROW][C](p-val)[/C][C](NA )[/C][C](NA )[/C][C](NA )[/C][C](NA )[/C][C](NA )[/C][C](NA )[/C][C](NA )[/C][/ROW]
[ROW][C]Estimates ( 7 )[/C][C]NA[/C][C]NA[/C][C]NA[/C][C]NA[/C][C]NA[/C][C]NA[/C][C]NA[/C][/ROW]
[ROW][C](p-val)[/C][C](NA )[/C][C](NA )[/C][C](NA )[/C][C](NA )[/C][C](NA )[/C][C](NA )[/C][C](NA )[/C][/ROW]
[ROW][C]Estimates ( 8 )[/C][C]NA[/C][C]NA[/C][C]NA[/C][C]NA[/C][C]NA[/C][C]NA[/C][C]NA[/C][/ROW]
[ROW][C](p-val)[/C][C](NA )[/C][C](NA )[/C][C](NA )[/C][C](NA )[/C][C](NA )[/C][C](NA )[/C][C](NA )[/C][/ROW]
[ROW][C]Estimates ( 9 )[/C][C]NA[/C][C]NA[/C][C]NA[/C][C]NA[/C][C]NA[/C][C]NA[/C][C]NA[/C][/ROW]
[ROW][C](p-val)[/C][C](NA )[/C][C](NA )[/C][C](NA )[/C][C](NA )[/C][C](NA )[/C][C](NA )[/C][C](NA )[/C][/ROW]
[ROW][C]Estimates ( 10 )[/C][C]NA[/C][C]NA[/C][C]NA[/C][C]NA[/C][C]NA[/C][C]NA[/C][C]NA[/C][/ROW]
[ROW][C](p-val)[/C][C](NA )[/C][C](NA )[/C][C](NA )[/C][C](NA )[/C][C](NA )[/C][C](NA )[/C][C](NA )[/C][/ROW]
[ROW][C]Estimates ( 11 )[/C][C]NA[/C][C]NA[/C][C]NA[/C][C]NA[/C][C]NA[/C][C]NA[/C][C]NA[/C][/ROW]
[ROW][C](p-val)[/C][C](NA )[/C][C](NA )[/C][C](NA )[/C][C](NA )[/C][C](NA )[/C][C](NA )[/C][C](NA )[/C][/ROW]
[ROW][C]Estimates ( 12 )[/C][C]NA[/C][C]NA[/C][C]NA[/C][C]NA[/C][C]NA[/C][C]NA[/C][C]NA[/C][/ROW]
[ROW][C](p-val)[/C][C](NA )[/C][C](NA )[/C][C](NA )[/C][C](NA )[/C][C](NA )[/C][C](NA )[/C][C](NA )[/C][/ROW]
[ROW][C]Estimates ( 13 )[/C][C]NA[/C][C]NA[/C][C]NA[/C][C]NA[/C][C]NA[/C][C]NA[/C][C]NA[/C][/ROW]
[ROW][C](p-val)[/C][C](NA )[/C][C](NA )[/C][C](NA )[/C][C](NA )[/C][C](NA )[/C][C](NA )[/C][C](NA )[/C][/ROW]
[/TABLE]
Source: https://freestatistics.org/blog/index.php?pk=62572&T=1

Globally Unique Identifier (entire table): ba.freestatistics.org/blog/index.php?pk=62572&T=1

As an alternative you can also use a QR Code:  

The GUIDs for individual cells are displayed in the table below:

ARIMA Parameter Estimation and Backward Selection
Iterationar1ar2ar3ma1sar1sar2sma1
Estimates ( 1 )0.29680.3442-0.0588-0.9155-0.0488-0.3184-0.4763
(p-val)(0.0234 )(0.0047 )(0.5811 )(0 )(0.7904 )(0.0146 )(0.0105 )
Estimates ( 2 )0.30180.3471-0.0636-0.91660-0.2993-0.5158
(p-val)(0.0192 )(0.004 )(0.5431 )(0 )(NA )(0.0068 )(0 )
Estimates ( 3 )0.29640.34140-0.9320-0.2889-0.5203
(p-val)(0.0104 )(0.0021 )(NA )(0 )(NA )(0.0077 )(0 )
Estimates ( 4 )NANANANANANANA
(p-val)(NA )(NA )(NA )(NA )(NA )(NA )(NA )
Estimates ( 5 )NANANANANANANA
(p-val)(NA )(NA )(NA )(NA )(NA )(NA )(NA )
Estimates ( 6 )NANANANANANANA
(p-val)(NA )(NA )(NA )(NA )(NA )(NA )(NA )
Estimates ( 7 )NANANANANANANA
(p-val)(NA )(NA )(NA )(NA )(NA )(NA )(NA )
Estimates ( 8 )NANANANANANANA
(p-val)(NA )(NA )(NA )(NA )(NA )(NA )(NA )
Estimates ( 9 )NANANANANANANA
(p-val)(NA )(NA )(NA )(NA )(NA )(NA )(NA )
Estimates ( 10 )NANANANANANANA
(p-val)(NA )(NA )(NA )(NA )(NA )(NA )(NA )
Estimates ( 11 )NANANANANANANA
(p-val)(NA )(NA )(NA )(NA )(NA )(NA )(NA )
Estimates ( 12 )NANANANANANANA
(p-val)(NA )(NA )(NA )(NA )(NA )(NA )(NA )
Estimates ( 13 )NANANANANANANA
(p-val)(NA )(NA )(NA )(NA )(NA )(NA )(NA )


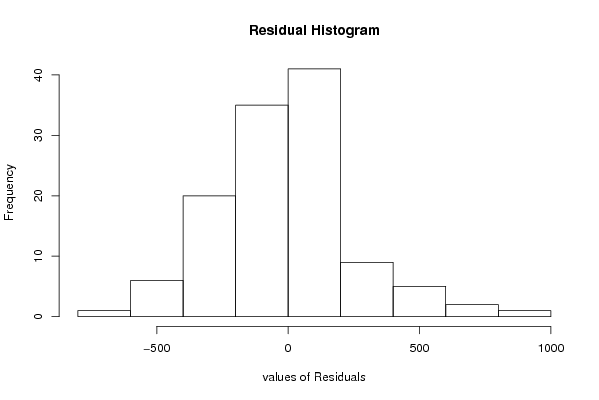
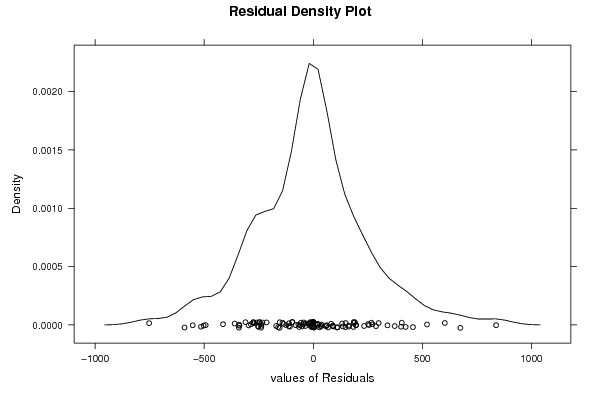
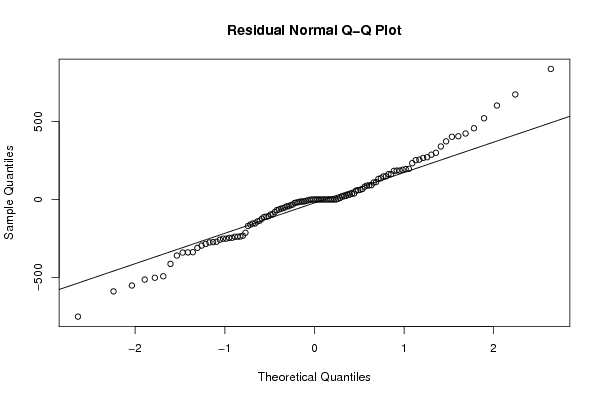
Estimated ARIMA Residuals
Value
-1.40930331385152
22.4868179882249
-6.63638434933158
37.5346375258705
-17.7128186265898
-36.2537854221417
67.7104892351356
-2.03886358141244
-0.508310027166482
20.0453032849673
-56.2445443311658
135.879661734061
37.6680980021193
-95.6522141980863
-22.6820727775076
89.4254471041655
18.8112507339782
837.985297858289
674.245849840363
233.059251735738
271.334147234322
-112.168117171029
-153.662727144951
190.867688911565
91.7015227459318
252.186088171939
402.572126621112
-13.2404273801782
-232.823491628561
-252.254892144677
-493.269385250387
-413.76374294209
-135.954988804215
-65.1814252546952
-251.659591401692
111.649324530070
185.425917548537
-275.89201376073
108.655234741835
-161.155389277295
183.702647711109
-514.504422271236
-285.711178680051
521.439876837893
147.794471927387
-51.1425296063404
-96.519742305543
255.517742768761
-246.765858007706
-339.956079920838
-68.2120617199239
162.231487404955
340.326309075126
-502.686604469666
-552.549688720700
4.24281318324626
299.664993493572
31.8763843270388
-111.121079919844
-246.125562592159
-19.2696703584058
287.444789879822
82.1896274790444
62.2835103193615
-59.2471181658173
-590.037942535849
266.566092539397
-13.0996074182021
-43.7054383046196
-107.252307525303
90.125532901333
-43.7286523864098
-170.128249378952
132.227526066314
-239.224915136424
162.803140873291
-258.220974646965
-360.192845309217
405.826525020843
185.335764006096
28.5942502371582
-271.253084094698
-81.0950813729904
-8.79565678560113
196.662052207195
-310.733958372265
423.452080701326
-237.785067683196
603.041379364879
-752.457894383416
-213.950560178393
-123.286095360247
-340.874637175047
456.961318236288
-338.479348498749
59.499183584781
-32.9926599394442
-239.351866298143
148.314767167589
57.0539597942155
-273.956734474539
373.079575781607
-296.069549664206
9.56223027470543
194.787773409570
-141.215078347844
-13.2735419781358
-154.293716892910

\begin{tabular}{lllllllll}
\hline
Estimated ARIMA Residuals \tabularnewline
Value \tabularnewline
-1.40930331385152 \tabularnewline
22.4868179882249 \tabularnewline
-6.63638434933158 \tabularnewline
37.5346375258705 \tabularnewline
-17.7128186265898 \tabularnewline
-36.2537854221417 \tabularnewline
67.7104892351356 \tabularnewline
-2.03886358141244 \tabularnewline
-0.508310027166482 \tabularnewline
20.0453032849673 \tabularnewline
-56.2445443311658 \tabularnewline
135.879661734061 \tabularnewline
37.6680980021193 \tabularnewline
-95.6522141980863 \tabularnewline
-22.6820727775076 \tabularnewline
89.4254471041655 \tabularnewline
18.8112507339782 \tabularnewline
837.985297858289 \tabularnewline
674.245849840363 \tabularnewline
233.059251735738 \tabularnewline
271.334147234322 \tabularnewline
-112.168117171029 \tabularnewline
-153.662727144951 \tabularnewline
190.867688911565 \tabularnewline
91.7015227459318 \tabularnewline
252.186088171939 \tabularnewline
402.572126621112 \tabularnewline
-13.2404273801782 \tabularnewline
-232.823491628561 \tabularnewline
-252.254892144677 \tabularnewline
-493.269385250387 \tabularnewline
-413.76374294209 \tabularnewline
-135.954988804215 \tabularnewline
-65.1814252546952 \tabularnewline
-251.659591401692 \tabularnewline
111.649324530070 \tabularnewline
185.425917548537 \tabularnewline
-275.89201376073 \tabularnewline
108.655234741835 \tabularnewline
-161.155389277295 \tabularnewline
183.702647711109 \tabularnewline
-514.504422271236 \tabularnewline
-285.711178680051 \tabularnewline
521.439876837893 \tabularnewline
147.794471927387 \tabularnewline
-51.1425296063404 \tabularnewline
-96.519742305543 \tabularnewline
255.517742768761 \tabularnewline
-246.765858007706 \tabularnewline
-339.956079920838 \tabularnewline
-68.2120617199239 \tabularnewline
162.231487404955 \tabularnewline
340.326309075126 \tabularnewline
-502.686604469666 \tabularnewline
-552.549688720700 \tabularnewline
4.24281318324626 \tabularnewline
299.664993493572 \tabularnewline
31.8763843270388 \tabularnewline
-111.121079919844 \tabularnewline
-246.125562592159 \tabularnewline
-19.2696703584058 \tabularnewline
287.444789879822 \tabularnewline
82.1896274790444 \tabularnewline
62.2835103193615 \tabularnewline
-59.2471181658173 \tabularnewline
-590.037942535849 \tabularnewline
266.566092539397 \tabularnewline
-13.0996074182021 \tabularnewline
-43.7054383046196 \tabularnewline
-107.252307525303 \tabularnewline
90.125532901333 \tabularnewline
-43.7286523864098 \tabularnewline
-170.128249378952 \tabularnewline
132.227526066314 \tabularnewline
-239.224915136424 \tabularnewline
162.803140873291 \tabularnewline
-258.220974646965 \tabularnewline
-360.192845309217 \tabularnewline
405.826525020843 \tabularnewline
185.335764006096 \tabularnewline
28.5942502371582 \tabularnewline
-271.253084094698 \tabularnewline
-81.0950813729904 \tabularnewline
-8.79565678560113 \tabularnewline
196.662052207195 \tabularnewline
-310.733958372265 \tabularnewline
423.452080701326 \tabularnewline
-237.785067683196 \tabularnewline
603.041379364879 \tabularnewline
-752.457894383416 \tabularnewline
-213.950560178393 \tabularnewline
-123.286095360247 \tabularnewline
-340.874637175047 \tabularnewline
456.961318236288 \tabularnewline
-338.479348498749 \tabularnewline
59.499183584781 \tabularnewline
-32.9926599394442 \tabularnewline
-239.351866298143 \tabularnewline
148.314767167589 \tabularnewline
57.0539597942155 \tabularnewline
-273.956734474539 \tabularnewline
373.079575781607 \tabularnewline
-296.069549664206 \tabularnewline
9.56223027470543 \tabularnewline
194.787773409570 \tabularnewline
-141.215078347844 \tabularnewline
-13.2735419781358 \tabularnewline
-154.293716892910 \tabularnewline
\hline
\end{tabular}
%Source: https://freestatistics.org/blog/index.php?pk=62572&T=2

[TABLE]
[ROW][C]Estimated ARIMA Residuals[/C][/ROW]
[ROW][C]Value[/C][/ROW]
[ROW][C]-1.40930331385152[/C][/ROW]
[ROW][C]22.4868179882249[/C][/ROW]
[ROW][C]-6.63638434933158[/C][/ROW]
[ROW][C]37.5346375258705[/C][/ROW]
[ROW][C]-17.7128186265898[/C][/ROW]
[ROW][C]-36.2537854221417[/C][/ROW]
[ROW][C]67.7104892351356[/C][/ROW]
[ROW][C]-2.03886358141244[/C][/ROW]
[ROW][C]-0.508310027166482[/C][/ROW]
[ROW][C]20.0453032849673[/C][/ROW]
[ROW][C]-56.2445443311658[/C][/ROW]
[ROW][C]135.879661734061[/C][/ROW]
[ROW][C]37.6680980021193[/C][/ROW]
[ROW][C]-95.6522141980863[/C][/ROW]
[ROW][C]-22.6820727775076[/C][/ROW]
[ROW][C]89.4254471041655[/C][/ROW]
[ROW][C]18.8112507339782[/C][/ROW]
[ROW][C]837.985297858289[/C][/ROW]
[ROW][C]674.245849840363[/C][/ROW]
[ROW][C]233.059251735738[/C][/ROW]
[ROW][C]271.334147234322[/C][/ROW]
[ROW][C]-112.168117171029[/C][/ROW]
[ROW][C]-153.662727144951[/C][/ROW]
[ROW][C]190.867688911565[/C][/ROW]
[ROW][C]91.7015227459318[/C][/ROW]
[ROW][C]252.186088171939[/C][/ROW]
[ROW][C]402.572126621112[/C][/ROW]
[ROW][C]-13.2404273801782[/C][/ROW]
[ROW][C]-232.823491628561[/C][/ROW]
[ROW][C]-252.254892144677[/C][/ROW]
[ROW][C]-493.269385250387[/C][/ROW]
[ROW][C]-413.76374294209[/C][/ROW]
[ROW][C]-135.954988804215[/C][/ROW]
[ROW][C]-65.1814252546952[/C][/ROW]
[ROW][C]-251.659591401692[/C][/ROW]
[ROW][C]111.649324530070[/C][/ROW]
[ROW][C]185.425917548537[/C][/ROW]
[ROW][C]-275.89201376073[/C][/ROW]
[ROW][C]108.655234741835[/C][/ROW]
[ROW][C]-161.155389277295[/C][/ROW]
[ROW][C]183.702647711109[/C][/ROW]
[ROW][C]-514.504422271236[/C][/ROW]
[ROW][C]-285.711178680051[/C][/ROW]
[ROW][C]521.439876837893[/C][/ROW]
[ROW][C]147.794471927387[/C][/ROW]
[ROW][C]-51.1425296063404[/C][/ROW]
[ROW][C]-96.519742305543[/C][/ROW]
[ROW][C]255.517742768761[/C][/ROW]
[ROW][C]-246.765858007706[/C][/ROW]
[ROW][C]-339.956079920838[/C][/ROW]
[ROW][C]-68.2120617199239[/C][/ROW]
[ROW][C]162.231487404955[/C][/ROW]
[ROW][C]340.326309075126[/C][/ROW]
[ROW][C]-502.686604469666[/C][/ROW]
[ROW][C]-552.549688720700[/C][/ROW]
[ROW][C]4.24281318324626[/C][/ROW]
[ROW][C]299.664993493572[/C][/ROW]
[ROW][C]31.8763843270388[/C][/ROW]
[ROW][C]-111.121079919844[/C][/ROW]
[ROW][C]-246.125562592159[/C][/ROW]
[ROW][C]-19.2696703584058[/C][/ROW]
[ROW][C]287.444789879822[/C][/ROW]
[ROW][C]82.1896274790444[/C][/ROW]
[ROW][C]62.2835103193615[/C][/ROW]
[ROW][C]-59.2471181658173[/C][/ROW]
[ROW][C]-590.037942535849[/C][/ROW]
[ROW][C]266.566092539397[/C][/ROW]
[ROW][C]-13.0996074182021[/C][/ROW]
[ROW][C]-43.7054383046196[/C][/ROW]
[ROW][C]-107.252307525303[/C][/ROW]
[ROW][C]90.125532901333[/C][/ROW]
[ROW][C]-43.7286523864098[/C][/ROW]
[ROW][C]-170.128249378952[/C][/ROW]
[ROW][C]132.227526066314[/C][/ROW]
[ROW][C]-239.224915136424[/C][/ROW]
[ROW][C]162.803140873291[/C][/ROW]
[ROW][C]-258.220974646965[/C][/ROW]
[ROW][C]-360.192845309217[/C][/ROW]
[ROW][C]405.826525020843[/C][/ROW]
[ROW][C]185.335764006096[/C][/ROW]
[ROW][C]28.5942502371582[/C][/ROW]
[ROW][C]-271.253084094698[/C][/ROW]
[ROW][C]-81.0950813729904[/C][/ROW]
[ROW][C]-8.79565678560113[/C][/ROW]
[ROW][C]196.662052207195[/C][/ROW]
[ROW][C]-310.733958372265[/C][/ROW]
[ROW][C]423.452080701326[/C][/ROW]
[ROW][C]-237.785067683196[/C][/ROW]
[ROW][C]603.041379364879[/C][/ROW]
[ROW][C]-752.457894383416[/C][/ROW]
[ROW][C]-213.950560178393[/C][/ROW]
[ROW][C]-123.286095360247[/C][/ROW]
[ROW][C]-340.874637175047[/C][/ROW]
[ROW][C]456.961318236288[/C][/ROW]
[ROW][C]-338.479348498749[/C][/ROW]
[ROW][C]59.499183584781[/C][/ROW]
[ROW][C]-32.9926599394442[/C][/ROW]
[ROW][C]-239.351866298143[/C][/ROW]
[ROW][C]148.314767167589[/C][/ROW]
[ROW][C]57.0539597942155[/C][/ROW]
[ROW][C]-273.956734474539[/C][/ROW]
[ROW][C]373.079575781607[/C][/ROW]
[ROW][C]-296.069549664206[/C][/ROW]
[ROW][C]9.56223027470543[/C][/ROW]
[ROW][C]194.787773409570[/C][/ROW]
[ROW][C]-141.215078347844[/C][/ROW]
[ROW][C]-13.2735419781358[/C][/ROW]
[ROW][C]-154.293716892910[/C][/ROW]
[/TABLE]
Source: https://freestatistics.org/blog/index.php?pk=62572&T=2

Globally Unique Identifier (entire table): ba.freestatistics.org/blog/index.php?pk=62572&T=2

As an alternative you can also use a QR Code:  

The GUIDs for individual cells are displayed in the table below:

Estimated ARIMA Residuals
Value
-1.40930331385152
22.4868179882249
-6.63638434933158
37.5346375258705
-17.7128186265898
-36.2537854221417
67.7104892351356
-2.03886358141244
-0.508310027166482
20.0453032849673
-56.2445443311658
135.879661734061
37.6680980021193
-95.6522141980863
-22.6820727775076
89.4254471041655
18.8112507339782
837.985297858289
674.245849840363
233.059251735738
271.334147234322
-112.168117171029
-153.662727144951
190.867688911565
91.7015227459318
252.186088171939
402.572126621112
-13.2404273801782
-232.823491628561
-252.254892144677
-493.269385250387
-413.76374294209
-135.954988804215
-65.1814252546952
-251.659591401692
111.649324530070
185.425917548537
-275.89201376073
108.655234741835
-161.155389277295
183.702647711109
-514.504422271236
-285.711178680051
521.439876837893
147.794471927387
-51.1425296063404
-96.519742305543
255.517742768761
-246.765858007706
-339.956079920838
-68.2120617199239
162.231487404955
340.326309075126
-502.686604469666
-552.549688720700
4.24281318324626
299.664993493572
31.8763843270388
-111.121079919844
-246.125562592159
-19.2696703584058
287.444789879822
82.1896274790444
62.2835103193615
-59.2471181658173
-590.037942535849
266.566092539397
-13.0996074182021
-43.7054383046196
-107.252307525303
90.125532901333
-43.7286523864098
-170.128249378952
132.227526066314
-239.224915136424
162.803140873291
-258.220974646965
-360.192845309217
405.826525020843
185.335764006096
28.5942502371582
-271.253084094698
-81.0950813729904
-8.79565678560113
196.662052207195
-310.733958372265
423.452080701326
-237.785067683196
603.041379364879
-752.457894383416
-213.950560178393
-123.286095360247
-340.874637175047
456.961318236288
-338.479348498749
59.499183584781
-32.9926599394442
-239.351866298143
148.314767167589
57.0539597942155
-273.956734474539
373.079575781607
-296.069549664206
9.56223027470543
194.787773409570
-141.215078347844
-13.2735419781358
-154.293716892910


Parameters (Session):
par1 = FALSE ; par2 = 1 ; par3 = 1 ; par4 = 1 ; par5 = 12 ; par6 = 3 ; par7 = 1 ; par8 = 2 ; par9 = 1 ;
Parameters (R input):
par1 = FALSE ; par2 = 1 ; par3 = 1 ; par4 = 1 ; par5 = 12 ; par6 = 3 ; par7 = 1 ; par8 = 2 ; par9 = 1 ;
R code (references can be found in the software module):
library(lattice)
if (par1 == 'TRUE') par1 <- TRUE
if (par1 == 'FALSE') par1 <- FALSE
par2 <- as.numeric(par2) #Box-Cox lambda transformation parameter
par3 <- as.numeric(par3) #degree of non-seasonal differencing
par4 <- as.numeric(par4) #degree of seasonal differencing
par5 <- as.numeric(par5) #seasonal period
par6 <- as.numeric(par6) #degree (p) of the non-seasonal AR(p) polynomial
par7 <- as.numeric(par7) #degree (q) of the non-seasonal MA(q) polynomial
par8 <- as.numeric(par8) #degree (P) of the seasonal AR(P) polynomial
par9 <- as.numeric(par9) #degree (Q) of the seasonal MA(Q) polynomial
armaGR <- function(arima.out, names, n){
try1 <- arima.out$coef
try2 <- sqrt(diag(arima.out$var.coef))
try.data.frame <- data.frame(matrix(NA,ncol=4,nrow=length(names)))
dimnames(try.data.frame) <- list(names,c('coef','std','tstat','pv'))
try.data.frame[,1] <- try1
for(i in 1:length(try2)) try.data.frame[which(rownames(try.data.frame)==names(try2)[i]),2] <- try2[i]
try.data.frame[,3] <- try.data.frame[,1] / try.data.frame[,2]
try.data.frame[,4] <- round((1-pt(abs(try.data.frame[,3]),df=n-(length(try2)+1)))*2,5)
vector <- rep(NA,length(names))
vector[is.na(try.data.frame[,4])] <- 0
maxi <- which.max(try.data.frame[,4])
continue <- max(try.data.frame[,4],na.rm=TRUE) > .05
vector[maxi] <- 0
list(summary=try.data.frame,next.vector=vector,continue=continue)
}
arimaSelect <- function(series, order=c(13,0,0), seasonal=list(order=c(2,0,0),period=12), include.mean=F){
nrc <- order[1]+order[3]+seasonal$order[1]+seasonal$order[3]
coeff <- matrix(NA, nrow=nrc*2, ncol=nrc)
pval <- matrix(NA, nrow=nrc*2, ncol=nrc)
mylist <- rep(list(NULL), nrc)
names <- NULL
if(order[1] > 0) names <- paste('ar',1:order[1],sep='')
if(order[3] > 0) names <- c( names , paste('ma',1:order[3],sep='') )
if(seasonal$order[1] > 0) names <- c(names, paste('sar',1:seasonal$order[1],sep=''))
if(seasonal$order[3] > 0) names <- c(names, paste('sma',1:seasonal$order[3],sep=''))
arima.out <- arima(series, order=order, seasonal=seasonal, include.mean=include.mean, method='ML')
mylist[[1]] <- arima.out
last.arma <- armaGR(arima.out, names, length(series))
mystop <- FALSE
i <- 1
coeff[i,] <- last.arma[[1]][,1]
pval [i,] <- last.arma[[1]][,4]
i <- 2
aic <- arima.out$aic
while(!mystop){
mylist[[i]] <- arima.out
arima.out <- arima(series, order=order, seasonal=seasonal, include.mean=include.mean, method='ML', fixed=last.arma$next.vector)
aic <- c(aic, arima.out$aic)
last.arma <- armaGR(arima.out, names, length(series))
mystop <- !last.arma$continue
coeff[i,] <- last.arma[[1]][,1]
pval [i,] <- last.arma[[1]][,4]
i <- i+1
}
list(coeff, pval, mylist, aic=aic)
}
arimaSelectplot <- function(arimaSelect.out,noms,choix){
noms <- names(arimaSelect.out[[3]][[1]]$coef)
coeff <- arimaSelect.out[[1]]
k <- min(which(is.na(coeff[,1])))-1
coeff <- coeff[1:k,]
pval <- arimaSelect.out[[2]][1:k,]
aic <- arimaSelect.out$aic[1:k]
coeff[coeff==0] <- NA
n <- ncol(coeff)
if(missing(choix)) choix <- k
layout(matrix(c(1,1,1,2,
3,3,3,2,
3,3,3,4,
5,6,7,7),nr=4),
widths=c(10,35,45,15),
heights=c(30,30,15,15))
couleurs <- rainbow(75)[1:50]#(50)
ticks <- pretty(coeff)
par(mar=c(1,1,3,1))
plot(aic,k:1-.5,type='o',pch=21,bg='blue',cex=2,axes=F,lty=2,xpd=NA)
points(aic[choix],k-choix+.5,pch=21,cex=4,bg=2,xpd=NA)
title('aic',line=2)
par(mar=c(3,0,0,0))
plot(0,axes=F,xlab='',ylab='',xlim=range(ticks),ylim=c(.1,1))
rect(xleft = min(ticks) + (0:49)/50*(max(ticks)-min(ticks)),
xright = min(ticks) + (1:50)/50*(max(ticks)-min(ticks)),
ytop = rep(1,50),
ybottom= rep(0,50),col=couleurs,border=NA)
axis(1,ticks)
rect(xleft=min(ticks),xright=max(ticks),ytop=1,ybottom=0)
text(mean(coeff,na.rm=T),.5,'coefficients',cex=2,font=2)
par(mar=c(1,1,3,1))
image(1:n,1:k,t(coeff[k:1,]),axes=F,col=couleurs,zlim=range(ticks))
for(i in 1:n) for(j in 1:k) if(!is.na(coeff[j,i])) {
if(pval[j,i]<.01) symb = 'green'
else if( (pval[j,i]<.05) & (pval[j,i]>=.01)) symb = 'orange'
else if( (pval[j,i]<.1) & (pval[j,i]>=.05)) symb = 'red'
else symb = 'black'
polygon(c(i+.5 ,i+.2 ,i+.5 ,i+.5),
c(k-j+0.5,k-j+0.5,k-j+0.8,k-j+0.5),
col=symb)
if(j==choix) {
rect(xleft=i-.5,
xright=i+.5,
ybottom=k-j+1.5,
ytop=k-j+.5,
lwd=4)
text(i,
k-j+1,
round(coeff[j,i],2),
cex=1.2,
font=2)
}
else{
rect(xleft=i-.5,xright=i+.5,ybottom=k-j+1.5,ytop=k-j+.5)
text(i,k-j+1,round(coeff[j,i],2),cex=1.2,font=1)
}
}
axis(3,1:n,noms)
par(mar=c(0.5,0,0,0.5))
plot(0,axes=F,xlab='',ylab='',type='n',xlim=c(0,8),ylim=c(-.2,.8))
cols <- c('green','orange','red','black')
niv <- c('0','0.01','0.05','0.1')
for(i in 0:3){
polygon(c(1+2*i ,1+2*i ,1+2*i-.5 ,1+2*i),
c(.4 ,.7 , .4 , .4),
col=cols[i+1])
text(2*i,0.5,niv[i+1],cex=1.5)
}
text(8,.5,1,cex=1.5)
text(4,0,'p-value',cex=2)
box()
residus <- arimaSelect.out[[3]][[choix]]$res
par(mar=c(1,2,4,1))
acf(residus,main='')
title('acf',line=.5)
par(mar=c(1,2,4,1))
pacf(residus,main='')
title('pacf',line=.5)
par(mar=c(2,2,4,1))
qqnorm(residus,main='')
title('qq-norm',line=.5)
qqline(residus)
residus
}
if (par2 == 0) x <- log(x)
if (par2 != 0) x <- x^par2
(selection <- arimaSelect(x, order=c(par6,par3,par7), seasonal=list(order=c(par8,par4,par9), period=par5)))
bitmap(file='test1.png')
resid <- arimaSelectplot(selection)
dev.off()
resid
bitmap(file='test2.png')
acf(resid,length(resid)/2, main='Residual Autocorrelation Function')
dev.off()
bitmap(file='test3.png')
pacf(resid,length(resid)/2, main='Residual Partial Autocorrelation Function')
dev.off()
bitmap(file='test4.png')
cpgram(resid, main='Residual Cumulative Periodogram')
dev.off()
bitmap(file='test5.png')
hist(resid, main='Residual Histogram', xlab='values of Residuals')
dev.off()
bitmap(file='test6.png')
densityplot(~resid,col='black',main='Residual Density Plot', xlab='values of Residuals')
dev.off()
bitmap(file='test7.png')
qqnorm(resid, main='Residual Normal Q-Q Plot')
qqline(resid)
dev.off()
ncols <- length(selection[[1]][1,])
nrows <- length(selection[[2]][,1])-1
load(file='createtable')
a<-table.start()
a<-table.row.start(a)
a<-table.element(a,'ARIMA Parameter Estimation and Backward Selection', ncols+1,TRUE)
a<-table.row.end(a)
a<-table.row.start(a)
a<-table.element(a,'Iteration', header=TRUE)
for (i in 1:ncols) {
a<-table.element(a,names(selection[[3]][[1]]$coef)[i],header=TRUE)
}
a<-table.row.end(a)
for (j in 1:nrows) {
a<-table.row.start(a)
mydum <- 'Estimates ('
mydum <- paste(mydum,j)
mydum <- paste(mydum,')')
a<-table.element(a,mydum, header=TRUE)
for (i in 1:ncols) {
a<-table.element(a,round(selection[[1]][j,i],4))
}
a<-table.row.end(a)
a<-table.row.start(a)
a<-table.element(a,'(p-val)', header=TRUE)
for (i in 1:ncols) {
mydum <- '('
mydum <- paste(mydum,round(selection[[2]][j,i],4),sep='')
mydum <- paste(mydum,')')
a<-table.element(a,mydum)
}
a<-table.row.end(a)
}
a<-table.end(a)
table.save(a,file='mytable.tab')
a<-table.start()
a<-table.row.start(a)
a<-table.element(a,'Estimated ARIMA Residuals', 1,TRUE)
a<-table.row.end(a)
a<-table.row.start(a)
a<-table.element(a,'Value', 1,TRUE)
a<-table.row.end(a)
for (i in (par4*par5+par3):length(resid)) {
a<-table.row.start(a)
a<-table.element(a,resid[i])
a<-table.row.end(a)
}
a<-table.end(a)
table.save(a,file='mytable1.tab')