Free Statistics

of Irreproducible Research!

Author's title

Author*The author of this computation has been verified*
R Software Modulerwasp_exponentialsmoothing.wasp
Title produced by softwareExponential Smoothing
Date of computationWed, 02 Dec 2009 14:06:49 -0700
Cite this page as followsStatistical Computations at FreeStatistics.org, Office for Research Development and Education, URL https://freestatistics.org/blog/index.php?v=date/2009/Dec/02/t1259788073ggdzhxh8c2syxkc.htm/, Retrieved Sat, 27 Apr 2024 23:35:22 +0000
Statistical Computations at FreeStatistics.org, Office for Research Development and Education, URL https://freestatistics.org/blog/index.php?pk=62588, Retrieved Sat, 27 Apr 2024 23:35:22 +0000
QR Codes:

Original text written by user:
IsPrivate?No (this computation is public)
User-defined keywords
Estimated Impact146
Family? (F = Feedback message, R = changed R code, M = changed R Module, P = changed Parameters, D = changed Data)
-     [Univariate Data Series] [data set] [2008-12-01 19:54:57] [b98453cac15ba1066b407e146608df68]
- RMP   [Exponential Smoothing] [] [2009-11-27 15:04:36] [b98453cac15ba1066b407e146608df68]
- R  D      [Exponential Smoothing] [] [2009-12-02 21:06:49] [7c5623390f136c6c339940134868d3e2] [Current]
- R P         [Exponential Smoothing] [] [2009-12-16 21:07:58] [00ae4ca1aa430eb3950856e282097098]
Feedback Forum

Post a new message
Dataseries X:
519
517
510
509
501
507
569
580
578
565
547
555
562
561
555
544
537
543
594
611
613
611
594
595
591
589
584
573
567
569
621
629
628
612
595
597
593
590
580
574
573
573
620
626
620
588
566
557
561
549
532
526
511
499
555
565
542
527
510
514
517
508
493
490
469
478
528
534
518
506
502
516


Summary of computational transaction
Raw Inputview raw input (R code)
Raw Outputview raw output of R engine
Computing time1 seconds
R Server'Gwilym Jenkins' @ 72.249.127.135

\begin{tabular}{lllllllll}
\hline
Summary of computational transaction \tabularnewline
Raw Input & view raw input (R code)  \tabularnewline
Raw Output & view raw output of R engine  \tabularnewline
Computing time & 1 seconds \tabularnewline
R Server & 'Gwilym Jenkins' @ 72.249.127.135 \tabularnewline
\hline
\end{tabular}
%Source: https://freestatistics.org/blog/index.php?pk=62588&T=0

[TABLE]
[ROW][C]Summary of computational transaction[/C][/ROW]
[ROW][C]Raw Input[/C][C]view raw input (R code) [/C][/ROW]
[ROW][C]Raw Output[/C][C]view raw output of R engine [/C][/ROW]
[ROW][C]Computing time[/C][C]1 seconds[/C][/ROW]
[ROW][C]R Server[/C][C]'Gwilym Jenkins' @ 72.249.127.135[/C][/ROW]
[/TABLE]
Source: https://freestatistics.org/blog/index.php?pk=62588&T=0

Globally Unique Identifier (entire table): ba.freestatistics.org/blog/index.php?pk=62588&T=0

As an alternative you can also use a QR Code:  

The GUIDs for individual cells are displayed in the table below:

Summary of computational transaction
Raw Inputview raw input (R code)
Raw Outputview raw output of R engine
Computing time1 seconds
R Server'Gwilym Jenkins' @ 72.249.127.135


Estimated Parameters of Exponential Smoothing
ParameterValue
alpha0.948539541873247
beta0.106971000311946
gamma1

\begin{tabular}{lllllllll}
\hline
Estimated Parameters of Exponential Smoothing \tabularnewline
Parameter & Value \tabularnewline
alpha & 0.948539541873247 \tabularnewline
beta & 0.106971000311946 \tabularnewline
gamma & 1 \tabularnewline
\hline
\end{tabular}
%Source: https://freestatistics.org/blog/index.php?pk=62588&T=1

[TABLE]
[ROW][C]Estimated Parameters of Exponential Smoothing[/C][/ROW]
[ROW][C]Parameter[/C][C]Value[/C][/ROW]
[ROW][C]alpha[/C][C]0.948539541873247[/C][/ROW]
[ROW][C]beta[/C][C]0.106971000311946[/C][/ROW]
[ROW][C]gamma[/C][C]1[/C][/ROW]
[/TABLE]
Source: https://freestatistics.org/blog/index.php?pk=62588&T=1

Globally Unique Identifier (entire table): ba.freestatistics.org/blog/index.php?pk=62588&T=1

As an alternative you can also use a QR Code:  

The GUIDs for individual cells are displayed in the table below:

Estimated Parameters of Exponential Smoothing
ParameterValue
alpha0.948539541873247
beta0.106971000311946
gamma1


Interpolation Forecasts of Exponential Smoothing
tObservedFittedResiduals
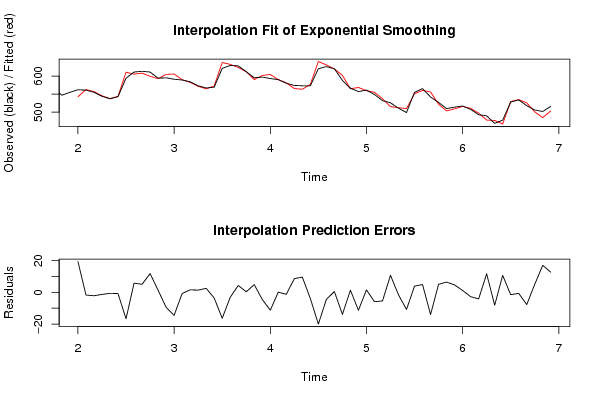
13562542.60375360456519.396246395435
14561562.67893320641-1.67893320641008
15555557.13712453219-2.13712453218955
16544545.296186541336-1.29618654133628
17537537.632301941896-0.632301941895889
18543543.773941164938-0.773941164938151
19594610.624553799897-16.6245537998971
20611605.2204962327115.77950376728927
21613607.9324975430035.06750245699652
22611599.19282229550111.8071777044992
23594592.6598632433531.34013675664733
24595604.42270246888-9.42270246887938
25591605.459975445812-14.4599754458123
26589589.750678483172-0.750678483171896
27584582.4060250105411.59397498945930
28573571.6103940580131.38960594198727
29567564.4689853740502.53101462594952
30569572.567019939157-3.56701993915726
31621637.298145630074-16.2981456300740
32629632.134000993372-3.13400099337161
33628623.6641505255354.33584947446491
34612611.6498599887150.350140011284793
35595590.1440617830444.85593821695602
36597601.488049543403-4.48804954340289
37593604.226360276133-11.2263602761333
38590589.8906975471260.109302452873521
39580581.20759472446-1.20759472445945
40574565.3661137196148.63388628038649
41573563.43390958299.56609041709953
42573576.913257121299-3.91325712129913
43620639.963572355668-19.9635723556677
44626630.448972435625-4.44897243562536
45620619.4735270422430.526472957757051
46588601.87013967871-13.8701396787096
47566564.6684139128351.33158608716542
48557568.276074636277-11.2760746362766
49561559.4501707983841.54982920161638
50549554.888995403075-5.88899540307534
51532537.4170501947-5.4170501947001
52526515.27598232314110.7240176768589
53511512.601559463865-1.60155946386476
54499509.754974120898-10.7549741208981
55555551.0703317993763.92966820062384
56565560.1051941468014.89480585319893
57542555.981011405056-13.9810114050563
58527521.9516652540315.04833474596876
59510503.5156946266686.48430537333206
60514509.3323201098694.66767989013061
61517515.8075278316141.19247216838585
62508510.715216383635-2.71521638363527
63493497.137331636746-4.13733163674567
64490478.28185124599111.7181487540090
65469477.10886631827-8.10886631826992
66478467.30340490506310.6965950949365
67528529.452570270792-1.45257027079163
68534534.633319338097-0.633319338096726
69518525.705125960585-7.70512596058461
70506500.9327438988825.06725610111772
71502484.96757082773517.0324291722645
72516503.34264975588712.6573502441134

\begin{tabular}{lllllllll}
\hline
Interpolation Forecasts of Exponential Smoothing \tabularnewline
t & Observed & Fitted & Residuals \tabularnewline
13 & 562 & 542.603753604565 & 19.396246395435 \tabularnewline
14 & 561 & 562.67893320641 & -1.67893320641008 \tabularnewline
15 & 555 & 557.13712453219 & -2.13712453218955 \tabularnewline
16 & 544 & 545.296186541336 & -1.29618654133628 \tabularnewline
17 & 537 & 537.632301941896 & -0.632301941895889 \tabularnewline
18 & 543 & 543.773941164938 & -0.773941164938151 \tabularnewline
19 & 594 & 610.624553799897 & -16.6245537998971 \tabularnewline
20 & 611 & 605.220496232711 & 5.77950376728927 \tabularnewline
21 & 613 & 607.932497543003 & 5.06750245699652 \tabularnewline
22 & 611 & 599.192822295501 & 11.8071777044992 \tabularnewline
23 & 594 & 592.659863243353 & 1.34013675664733 \tabularnewline
24 & 595 & 604.42270246888 & -9.42270246887938 \tabularnewline
25 & 591 & 605.459975445812 & -14.4599754458123 \tabularnewline
26 & 589 & 589.750678483172 & -0.750678483171896 \tabularnewline
27 & 584 & 582.406025010541 & 1.59397498945930 \tabularnewline
28 & 573 & 571.610394058013 & 1.38960594198727 \tabularnewline
29 & 567 & 564.468985374050 & 2.53101462594952 \tabularnewline
30 & 569 & 572.567019939157 & -3.56701993915726 \tabularnewline
31 & 621 & 637.298145630074 & -16.2981456300740 \tabularnewline
32 & 629 & 632.134000993372 & -3.13400099337161 \tabularnewline
33 & 628 & 623.664150525535 & 4.33584947446491 \tabularnewline
34 & 612 & 611.649859988715 & 0.350140011284793 \tabularnewline
35 & 595 & 590.144061783044 & 4.85593821695602 \tabularnewline
36 & 597 & 601.488049543403 & -4.48804954340289 \tabularnewline
37 & 593 & 604.226360276133 & -11.2263602761333 \tabularnewline
38 & 590 & 589.890697547126 & 0.109302452873521 \tabularnewline
39 & 580 & 581.20759472446 & -1.20759472445945 \tabularnewline
40 & 574 & 565.366113719614 & 8.63388628038649 \tabularnewline
41 & 573 & 563.4339095829 & 9.56609041709953 \tabularnewline
42 & 573 & 576.913257121299 & -3.91325712129913 \tabularnewline
43 & 620 & 639.963572355668 & -19.9635723556677 \tabularnewline
44 & 626 & 630.448972435625 & -4.44897243562536 \tabularnewline
45 & 620 & 619.473527042243 & 0.526472957757051 \tabularnewline
46 & 588 & 601.87013967871 & -13.8701396787096 \tabularnewline
47 & 566 & 564.668413912835 & 1.33158608716542 \tabularnewline
48 & 557 & 568.276074636277 & -11.2760746362766 \tabularnewline
49 & 561 & 559.450170798384 & 1.54982920161638 \tabularnewline
50 & 549 & 554.888995403075 & -5.88899540307534 \tabularnewline
51 & 532 & 537.4170501947 & -5.4170501947001 \tabularnewline
52 & 526 & 515.275982323141 & 10.7240176768589 \tabularnewline
53 & 511 & 512.601559463865 & -1.60155946386476 \tabularnewline
54 & 499 & 509.754974120898 & -10.7549741208981 \tabularnewline
55 & 555 & 551.070331799376 & 3.92966820062384 \tabularnewline
56 & 565 & 560.105194146801 & 4.89480585319893 \tabularnewline
57 & 542 & 555.981011405056 & -13.9810114050563 \tabularnewline
58 & 527 & 521.951665254031 & 5.04833474596876 \tabularnewline
59 & 510 & 503.515694626668 & 6.48430537333206 \tabularnewline
60 & 514 & 509.332320109869 & 4.66767989013061 \tabularnewline
61 & 517 & 515.807527831614 & 1.19247216838585 \tabularnewline
62 & 508 & 510.715216383635 & -2.71521638363527 \tabularnewline
63 & 493 & 497.137331636746 & -4.13733163674567 \tabularnewline
64 & 490 & 478.281851245991 & 11.7181487540090 \tabularnewline
65 & 469 & 477.10886631827 & -8.10886631826992 \tabularnewline
66 & 478 & 467.303404905063 & 10.6965950949365 \tabularnewline
67 & 528 & 529.452570270792 & -1.45257027079163 \tabularnewline
68 & 534 & 534.633319338097 & -0.633319338096726 \tabularnewline
69 & 518 & 525.705125960585 & -7.70512596058461 \tabularnewline
70 & 506 & 500.932743898882 & 5.06725610111772 \tabularnewline
71 & 502 & 484.967570827735 & 17.0324291722645 \tabularnewline
72 & 516 & 503.342649755887 & 12.6573502441134 \tabularnewline
\hline
\end{tabular}
%Source: https://freestatistics.org/blog/index.php?pk=62588&T=2

[TABLE]
[ROW][C]Interpolation Forecasts of Exponential Smoothing[/C][/ROW]
[ROW][C]t[/C][C]Observed[/C][C]Fitted[/C][C]Residuals[/C][/ROW]
[ROW][C]13[/C][C]562[/C][C]542.603753604565[/C][C]19.396246395435[/C][/ROW]
[ROW][C]14[/C][C]561[/C][C]562.67893320641[/C][C]-1.67893320641008[/C][/ROW]
[ROW][C]15[/C][C]555[/C][C]557.13712453219[/C][C]-2.13712453218955[/C][/ROW]
[ROW][C]16[/C][C]544[/C][C]545.296186541336[/C][C]-1.29618654133628[/C][/ROW]
[ROW][C]17[/C][C]537[/C][C]537.632301941896[/C][C]-0.632301941895889[/C][/ROW]
[ROW][C]18[/C][C]543[/C][C]543.773941164938[/C][C]-0.773941164938151[/C][/ROW]
[ROW][C]19[/C][C]594[/C][C]610.624553799897[/C][C]-16.6245537998971[/C][/ROW]
[ROW][C]20[/C][C]611[/C][C]605.220496232711[/C][C]5.77950376728927[/C][/ROW]
[ROW][C]21[/C][C]613[/C][C]607.932497543003[/C][C]5.06750245699652[/C][/ROW]
[ROW][C]22[/C][C]611[/C][C]599.192822295501[/C][C]11.8071777044992[/C][/ROW]
[ROW][C]23[/C][C]594[/C][C]592.659863243353[/C][C]1.34013675664733[/C][/ROW]
[ROW][C]24[/C][C]595[/C][C]604.42270246888[/C][C]-9.42270246887938[/C][/ROW]
[ROW][C]25[/C][C]591[/C][C]605.459975445812[/C][C]-14.4599754458123[/C][/ROW]
[ROW][C]26[/C][C]589[/C][C]589.750678483172[/C][C]-0.750678483171896[/C][/ROW]
[ROW][C]27[/C][C]584[/C][C]582.406025010541[/C][C]1.59397498945930[/C][/ROW]
[ROW][C]28[/C][C]573[/C][C]571.610394058013[/C][C]1.38960594198727[/C][/ROW]
[ROW][C]29[/C][C]567[/C][C]564.468985374050[/C][C]2.53101462594952[/C][/ROW]
[ROW][C]30[/C][C]569[/C][C]572.567019939157[/C][C]-3.56701993915726[/C][/ROW]
[ROW][C]31[/C][C]621[/C][C]637.298145630074[/C][C]-16.2981456300740[/C][/ROW]
[ROW][C]32[/C][C]629[/C][C]632.134000993372[/C][C]-3.13400099337161[/C][/ROW]
[ROW][C]33[/C][C]628[/C][C]623.664150525535[/C][C]4.33584947446491[/C][/ROW]
[ROW][C]34[/C][C]612[/C][C]611.649859988715[/C][C]0.350140011284793[/C][/ROW]
[ROW][C]35[/C][C]595[/C][C]590.144061783044[/C][C]4.85593821695602[/C][/ROW]
[ROW][C]36[/C][C]597[/C][C]601.488049543403[/C][C]-4.48804954340289[/C][/ROW]
[ROW][C]37[/C][C]593[/C][C]604.226360276133[/C][C]-11.2263602761333[/C][/ROW]
[ROW][C]38[/C][C]590[/C][C]589.890697547126[/C][C]0.109302452873521[/C][/ROW]
[ROW][C]39[/C][C]580[/C][C]581.20759472446[/C][C]-1.20759472445945[/C][/ROW]
[ROW][C]40[/C][C]574[/C][C]565.366113719614[/C][C]8.63388628038649[/C][/ROW]
[ROW][C]41[/C][C]573[/C][C]563.4339095829[/C][C]9.56609041709953[/C][/ROW]
[ROW][C]42[/C][C]573[/C][C]576.913257121299[/C][C]-3.91325712129913[/C][/ROW]
[ROW][C]43[/C][C]620[/C][C]639.963572355668[/C][C]-19.9635723556677[/C][/ROW]
[ROW][C]44[/C][C]626[/C][C]630.448972435625[/C][C]-4.44897243562536[/C][/ROW]
[ROW][C]45[/C][C]620[/C][C]619.473527042243[/C][C]0.526472957757051[/C][/ROW]
[ROW][C]46[/C][C]588[/C][C]601.87013967871[/C][C]-13.8701396787096[/C][/ROW]
[ROW][C]47[/C][C]566[/C][C]564.668413912835[/C][C]1.33158608716542[/C][/ROW]
[ROW][C]48[/C][C]557[/C][C]568.276074636277[/C][C]-11.2760746362766[/C][/ROW]
[ROW][C]49[/C][C]561[/C][C]559.450170798384[/C][C]1.54982920161638[/C][/ROW]
[ROW][C]50[/C][C]549[/C][C]554.888995403075[/C][C]-5.88899540307534[/C][/ROW]
[ROW][C]51[/C][C]532[/C][C]537.4170501947[/C][C]-5.4170501947001[/C][/ROW]
[ROW][C]52[/C][C]526[/C][C]515.275982323141[/C][C]10.7240176768589[/C][/ROW]
[ROW][C]53[/C][C]511[/C][C]512.601559463865[/C][C]-1.60155946386476[/C][/ROW]
[ROW][C]54[/C][C]499[/C][C]509.754974120898[/C][C]-10.7549741208981[/C][/ROW]
[ROW][C]55[/C][C]555[/C][C]551.070331799376[/C][C]3.92966820062384[/C][/ROW]
[ROW][C]56[/C][C]565[/C][C]560.105194146801[/C][C]4.89480585319893[/C][/ROW]
[ROW][C]57[/C][C]542[/C][C]555.981011405056[/C][C]-13.9810114050563[/C][/ROW]
[ROW][C]58[/C][C]527[/C][C]521.951665254031[/C][C]5.04833474596876[/C][/ROW]
[ROW][C]59[/C][C]510[/C][C]503.515694626668[/C][C]6.48430537333206[/C][/ROW]
[ROW][C]60[/C][C]514[/C][C]509.332320109869[/C][C]4.66767989013061[/C][/ROW]
[ROW][C]61[/C][C]517[/C][C]515.807527831614[/C][C]1.19247216838585[/C][/ROW]
[ROW][C]62[/C][C]508[/C][C]510.715216383635[/C][C]-2.71521638363527[/C][/ROW]
[ROW][C]63[/C][C]493[/C][C]497.137331636746[/C][C]-4.13733163674567[/C][/ROW]
[ROW][C]64[/C][C]490[/C][C]478.281851245991[/C][C]11.7181487540090[/C][/ROW]
[ROW][C]65[/C][C]469[/C][C]477.10886631827[/C][C]-8.10886631826992[/C][/ROW]
[ROW][C]66[/C][C]478[/C][C]467.303404905063[/C][C]10.6965950949365[/C][/ROW]
[ROW][C]67[/C][C]528[/C][C]529.452570270792[/C][C]-1.45257027079163[/C][/ROW]
[ROW][C]68[/C][C]534[/C][C]534.633319338097[/C][C]-0.633319338096726[/C][/ROW]
[ROW][C]69[/C][C]518[/C][C]525.705125960585[/C][C]-7.70512596058461[/C][/ROW]
[ROW][C]70[/C][C]506[/C][C]500.932743898882[/C][C]5.06725610111772[/C][/ROW]
[ROW][C]71[/C][C]502[/C][C]484.967570827735[/C][C]17.0324291722645[/C][/ROW]
[ROW][C]72[/C][C]516[/C][C]503.342649755887[/C][C]12.6573502441134[/C][/ROW]
[/TABLE]
Source: https://freestatistics.org/blog/index.php?pk=62588&T=2

Globally Unique Identifier (entire table): ba.freestatistics.org/blog/index.php?pk=62588&T=2

As an alternative you can also use a QR Code:  

The GUIDs for individual cells are displayed in the table below:

Interpolation Forecasts of Exponential Smoothing
tObservedFittedResiduals
13562542.60375360456519.396246395435
14561562.67893320641-1.67893320641008
15555557.13712453219-2.13712453218955
16544545.296186541336-1.29618654133628
17537537.632301941896-0.632301941895889
18543543.773941164938-0.773941164938151
19594610.624553799897-16.6245537998971
20611605.2204962327115.77950376728927
21613607.9324975430035.06750245699652
22611599.19282229550111.8071777044992
23594592.6598632433531.34013675664733
24595604.42270246888-9.42270246887938
25591605.459975445812-14.4599754458123
26589589.750678483172-0.750678483171896
27584582.4060250105411.59397498945930
28573571.6103940580131.38960594198727
29567564.4689853740502.53101462594952
30569572.567019939157-3.56701993915726
31621637.298145630074-16.2981456300740
32629632.134000993372-3.13400099337161
33628623.6641505255354.33584947446491
34612611.6498599887150.350140011284793
35595590.1440617830444.85593821695602
36597601.488049543403-4.48804954340289
37593604.226360276133-11.2263602761333
38590589.8906975471260.109302452873521
39580581.20759472446-1.20759472445945
40574565.3661137196148.63388628038649
41573563.43390958299.56609041709953
42573576.913257121299-3.91325712129913
43620639.963572355668-19.9635723556677
44626630.448972435625-4.44897243562536
45620619.4735270422430.526472957757051
46588601.87013967871-13.8701396787096
47566564.6684139128351.33158608716542
48557568.276074636277-11.2760746362766
49561559.4501707983841.54982920161638
50549554.888995403075-5.88899540307534
51532537.4170501947-5.4170501947001
52526515.27598232314110.7240176768589
53511512.601559463865-1.60155946386476
54499509.754974120898-10.7549741208981
55555551.0703317993763.92966820062384
56565560.1051941468014.89480585319893
57542555.981011405056-13.9810114050563
58527521.9516652540315.04833474596876
59510503.5156946266686.48430537333206
60514509.3323201098694.66767989013061
61517515.8075278316141.19247216838585
62508510.715216383635-2.71521638363527
63493497.137331636746-4.13733163674567
64490478.28185124599111.7181487540090
65469477.10886631827-8.10886631826992
66478467.30340490506310.6965950949365
67528529.452570270792-1.45257027079163
68534534.633319338097-0.633319338096726
69518525.705125960585-7.70512596058461
70506500.9327438988825.06725610111772
71502484.96757082773517.0324291722645
72516503.34264975588712.6573502441134


Extrapolation Forecasts of Exponential Smoothing
tForecast95% Lower Bound95% Upper Bound
73520.776912236449504.512843323194537.040981149703
74517.728502638577494.229076358109541.227928919045
75510.119883747051480.414482196172539.825285297931
76499.574685313847464.231949365219534.917421262476
77488.743325503956448.047011282732529.43963972518
78491.203303334836444.222961474632538.183645195041
79546.786284149215488.220833488893605.351734809537
80556.628819766496490.564551381029622.693088151964
81550.617506821196478.756947017309622.478066625084
82536.58131880358460.030384302385613.132253304776
83518.340686197876437.888717695555598.792654700197
84521.696250914254429.175056936751614.217444891757

\begin{tabular}{lllllllll}
\hline
Extrapolation Forecasts of Exponential Smoothing \tabularnewline
t & Forecast & 95% Lower Bound & 95% Upper Bound \tabularnewline
73 & 520.776912236449 & 504.512843323194 & 537.040981149703 \tabularnewline
74 & 517.728502638577 & 494.229076358109 & 541.227928919045 \tabularnewline
75 & 510.119883747051 & 480.414482196172 & 539.825285297931 \tabularnewline
76 & 499.574685313847 & 464.231949365219 & 534.917421262476 \tabularnewline
77 & 488.743325503956 & 448.047011282732 & 529.43963972518 \tabularnewline
78 & 491.203303334836 & 444.222961474632 & 538.183645195041 \tabularnewline
79 & 546.786284149215 & 488.220833488893 & 605.351734809537 \tabularnewline
80 & 556.628819766496 & 490.564551381029 & 622.693088151964 \tabularnewline
81 & 550.617506821196 & 478.756947017309 & 622.478066625084 \tabularnewline
82 & 536.58131880358 & 460.030384302385 & 613.132253304776 \tabularnewline
83 & 518.340686197876 & 437.888717695555 & 598.792654700197 \tabularnewline
84 & 521.696250914254 & 429.175056936751 & 614.217444891757 \tabularnewline
\hline
\end{tabular}
%Source: https://freestatistics.org/blog/index.php?pk=62588&T=3

[TABLE]
[ROW][C]Extrapolation Forecasts of Exponential Smoothing[/C][/ROW]
[ROW][C]t[/C][C]Forecast[/C][C]95% Lower Bound[/C][C]95% Upper Bound[/C][/ROW]
[ROW][C]73[/C][C]520.776912236449[/C][C]504.512843323194[/C][C]537.040981149703[/C][/ROW]
[ROW][C]74[/C][C]517.728502638577[/C][C]494.229076358109[/C][C]541.227928919045[/C][/ROW]
[ROW][C]75[/C][C]510.119883747051[/C][C]480.414482196172[/C][C]539.825285297931[/C][/ROW]
[ROW][C]76[/C][C]499.574685313847[/C][C]464.231949365219[/C][C]534.917421262476[/C][/ROW]
[ROW][C]77[/C][C]488.743325503956[/C][C]448.047011282732[/C][C]529.43963972518[/C][/ROW]
[ROW][C]78[/C][C]491.203303334836[/C][C]444.222961474632[/C][C]538.183645195041[/C][/ROW]
[ROW][C]79[/C][C]546.786284149215[/C][C]488.220833488893[/C][C]605.351734809537[/C][/ROW]
[ROW][C]80[/C][C]556.628819766496[/C][C]490.564551381029[/C][C]622.693088151964[/C][/ROW]
[ROW][C]81[/C][C]550.617506821196[/C][C]478.756947017309[/C][C]622.478066625084[/C][/ROW]
[ROW][C]82[/C][C]536.58131880358[/C][C]460.030384302385[/C][C]613.132253304776[/C][/ROW]
[ROW][C]83[/C][C]518.340686197876[/C][C]437.888717695555[/C][C]598.792654700197[/C][/ROW]
[ROW][C]84[/C][C]521.696250914254[/C][C]429.175056936751[/C][C]614.217444891757[/C][/ROW]
[/TABLE]
Source: https://freestatistics.org/blog/index.php?pk=62588&T=3

Globally Unique Identifier (entire table): ba.freestatistics.org/blog/index.php?pk=62588&T=3

As an alternative you can also use a QR Code:  

The GUIDs for individual cells are displayed in the table below:

Extrapolation Forecasts of Exponential Smoothing
tForecast95% Lower Bound95% Upper Bound
73520.776912236449504.512843323194537.040981149703
74517.728502638577494.229076358109541.227928919045
75510.119883747051480.414482196172539.825285297931
76499.574685313847464.231949365219534.917421262476
77488.743325503956448.047011282732529.43963972518
78491.203303334836444.222961474632538.183645195041
79546.786284149215488.220833488893605.351734809537
80556.628819766496490.564551381029622.693088151964
81550.617506821196478.756947017309622.478066625084
82536.58131880358460.030384302385613.132253304776
83518.340686197876437.888717695555598.792654700197
84521.696250914254429.175056936751614.217444891757


Parameters (Session):
par1 = 12 ; par2 = Triple ; par3 = multiplicative ;
Parameters (R input):
par1 = 12 ; par2 = Triple ; par3 = multiplicative ;
R code (references can be found in the software module):
par1 <- as.numeric(par1)
if (par2 == 'Single') K <- 1
if (par2 == 'Double') K <- 2
if (par2 == 'Triple') K <- par1
nx <- length(x)
nxmK <- nx - K
x <- ts(x, frequency = par1)
if (par2 == 'Single') fit <- HoltWinters(x, gamma=0, beta=0)
if (par2 == 'Double') fit <- HoltWinters(x, gamma=0)
if (par2 == 'Triple') fit <- HoltWinters(x, seasonal=par3)
fit
myresid <- x - fit$fitted[,'xhat']
bitmap(file='test1.png')
op <- par(mfrow=c(2,1))
plot(fit,ylab='Observed (black) / Fitted (red)',main='Interpolation Fit of Exponential Smoothing')
plot(myresid,ylab='Residuals',main='Interpolation Prediction Errors')
par(op)
dev.off()
bitmap(file='test2.png')
p <- predict(fit, par1, prediction.interval=TRUE)
np <- length(p[,1])
plot(fit,p,ylab='Observed (black) / Fitted (red)',main='Extrapolation Fit of Exponential Smoothing')
dev.off()
bitmap(file='test3.png')
op <- par(mfrow = c(2,2))
acf(as.numeric(myresid),lag.max = nx/2,main='Residual ACF')
spectrum(myresid,main='Residals Periodogram')
cpgram(myresid,main='Residal Cumulative Periodogram')
qqnorm(myresid,main='Residual Normal QQ Plot')
qqline(myresid)
par(op)
dev.off()
load(file='createtable')
a<-table.start()
a<-table.row.start(a)
a<-table.element(a,'Estimated Parameters of Exponential Smoothing',2,TRUE)
a<-table.row.end(a)
a<-table.row.start(a)
a<-table.element(a,'Parameter',header=TRUE)
a<-table.element(a,'Value',header=TRUE)
a<-table.row.end(a)
a<-table.row.start(a)
a<-table.element(a,'alpha',header=TRUE)
a<-table.element(a,fit$alpha)
a<-table.row.end(a)
a<-table.row.start(a)
a<-table.element(a,'beta',header=TRUE)
a<-table.element(a,fit$beta)
a<-table.row.end(a)
a<-table.row.start(a)
a<-table.element(a,'gamma',header=TRUE)
a<-table.element(a,fit$gamma)
a<-table.row.end(a)
a<-table.end(a)
table.save(a,file='mytable.tab')
a<-table.start()
a<-table.row.start(a)
a<-table.element(a,'Interpolation Forecasts of Exponential Smoothing',4,TRUE)
a<-table.row.end(a)
a<-table.row.start(a)
a<-table.element(a,'t',header=TRUE)
a<-table.element(a,'Observed',header=TRUE)
a<-table.element(a,'Fitted',header=TRUE)
a<-table.element(a,'Residuals',header=TRUE)
a<-table.row.end(a)
for (i in 1:nxmK) {
a<-table.row.start(a)
a<-table.element(a,i+K,header=TRUE)
a<-table.element(a,x[i+K])
a<-table.element(a,fit$fitted[i,'xhat'])
a<-table.element(a,myresid[i])
a<-table.row.end(a)
}
a<-table.end(a)
table.save(a,file='mytable1.tab')
a<-table.start()
a<-table.row.start(a)
a<-table.element(a,'Extrapolation Forecasts of Exponential Smoothing',4,TRUE)
a<-table.row.end(a)
a<-table.row.start(a)
a<-table.element(a,'t',header=TRUE)
a<-table.element(a,'Forecast',header=TRUE)
a<-table.element(a,'95% Lower Bound',header=TRUE)
a<-table.element(a,'95% Upper Bound',header=TRUE)
a<-table.row.end(a)
for (i in 1:np) {
a<-table.row.start(a)
a<-table.element(a,nx+i,header=TRUE)
a<-table.element(a,p[i,'fit'])
a<-table.element(a,p[i,'lwr'])
a<-table.element(a,p[i,'upr'])
a<-table.row.end(a)
}
a<-table.end(a)
table.save(a,file='mytable2.tab')