Free Statistics

of Irreproducible Research!

Author's title

Author*The author of this computation has been verified*
R Software Modulerwasp_exponentialsmoothing.wasp
Title produced by softwareExponential Smoothing
Date of computationWed, 02 Dec 2009 14:50:49 -0700
Cite this page as followsStatistical Computations at FreeStatistics.org, Office for Research Development and Education, URL https://freestatistics.org/blog/index.php?v=date/2009/Dec/02/t1259790703n9jcszml6488hp5.htm/, Retrieved Sat, 27 Apr 2024 20:35:08 +0000
Statistical Computations at FreeStatistics.org, Office for Research Development and Education, URL https://freestatistics.org/blog/index.php?pk=62605, Retrieved Sat, 27 Apr 2024 20:35:08 +0000
QR Codes:

Original text written by user:
IsPrivate?No (this computation is public)
User-defined keywords
Estimated Impact188
Family? (F = Feedback message, R = changed R code, M = changed R Module, P = changed Parameters, D = changed Data)
-     [Univariate Data Series] [data set] [2008-12-01 19:54:57] [b98453cac15ba1066b407e146608df68]
- RMP   [Exponential Smoothing] [] [2009-11-27 15:04:36] [b98453cac15ba1066b407e146608df68]
-   PD      [Exponential Smoothing] [ws9 exponential s...] [2009-12-02 21:50:49] [ea241b681aafed79da4b5b99fad98471] [Current]
Feedback Forum

Post a new message
Dataseries X:
216234
213587
209465
204045
200237
203666
241476
260307
243324
244460
233575
237217
235243
230354
227184
221678
217142
219452
256446
265845
248624
241114
229245
231805
219277
219313
212610
214771
211142
211457
240048
240636
230580
208795
197922
194596
194581
185686
178106
172608
167302
168053
202300
202388
182516
173476
166444
171297
169701
164182
161914
159612
151001
158114
186530
187069
174330
169362
166827
178037
186412
189226
191563
188906
186005
195309
223532
226899
214126


Summary of computational transaction
Raw Inputview raw input (R code)
Raw Outputview raw output of R engine
Computing time2 seconds
R Server'Gwilym Jenkins' @ 72.249.127.135

\begin{tabular}{lllllllll}
\hline
Summary of computational transaction \tabularnewline
Raw Input & view raw input (R code)  \tabularnewline
Raw Output & view raw output of R engine  \tabularnewline
Computing time & 2 seconds \tabularnewline
R Server & 'Gwilym Jenkins' @ 72.249.127.135 \tabularnewline
\hline
\end{tabular}
%Source: https://freestatistics.org/blog/index.php?pk=62605&T=0

[TABLE]
[ROW][C]Summary of computational transaction[/C][/ROW]
[ROW][C]Raw Input[/C][C]view raw input (R code) [/C][/ROW]
[ROW][C]Raw Output[/C][C]view raw output of R engine [/C][/ROW]
[ROW][C]Computing time[/C][C]2 seconds[/C][/ROW]
[ROW][C]R Server[/C][C]'Gwilym Jenkins' @ 72.249.127.135[/C][/ROW]
[/TABLE]
Source: https://freestatistics.org/blog/index.php?pk=62605&T=0

Globally Unique Identifier (entire table): ba.freestatistics.org/blog/index.php?pk=62605&T=0

As an alternative you can also use a QR Code:  

The GUIDs for individual cells are displayed in the table below:

Summary of computational transaction
Raw Inputview raw input (R code)
Raw Outputview raw output of R engine
Computing time2 seconds
R Server'Gwilym Jenkins' @ 72.249.127.135


Estimated Parameters of Exponential Smoothing
ParameterValue
alpha0.719322263189433
beta0.175883227652681
gamma1

\begin{tabular}{lllllllll}
\hline
Estimated Parameters of Exponential Smoothing \tabularnewline
Parameter & Value \tabularnewline
alpha & 0.719322263189433 \tabularnewline
beta & 0.175883227652681 \tabularnewline
gamma & 1 \tabularnewline
\hline
\end{tabular}
%Source: https://freestatistics.org/blog/index.php?pk=62605&T=1

[TABLE]
[ROW][C]Estimated Parameters of Exponential Smoothing[/C][/ROW]
[ROW][C]Parameter[/C][C]Value[/C][/ROW]
[ROW][C]alpha[/C][C]0.719322263189433[/C][/ROW]
[ROW][C]beta[/C][C]0.175883227652681[/C][/ROW]
[ROW][C]gamma[/C][C]1[/C][/ROW]
[/TABLE]
Source: https://freestatistics.org/blog/index.php?pk=62605&T=1

Globally Unique Identifier (entire table): ba.freestatistics.org/blog/index.php?pk=62605&T=1

As an alternative you can also use a QR Code:  

The GUIDs for individual cells are displayed in the table below:

Estimated Parameters of Exponential Smoothing
ParameterValue
alpha0.719322263189433
beta0.175883227652681
gamma1


Interpolation Forecasts of Exponential Smoothing
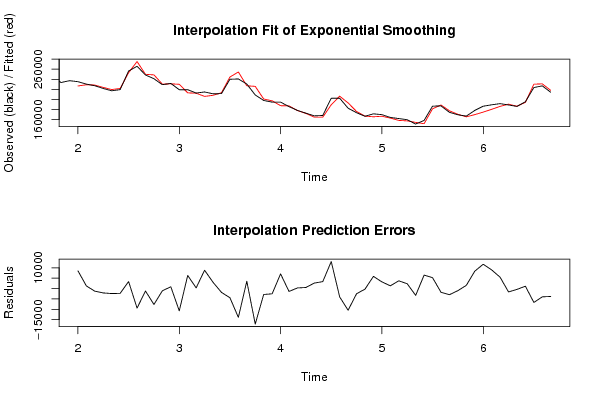
tObservedFittedResiduals
13235243226737.0961736098505.90382639144
14230354229123.6636576791230.33634232086
15227184228466.606944256-1282.60694425550
16221678223800.799736545-2122.79973654507
17217142219569.963404597-2427.96340459693
18219452221777.488382775-2325.48838277528
19256446253078.864927263367.13507274029
20265845275261.348592982-9416.34859298158
21248624249812.961546658-1188.96154665813
22241114248787.113109431-7673.11310943082
23229245230323.758223731-1078.75822373136
24231805230951.619090012853.3809099879
25219277230021.713136055-10744.7131360545
26219313213007.9129497206305.08705027957
27212610212302.915434283307.084565716534
28214771205964.4181599978806.58184000323
29211142208148.3320263152993.66797368464
30211457213328.520399341-1871.52039934113
31240048244474.550451757-4426.55045175678
32240636254512.147891949-13876.147891949
33230580227069.6300962313510.36990376926
34208795225903.193603848-17108.1936038479
35197922200792.922646433-2870.92264643265
36194596197141.523346073-2545.52334607317
37194581187540.0723098687040.9276901315
38185686187093.073748093-1407.07374809266
39178106177822.535574330283.464425669546
40172608172111.618182285496.381817715155
41167302164666.6606126382635.33938736227
42168053164733.291009473319.70899053002
43202300189312.37075327312987.6292467267
44202388206422.384439344-4034.38443934402
45182516192976.209422581-10460.2094225812
46173476176004.181549568-2528.18154956779
47166444166722.951638836-278.951638836093
48171297165447.7946307535849.20536924707
49169701166504.9886842263196.01131577438
50164182162870.4929960471311.50700395295
51161914158194.4231867923719.57681320762
52159612157313.0464267632298.95357323682
53151001154302.302218677-3301.30221867724
54158114151651.0416679996462.9583320012
55186530181293.2368813365236.76311866372
56187069188881.128254835-1812.12825483538
57174330177306.013959189-2976.01395918918
58169362170383.00391962-1021.00391961989
59166827165305.2417372411521.75826275870
60178037169696.5306077718340.46939222876
61186412174725.03604087511686.9639591248
62189226180249.0571876008976.9428124004
63191563186117.3409117415445.65908825921
64188906190545.546284782-1639.54628478200
65186005186419.699256824-414.699256823573
66195309194188.4970802771120.50291972345
67223532230249.192150284-6717.1921502841
68226899230891.317106715-3992.31710671465
69214126217945.224671812-3819.22467181191

\begin{tabular}{lllllllll}
\hline
Interpolation Forecasts of Exponential Smoothing \tabularnewline
t & Observed & Fitted & Residuals \tabularnewline
13 & 235243 & 226737.096173609 & 8505.90382639144 \tabularnewline
14 & 230354 & 229123.663657679 & 1230.33634232086 \tabularnewline
15 & 227184 & 228466.606944256 & -1282.60694425550 \tabularnewline
16 & 221678 & 223800.799736545 & -2122.79973654507 \tabularnewline
17 & 217142 & 219569.963404597 & -2427.96340459693 \tabularnewline
18 & 219452 & 221777.488382775 & -2325.48838277528 \tabularnewline
19 & 256446 & 253078.86492726 & 3367.13507274029 \tabularnewline
20 & 265845 & 275261.348592982 & -9416.34859298158 \tabularnewline
21 & 248624 & 249812.961546658 & -1188.96154665813 \tabularnewline
22 & 241114 & 248787.113109431 & -7673.11310943082 \tabularnewline
23 & 229245 & 230323.758223731 & -1078.75822373136 \tabularnewline
24 & 231805 & 230951.619090012 & 853.3809099879 \tabularnewline
25 & 219277 & 230021.713136055 & -10744.7131360545 \tabularnewline
26 & 219313 & 213007.912949720 & 6305.08705027957 \tabularnewline
27 & 212610 & 212302.915434283 & 307.084565716534 \tabularnewline
28 & 214771 & 205964.418159997 & 8806.58184000323 \tabularnewline
29 & 211142 & 208148.332026315 & 2993.66797368464 \tabularnewline
30 & 211457 & 213328.520399341 & -1871.52039934113 \tabularnewline
31 & 240048 & 244474.550451757 & -4426.55045175678 \tabularnewline
32 & 240636 & 254512.147891949 & -13876.147891949 \tabularnewline
33 & 230580 & 227069.630096231 & 3510.36990376926 \tabularnewline
34 & 208795 & 225903.193603848 & -17108.1936038479 \tabularnewline
35 & 197922 & 200792.922646433 & -2870.92264643265 \tabularnewline
36 & 194596 & 197141.523346073 & -2545.52334607317 \tabularnewline
37 & 194581 & 187540.072309868 & 7040.9276901315 \tabularnewline
38 & 185686 & 187093.073748093 & -1407.07374809266 \tabularnewline
39 & 178106 & 177822.535574330 & 283.464425669546 \tabularnewline
40 & 172608 & 172111.618182285 & 496.381817715155 \tabularnewline
41 & 167302 & 164666.660612638 & 2635.33938736227 \tabularnewline
42 & 168053 & 164733.29100947 & 3319.70899053002 \tabularnewline
43 & 202300 & 189312.370753273 & 12987.6292467267 \tabularnewline
44 & 202388 & 206422.384439344 & -4034.38443934402 \tabularnewline
45 & 182516 & 192976.209422581 & -10460.2094225812 \tabularnewline
46 & 173476 & 176004.181549568 & -2528.18154956779 \tabularnewline
47 & 166444 & 166722.951638836 & -278.951638836093 \tabularnewline
48 & 171297 & 165447.794630753 & 5849.20536924707 \tabularnewline
49 & 169701 & 166504.988684226 & 3196.01131577438 \tabularnewline
50 & 164182 & 162870.492996047 & 1311.50700395295 \tabularnewline
51 & 161914 & 158194.423186792 & 3719.57681320762 \tabularnewline
52 & 159612 & 157313.046426763 & 2298.95357323682 \tabularnewline
53 & 151001 & 154302.302218677 & -3301.30221867724 \tabularnewline
54 & 158114 & 151651.041667999 & 6462.9583320012 \tabularnewline
55 & 186530 & 181293.236881336 & 5236.76311866372 \tabularnewline
56 & 187069 & 188881.128254835 & -1812.12825483538 \tabularnewline
57 & 174330 & 177306.013959189 & -2976.01395918918 \tabularnewline
58 & 169362 & 170383.00391962 & -1021.00391961989 \tabularnewline
59 & 166827 & 165305.241737241 & 1521.75826275870 \tabularnewline
60 & 178037 & 169696.530607771 & 8340.46939222876 \tabularnewline
61 & 186412 & 174725.036040875 & 11686.9639591248 \tabularnewline
62 & 189226 & 180249.057187600 & 8976.9428124004 \tabularnewline
63 & 191563 & 186117.340911741 & 5445.65908825921 \tabularnewline
64 & 188906 & 190545.546284782 & -1639.54628478200 \tabularnewline
65 & 186005 & 186419.699256824 & -414.699256823573 \tabularnewline
66 & 195309 & 194188.497080277 & 1120.50291972345 \tabularnewline
67 & 223532 & 230249.192150284 & -6717.1921502841 \tabularnewline
68 & 226899 & 230891.317106715 & -3992.31710671465 \tabularnewline
69 & 214126 & 217945.224671812 & -3819.22467181191 \tabularnewline
\hline
\end{tabular}
%Source: https://freestatistics.org/blog/index.php?pk=62605&T=2

[TABLE]
[ROW][C]Interpolation Forecasts of Exponential Smoothing[/C][/ROW]
[ROW][C]t[/C][C]Observed[/C][C]Fitted[/C][C]Residuals[/C][/ROW]
[ROW][C]13[/C][C]235243[/C][C]226737.096173609[/C][C]8505.90382639144[/C][/ROW]
[ROW][C]14[/C][C]230354[/C][C]229123.663657679[/C][C]1230.33634232086[/C][/ROW]
[ROW][C]15[/C][C]227184[/C][C]228466.606944256[/C][C]-1282.60694425550[/C][/ROW]
[ROW][C]16[/C][C]221678[/C][C]223800.799736545[/C][C]-2122.79973654507[/C][/ROW]
[ROW][C]17[/C][C]217142[/C][C]219569.963404597[/C][C]-2427.96340459693[/C][/ROW]
[ROW][C]18[/C][C]219452[/C][C]221777.488382775[/C][C]-2325.48838277528[/C][/ROW]
[ROW][C]19[/C][C]256446[/C][C]253078.86492726[/C][C]3367.13507274029[/C][/ROW]
[ROW][C]20[/C][C]265845[/C][C]275261.348592982[/C][C]-9416.34859298158[/C][/ROW]
[ROW][C]21[/C][C]248624[/C][C]249812.961546658[/C][C]-1188.96154665813[/C][/ROW]
[ROW][C]22[/C][C]241114[/C][C]248787.113109431[/C][C]-7673.11310943082[/C][/ROW]
[ROW][C]23[/C][C]229245[/C][C]230323.758223731[/C][C]-1078.75822373136[/C][/ROW]
[ROW][C]24[/C][C]231805[/C][C]230951.619090012[/C][C]853.3809099879[/C][/ROW]
[ROW][C]25[/C][C]219277[/C][C]230021.713136055[/C][C]-10744.7131360545[/C][/ROW]
[ROW][C]26[/C][C]219313[/C][C]213007.912949720[/C][C]6305.08705027957[/C][/ROW]
[ROW][C]27[/C][C]212610[/C][C]212302.915434283[/C][C]307.084565716534[/C][/ROW]
[ROW][C]28[/C][C]214771[/C][C]205964.418159997[/C][C]8806.58184000323[/C][/ROW]
[ROW][C]29[/C][C]211142[/C][C]208148.332026315[/C][C]2993.66797368464[/C][/ROW]
[ROW][C]30[/C][C]211457[/C][C]213328.520399341[/C][C]-1871.52039934113[/C][/ROW]
[ROW][C]31[/C][C]240048[/C][C]244474.550451757[/C][C]-4426.55045175678[/C][/ROW]
[ROW][C]32[/C][C]240636[/C][C]254512.147891949[/C][C]-13876.147891949[/C][/ROW]
[ROW][C]33[/C][C]230580[/C][C]227069.630096231[/C][C]3510.36990376926[/C][/ROW]
[ROW][C]34[/C][C]208795[/C][C]225903.193603848[/C][C]-17108.1936038479[/C][/ROW]
[ROW][C]35[/C][C]197922[/C][C]200792.922646433[/C][C]-2870.92264643265[/C][/ROW]
[ROW][C]36[/C][C]194596[/C][C]197141.523346073[/C][C]-2545.52334607317[/C][/ROW]
[ROW][C]37[/C][C]194581[/C][C]187540.072309868[/C][C]7040.9276901315[/C][/ROW]
[ROW][C]38[/C][C]185686[/C][C]187093.073748093[/C][C]-1407.07374809266[/C][/ROW]
[ROW][C]39[/C][C]178106[/C][C]177822.535574330[/C][C]283.464425669546[/C][/ROW]
[ROW][C]40[/C][C]172608[/C][C]172111.618182285[/C][C]496.381817715155[/C][/ROW]
[ROW][C]41[/C][C]167302[/C][C]164666.660612638[/C][C]2635.33938736227[/C][/ROW]
[ROW][C]42[/C][C]168053[/C][C]164733.29100947[/C][C]3319.70899053002[/C][/ROW]
[ROW][C]43[/C][C]202300[/C][C]189312.370753273[/C][C]12987.6292467267[/C][/ROW]
[ROW][C]44[/C][C]202388[/C][C]206422.384439344[/C][C]-4034.38443934402[/C][/ROW]
[ROW][C]45[/C][C]182516[/C][C]192976.209422581[/C][C]-10460.2094225812[/C][/ROW]
[ROW][C]46[/C][C]173476[/C][C]176004.181549568[/C][C]-2528.18154956779[/C][/ROW]
[ROW][C]47[/C][C]166444[/C][C]166722.951638836[/C][C]-278.951638836093[/C][/ROW]
[ROW][C]48[/C][C]171297[/C][C]165447.794630753[/C][C]5849.20536924707[/C][/ROW]
[ROW][C]49[/C][C]169701[/C][C]166504.988684226[/C][C]3196.01131577438[/C][/ROW]
[ROW][C]50[/C][C]164182[/C][C]162870.492996047[/C][C]1311.50700395295[/C][/ROW]
[ROW][C]51[/C][C]161914[/C][C]158194.423186792[/C][C]3719.57681320762[/C][/ROW]
[ROW][C]52[/C][C]159612[/C][C]157313.046426763[/C][C]2298.95357323682[/C][/ROW]
[ROW][C]53[/C][C]151001[/C][C]154302.302218677[/C][C]-3301.30221867724[/C][/ROW]
[ROW][C]54[/C][C]158114[/C][C]151651.041667999[/C][C]6462.9583320012[/C][/ROW]
[ROW][C]55[/C][C]186530[/C][C]181293.236881336[/C][C]5236.76311866372[/C][/ROW]
[ROW][C]56[/C][C]187069[/C][C]188881.128254835[/C][C]-1812.12825483538[/C][/ROW]
[ROW][C]57[/C][C]174330[/C][C]177306.013959189[/C][C]-2976.01395918918[/C][/ROW]
[ROW][C]58[/C][C]169362[/C][C]170383.00391962[/C][C]-1021.00391961989[/C][/ROW]
[ROW][C]59[/C][C]166827[/C][C]165305.241737241[/C][C]1521.75826275870[/C][/ROW]
[ROW][C]60[/C][C]178037[/C][C]169696.530607771[/C][C]8340.46939222876[/C][/ROW]
[ROW][C]61[/C][C]186412[/C][C]174725.036040875[/C][C]11686.9639591248[/C][/ROW]
[ROW][C]62[/C][C]189226[/C][C]180249.057187600[/C][C]8976.9428124004[/C][/ROW]
[ROW][C]63[/C][C]191563[/C][C]186117.340911741[/C][C]5445.65908825921[/C][/ROW]
[ROW][C]64[/C][C]188906[/C][C]190545.546284782[/C][C]-1639.54628478200[/C][/ROW]
[ROW][C]65[/C][C]186005[/C][C]186419.699256824[/C][C]-414.699256823573[/C][/ROW]
[ROW][C]66[/C][C]195309[/C][C]194188.497080277[/C][C]1120.50291972345[/C][/ROW]
[ROW][C]67[/C][C]223532[/C][C]230249.192150284[/C][C]-6717.1921502841[/C][/ROW]
[ROW][C]68[/C][C]226899[/C][C]230891.317106715[/C][C]-3992.31710671465[/C][/ROW]
[ROW][C]69[/C][C]214126[/C][C]217945.224671812[/C][C]-3819.22467181191[/C][/ROW]
[/TABLE]
Source: https://freestatistics.org/blog/index.php?pk=62605&T=2

Globally Unique Identifier (entire table): ba.freestatistics.org/blog/index.php?pk=62605&T=2

As an alternative you can also use a QR Code:  

The GUIDs for individual cells are displayed in the table below:

Interpolation Forecasts of Exponential Smoothing
tObservedFittedResiduals
13235243226737.0961736098505.90382639144
14230354229123.6636576791230.33634232086
15227184228466.606944256-1282.60694425550
16221678223800.799736545-2122.79973654507
17217142219569.963404597-2427.96340459693
18219452221777.488382775-2325.48838277528
19256446253078.864927263367.13507274029
20265845275261.348592982-9416.34859298158
21248624249812.961546658-1188.96154665813
22241114248787.113109431-7673.11310943082
23229245230323.758223731-1078.75822373136
24231805230951.619090012853.3809099879
25219277230021.713136055-10744.7131360545
26219313213007.9129497206305.08705027957
27212610212302.915434283307.084565716534
28214771205964.4181599978806.58184000323
29211142208148.3320263152993.66797368464
30211457213328.520399341-1871.52039934113
31240048244474.550451757-4426.55045175678
32240636254512.147891949-13876.147891949
33230580227069.6300962313510.36990376926
34208795225903.193603848-17108.1936038479
35197922200792.922646433-2870.92264643265
36194596197141.523346073-2545.52334607317
37194581187540.0723098687040.9276901315
38185686187093.073748093-1407.07374809266
39178106177822.535574330283.464425669546
40172608172111.618182285496.381817715155
41167302164666.6606126382635.33938736227
42168053164733.291009473319.70899053002
43202300189312.37075327312987.6292467267
44202388206422.384439344-4034.38443934402
45182516192976.209422581-10460.2094225812
46173476176004.181549568-2528.18154956779
47166444166722.951638836-278.951638836093
48171297165447.7946307535849.20536924707
49169701166504.9886842263196.01131577438
50164182162870.4929960471311.50700395295
51161914158194.4231867923719.57681320762
52159612157313.0464267632298.95357323682
53151001154302.302218677-3301.30221867724
54158114151651.0416679996462.9583320012
55186530181293.2368813365236.76311866372
56187069188881.128254835-1812.12825483538
57174330177306.013959189-2976.01395918918
58169362170383.00391962-1021.00391961989
59166827165305.2417372411521.75826275870
60178037169696.5306077718340.46939222876
61186412174725.03604087511686.9639591248
62189226180249.0571876008976.9428124004
63191563186117.3409117415445.65908825921
64188906190545.546284782-1639.54628478200
65186005186419.699256824-414.699256823573
66195309194188.4970802771120.50291972345
67223532230249.192150284-6717.1921502841
68226899230891.317106715-3992.31710671465
69214126217945.224671812-3819.22467181191


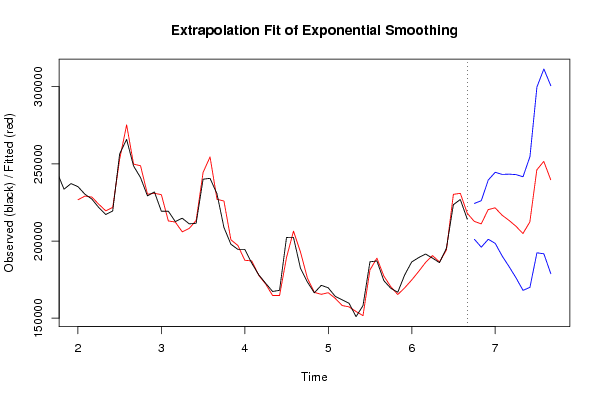
Extrapolation Forecasts of Exponential Smoothing
tForecast95% Lower Bound95% Upper Bound
70212749.177448599201158.928045624224339.426851573
71211087.295561823196017.170010025226157.421113621
72220331.805448108201147.479503513239516.131392704
73221516.021217242198492.334928469244539.707506015
74216743.438960666190321.804979516243165.072941816
75213364.77811028183397.841609235243331.714611325
76209566.740699672176100.354199004243033.12720034
77204836.148573866168029.552205537241642.744942196
78212386.963886877170027.002367126254746.925406628
79246091.041662252192384.317915784299797.765408720
80251602.164189145191711.285210845311493.043167446
81239704.508944503178808.146533843300600.871355164

\begin{tabular}{lllllllll}
\hline
Extrapolation Forecasts of Exponential Smoothing \tabularnewline
t & Forecast & 95% Lower Bound & 95% Upper Bound \tabularnewline
70 & 212749.177448599 & 201158.928045624 & 224339.426851573 \tabularnewline
71 & 211087.295561823 & 196017.170010025 & 226157.421113621 \tabularnewline
72 & 220331.805448108 & 201147.479503513 & 239516.131392704 \tabularnewline
73 & 221516.021217242 & 198492.334928469 & 244539.707506015 \tabularnewline
74 & 216743.438960666 & 190321.804979516 & 243165.072941816 \tabularnewline
75 & 213364.77811028 & 183397.841609235 & 243331.714611325 \tabularnewline
76 & 209566.740699672 & 176100.354199004 & 243033.12720034 \tabularnewline
77 & 204836.148573866 & 168029.552205537 & 241642.744942196 \tabularnewline
78 & 212386.963886877 & 170027.002367126 & 254746.925406628 \tabularnewline
79 & 246091.041662252 & 192384.317915784 & 299797.765408720 \tabularnewline
80 & 251602.164189145 & 191711.285210845 & 311493.043167446 \tabularnewline
81 & 239704.508944503 & 178808.146533843 & 300600.871355164 \tabularnewline
\hline
\end{tabular}
%Source: https://freestatistics.org/blog/index.php?pk=62605&T=3

[TABLE]
[ROW][C]Extrapolation Forecasts of Exponential Smoothing[/C][/ROW]
[ROW][C]t[/C][C]Forecast[/C][C]95% Lower Bound[/C][C]95% Upper Bound[/C][/ROW]
[ROW][C]70[/C][C]212749.177448599[/C][C]201158.928045624[/C][C]224339.426851573[/C][/ROW]
[ROW][C]71[/C][C]211087.295561823[/C][C]196017.170010025[/C][C]226157.421113621[/C][/ROW]
[ROW][C]72[/C][C]220331.805448108[/C][C]201147.479503513[/C][C]239516.131392704[/C][/ROW]
[ROW][C]73[/C][C]221516.021217242[/C][C]198492.334928469[/C][C]244539.707506015[/C][/ROW]
[ROW][C]74[/C][C]216743.438960666[/C][C]190321.804979516[/C][C]243165.072941816[/C][/ROW]
[ROW][C]75[/C][C]213364.77811028[/C][C]183397.841609235[/C][C]243331.714611325[/C][/ROW]
[ROW][C]76[/C][C]209566.740699672[/C][C]176100.354199004[/C][C]243033.12720034[/C][/ROW]
[ROW][C]77[/C][C]204836.148573866[/C][C]168029.552205537[/C][C]241642.744942196[/C][/ROW]
[ROW][C]78[/C][C]212386.963886877[/C][C]170027.002367126[/C][C]254746.925406628[/C][/ROW]
[ROW][C]79[/C][C]246091.041662252[/C][C]192384.317915784[/C][C]299797.765408720[/C][/ROW]
[ROW][C]80[/C][C]251602.164189145[/C][C]191711.285210845[/C][C]311493.043167446[/C][/ROW]
[ROW][C]81[/C][C]239704.508944503[/C][C]178808.146533843[/C][C]300600.871355164[/C][/ROW]
[/TABLE]
Source: https://freestatistics.org/blog/index.php?pk=62605&T=3

Globally Unique Identifier (entire table): ba.freestatistics.org/blog/index.php?pk=62605&T=3

As an alternative you can also use a QR Code:  

The GUIDs for individual cells are displayed in the table below:

Extrapolation Forecasts of Exponential Smoothing
tForecast95% Lower Bound95% Upper Bound
70212749.177448599201158.928045624224339.426851573
71211087.295561823196017.170010025226157.421113621
72220331.805448108201147.479503513239516.131392704
73221516.021217242198492.334928469244539.707506015
74216743.438960666190321.804979516243165.072941816
75213364.77811028183397.841609235243331.714611325
76209566.740699672176100.354199004243033.12720034
77204836.148573866168029.552205537241642.744942196
78212386.963886877170027.002367126254746.925406628
79246091.041662252192384.317915784299797.765408720
80251602.164189145191711.285210845311493.043167446
81239704.508944503178808.146533843300600.871355164


Parameters (Session):
par1 = 12 ;
Parameters (R input):
par1 = 12 ; par2 = Triple ; par3 = multiplicative ;
R code (references can be found in the software module):
par1 <- as.numeric(par1)
if (par2 == 'Single') K <- 1
if (par2 == 'Double') K <- 2
if (par2 == 'Triple') K <- par1
nx <- length(x)
nxmK <- nx - K
x <- ts(x, frequency = par1)
if (par2 == 'Single') fit <- HoltWinters(x, gamma=0, beta=0)
if (par2 == 'Double') fit <- HoltWinters(x, gamma=0)
if (par2 == 'Triple') fit <- HoltWinters(x, seasonal=par3)
fit
myresid <- x - fit$fitted[,'xhat']
bitmap(file='test1.png')
op <- par(mfrow=c(2,1))
plot(fit,ylab='Observed (black) / Fitted (red)',main='Interpolation Fit of Exponential Smoothing')
plot(myresid,ylab='Residuals',main='Interpolation Prediction Errors')
par(op)
dev.off()
bitmap(file='test2.png')
p <- predict(fit, par1, prediction.interval=TRUE)
np <- length(p[,1])
plot(fit,p,ylab='Observed (black) / Fitted (red)',main='Extrapolation Fit of Exponential Smoothing')
dev.off()
bitmap(file='test3.png')
op <- par(mfrow = c(2,2))
acf(as.numeric(myresid),lag.max = nx/2,main='Residual ACF')
spectrum(myresid,main='Residals Periodogram')
cpgram(myresid,main='Residal Cumulative Periodogram')
qqnorm(myresid,main='Residual Normal QQ Plot')
qqline(myresid)
par(op)
dev.off()
load(file='createtable')
a<-table.start()
a<-table.row.start(a)
a<-table.element(a,'Estimated Parameters of Exponential Smoothing',2,TRUE)
a<-table.row.end(a)
a<-table.row.start(a)
a<-table.element(a,'Parameter',header=TRUE)
a<-table.element(a,'Value',header=TRUE)
a<-table.row.end(a)
a<-table.row.start(a)
a<-table.element(a,'alpha',header=TRUE)
a<-table.element(a,fit$alpha)
a<-table.row.end(a)
a<-table.row.start(a)
a<-table.element(a,'beta',header=TRUE)
a<-table.element(a,fit$beta)
a<-table.row.end(a)
a<-table.row.start(a)
a<-table.element(a,'gamma',header=TRUE)
a<-table.element(a,fit$gamma)
a<-table.row.end(a)
a<-table.end(a)
table.save(a,file='mytable.tab')
a<-table.start()
a<-table.row.start(a)
a<-table.element(a,'Interpolation Forecasts of Exponential Smoothing',4,TRUE)
a<-table.row.end(a)
a<-table.row.start(a)
a<-table.element(a,'t',header=TRUE)
a<-table.element(a,'Observed',header=TRUE)
a<-table.element(a,'Fitted',header=TRUE)
a<-table.element(a,'Residuals',header=TRUE)
a<-table.row.end(a)
for (i in 1:nxmK) {
a<-table.row.start(a)
a<-table.element(a,i+K,header=TRUE)
a<-table.element(a,x[i+K])
a<-table.element(a,fit$fitted[i,'xhat'])
a<-table.element(a,myresid[i])
a<-table.row.end(a)
}
a<-table.end(a)
table.save(a,file='mytable1.tab')
a<-table.start()
a<-table.row.start(a)
a<-table.element(a,'Extrapolation Forecasts of Exponential Smoothing',4,TRUE)
a<-table.row.end(a)
a<-table.row.start(a)
a<-table.element(a,'t',header=TRUE)
a<-table.element(a,'Forecast',header=TRUE)
a<-table.element(a,'95% Lower Bound',header=TRUE)
a<-table.element(a,'95% Upper Bound',header=TRUE)
a<-table.row.end(a)
for (i in 1:np) {
a<-table.row.start(a)
a<-table.element(a,nx+i,header=TRUE)
a<-table.element(a,p[i,'fit'])
a<-table.element(a,p[i,'lwr'])
a<-table.element(a,p[i,'upr'])
a<-table.row.end(a)
}
a<-table.end(a)
table.save(a,file='mytable2.tab')