Free Statistics

of Irreproducible Research!

Author's title

Author*The author of this computation has been verified*
R Software Modulerwasp_autocorrelation.wasp
Title produced by software(Partial) Autocorrelation Function
Date of computationThu, 03 Dec 2009 10:04:44 -0700
Cite this page as followsStatistical Computations at FreeStatistics.org, Office for Research Development and Education, URL https://freestatistics.org/blog/index.php?v=date/2009/Dec/03/t1259859970d9z68zhu8imixqy.htm/, Retrieved Fri, 26 Apr 2024 22:28:15 +0000
Statistical Computations at FreeStatistics.org, Office for Research Development and Education, URL https://freestatistics.org/blog/index.php?pk=62925, Retrieved Fri, 26 Apr 2024 22:28:15 +0000
QR Codes:

Original text written by user:
IsPrivate?No (this computation is public)
User-defined keywords
Estimated Impact99
Family? (F = Feedback message, R = changed R code, M = changed R Module, P = changed Parameters, D = changed Data)
-       [(Partial) Autocorrelation Function] [ACF 2] [2009-12-03 17:04:44] [e458b4e05bf28a297f8af8d9f96e59d6] [Current]
Feedback Forum

Post a new message
Dataseries X:
96.2
96.8
109.9
88
91.1
106.4
68.6
100.1
108
106
108.6
91.5
99.2
98
96.6
102.8
96.9
110
70.5
101.9
109.6
107.8
113
93.8
108
102.8
116.3
89.2
106.7
112.1
74.2
108.8
111.5
118.8
118.9
97.6
116.4
107.9
121.2
97.9
113.4
117.6
79.6
115.9
115.7
129.1
123.3
96.7
121.2
118.2
102.1
125.4
116.7
121.3
85.3
114.2
124.4
131
118.3
99.6


Summary of computational transaction
Raw Inputview raw input (R code)
Raw Outputview raw output of R engine
Computing time1 seconds
R Server'Gwilym Jenkins' @ 72.249.127.135

\begin{tabular}{lllllllll}
\hline
Summary of computational transaction \tabularnewline
Raw Input & view raw input (R code)  \tabularnewline
Raw Output & view raw output of R engine  \tabularnewline
Computing time & 1 seconds \tabularnewline
R Server & 'Gwilym Jenkins' @ 72.249.127.135 \tabularnewline
\hline
\end{tabular}
%Source: https://freestatistics.org/blog/index.php?pk=62925&T=0

[TABLE]
[ROW][C]Summary of computational transaction[/C][/ROW]
[ROW][C]Raw Input[/C][C]view raw input (R code) [/C][/ROW]
[ROW][C]Raw Output[/C][C]view raw output of R engine [/C][/ROW]
[ROW][C]Computing time[/C][C]1 seconds[/C][/ROW]
[ROW][C]R Server[/C][C]'Gwilym Jenkins' @ 72.249.127.135[/C][/ROW]
[/TABLE]
Source: https://freestatistics.org/blog/index.php?pk=62925&T=0

Globally Unique Identifier (entire table): ba.freestatistics.org/blog/index.php?pk=62925&T=0

As an alternative you can also use a QR Code:  

The GUIDs for individual cells are displayed in the table below:

Summary of computational transaction
Raw Inputview raw input (R code)
Raw Outputview raw output of R engine
Computing time1 seconds
R Server'Gwilym Jenkins' @ 72.249.127.135


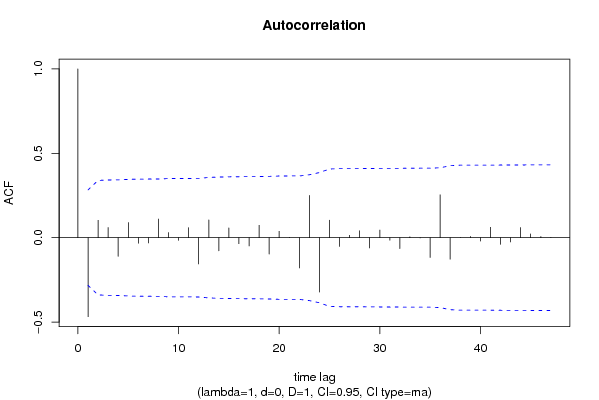
Autocorrelation Function
Time lag kACF(k)T-STATP-value
1-0.468068-3.24290.001078
20.102840.71250.239804
30.0597230.41380.340441
4-0.110671-0.76680.223492
50.0895410.62040.268978
6-0.032656-0.22620.410984
7-0.030946-0.21440.41557
80.1101860.76340.224482
90.0301130.20860.41781
10-0.015397-0.10670.457747
110.0595140.41230.340968
12-0.155453-1.0770.143429
130.1048620.72650.235528
14-0.078151-0.54140.295353
150.057640.39930.345706
16-0.035977-0.24930.402112
17-0.04902-0.33960.367811
180.0733230.5080.306892
19-0.09725-0.67380.251846
200.038030.26350.396656
210.001480.01030.495931
22-0.179669-1.24480.109627
230.2504751.73530.044549
24-0.32237-2.23340.015108
250.1035320.71730.238337
26-0.052096-0.36090.359868
270.0137010.09490.462384
280.0403880.27980.390411
29-0.060716-0.42070.337942
300.0452840.31370.37754
31-0.014979-0.10380.458889
32-0.06457-0.44740.328317
330.0049790.03450.486312
34-0.001295-0.0090.49644
35-0.116785-0.80910.211221
360.2541971.76110.042293
37-0.127694-0.88470.190368
388.9e-056e-040.499756
390.0074860.05190.479425
40-0.019898-0.13790.445466
410.0611230.42350.336921
42-0.039062-0.27060.393917
43-0.025031-0.17340.431524
440.0596110.4130.340724
450.0224070.15520.43864
460.006510.04510.482107
470.0007220.0050.498015
48NANANA
49NANANA
50NANANA
51NANANA
52NANANA
53NANANA
54NANANA
55NANANA
56NANANA
57NANANA
58NANANA
59NANANA
60NANANA

\begin{tabular}{lllllllll}
\hline
Autocorrelation Function \tabularnewline
Time lag k & ACF(k) & T-STAT & P-value \tabularnewline
1 & -0.468068 & -3.2429 & 0.001078 \tabularnewline
2 & 0.10284 & 0.7125 & 0.239804 \tabularnewline
3 & 0.059723 & 0.4138 & 0.340441 \tabularnewline
4 & -0.110671 & -0.7668 & 0.223492 \tabularnewline
5 & 0.089541 & 0.6204 & 0.268978 \tabularnewline
6 & -0.032656 & -0.2262 & 0.410984 \tabularnewline
7 & -0.030946 & -0.2144 & 0.41557 \tabularnewline
8 & 0.110186 & 0.7634 & 0.224482 \tabularnewline
9 & 0.030113 & 0.2086 & 0.41781 \tabularnewline
10 & -0.015397 & -0.1067 & 0.457747 \tabularnewline
11 & 0.059514 & 0.4123 & 0.340968 \tabularnewline
12 & -0.155453 & -1.077 & 0.143429 \tabularnewline
13 & 0.104862 & 0.7265 & 0.235528 \tabularnewline
14 & -0.078151 & -0.5414 & 0.295353 \tabularnewline
15 & 0.05764 & 0.3993 & 0.345706 \tabularnewline
16 & -0.035977 & -0.2493 & 0.402112 \tabularnewline
17 & -0.04902 & -0.3396 & 0.367811 \tabularnewline
18 & 0.073323 & 0.508 & 0.306892 \tabularnewline
19 & -0.09725 & -0.6738 & 0.251846 \tabularnewline
20 & 0.03803 & 0.2635 & 0.396656 \tabularnewline
21 & 0.00148 & 0.0103 & 0.495931 \tabularnewline
22 & -0.179669 & -1.2448 & 0.109627 \tabularnewline
23 & 0.250475 & 1.7353 & 0.044549 \tabularnewline
24 & -0.32237 & -2.2334 & 0.015108 \tabularnewline
25 & 0.103532 & 0.7173 & 0.238337 \tabularnewline
26 & -0.052096 & -0.3609 & 0.359868 \tabularnewline
27 & 0.013701 & 0.0949 & 0.462384 \tabularnewline
28 & 0.040388 & 0.2798 & 0.390411 \tabularnewline
29 & -0.060716 & -0.4207 & 0.337942 \tabularnewline
30 & 0.045284 & 0.3137 & 0.37754 \tabularnewline
31 & -0.014979 & -0.1038 & 0.458889 \tabularnewline
32 & -0.06457 & -0.4474 & 0.328317 \tabularnewline
33 & 0.004979 & 0.0345 & 0.486312 \tabularnewline
34 & -0.001295 & -0.009 & 0.49644 \tabularnewline
35 & -0.116785 & -0.8091 & 0.211221 \tabularnewline
36 & 0.254197 & 1.7611 & 0.042293 \tabularnewline
37 & -0.127694 & -0.8847 & 0.190368 \tabularnewline
38 & 8.9e-05 & 6e-04 & 0.499756 \tabularnewline
39 & 0.007486 & 0.0519 & 0.479425 \tabularnewline
40 & -0.019898 & -0.1379 & 0.445466 \tabularnewline
41 & 0.061123 & 0.4235 & 0.336921 \tabularnewline
42 & -0.039062 & -0.2706 & 0.393917 \tabularnewline
43 & -0.025031 & -0.1734 & 0.431524 \tabularnewline
44 & 0.059611 & 0.413 & 0.340724 \tabularnewline
45 & 0.022407 & 0.1552 & 0.43864 \tabularnewline
46 & 0.00651 & 0.0451 & 0.482107 \tabularnewline
47 & 0.000722 & 0.005 & 0.498015 \tabularnewline
48 & NA & NA & NA \tabularnewline
49 & NA & NA & NA \tabularnewline
50 & NA & NA & NA \tabularnewline
51 & NA & NA & NA \tabularnewline
52 & NA & NA & NA \tabularnewline
53 & NA & NA & NA \tabularnewline
54 & NA & NA & NA \tabularnewline
55 & NA & NA & NA \tabularnewline
56 & NA & NA & NA \tabularnewline
57 & NA & NA & NA \tabularnewline
58 & NA & NA & NA \tabularnewline
59 & NA & NA & NA \tabularnewline
60 & NA & NA & NA \tabularnewline
\hline
\end{tabular}
%Source: https://freestatistics.org/blog/index.php?pk=62925&T=1

[TABLE]
[ROW][C]Autocorrelation Function[/C][/ROW]
[ROW][C]Time lag k[/C][C]ACF(k)[/C][C]T-STAT[/C][C]P-value[/C][/ROW]
[ROW][C]1[/C][C]-0.468068[/C][C]-3.2429[/C][C]0.001078[/C][/ROW]
[ROW][C]2[/C][C]0.10284[/C][C]0.7125[/C][C]0.239804[/C][/ROW]
[ROW][C]3[/C][C]0.059723[/C][C]0.4138[/C][C]0.340441[/C][/ROW]
[ROW][C]4[/C][C]-0.110671[/C][C]-0.7668[/C][C]0.223492[/C][/ROW]
[ROW][C]5[/C][C]0.089541[/C][C]0.6204[/C][C]0.268978[/C][/ROW]
[ROW][C]6[/C][C]-0.032656[/C][C]-0.2262[/C][C]0.410984[/C][/ROW]
[ROW][C]7[/C][C]-0.030946[/C][C]-0.2144[/C][C]0.41557[/C][/ROW]
[ROW][C]8[/C][C]0.110186[/C][C]0.7634[/C][C]0.224482[/C][/ROW]
[ROW][C]9[/C][C]0.030113[/C][C]0.2086[/C][C]0.41781[/C][/ROW]
[ROW][C]10[/C][C]-0.015397[/C][C]-0.1067[/C][C]0.457747[/C][/ROW]
[ROW][C]11[/C][C]0.059514[/C][C]0.4123[/C][C]0.340968[/C][/ROW]
[ROW][C]12[/C][C]-0.155453[/C][C]-1.077[/C][C]0.143429[/C][/ROW]
[ROW][C]13[/C][C]0.104862[/C][C]0.7265[/C][C]0.235528[/C][/ROW]
[ROW][C]14[/C][C]-0.078151[/C][C]-0.5414[/C][C]0.295353[/C][/ROW]
[ROW][C]15[/C][C]0.05764[/C][C]0.3993[/C][C]0.345706[/C][/ROW]
[ROW][C]16[/C][C]-0.035977[/C][C]-0.2493[/C][C]0.402112[/C][/ROW]
[ROW][C]17[/C][C]-0.04902[/C][C]-0.3396[/C][C]0.367811[/C][/ROW]
[ROW][C]18[/C][C]0.073323[/C][C]0.508[/C][C]0.306892[/C][/ROW]
[ROW][C]19[/C][C]-0.09725[/C][C]-0.6738[/C][C]0.251846[/C][/ROW]
[ROW][C]20[/C][C]0.03803[/C][C]0.2635[/C][C]0.396656[/C][/ROW]
[ROW][C]21[/C][C]0.00148[/C][C]0.0103[/C][C]0.495931[/C][/ROW]
[ROW][C]22[/C][C]-0.179669[/C][C]-1.2448[/C][C]0.109627[/C][/ROW]
[ROW][C]23[/C][C]0.250475[/C][C]1.7353[/C][C]0.044549[/C][/ROW]
[ROW][C]24[/C][C]-0.32237[/C][C]-2.2334[/C][C]0.015108[/C][/ROW]
[ROW][C]25[/C][C]0.103532[/C][C]0.7173[/C][C]0.238337[/C][/ROW]
[ROW][C]26[/C][C]-0.052096[/C][C]-0.3609[/C][C]0.359868[/C][/ROW]
[ROW][C]27[/C][C]0.013701[/C][C]0.0949[/C][C]0.462384[/C][/ROW]
[ROW][C]28[/C][C]0.040388[/C][C]0.2798[/C][C]0.390411[/C][/ROW]
[ROW][C]29[/C][C]-0.060716[/C][C]-0.4207[/C][C]0.337942[/C][/ROW]
[ROW][C]30[/C][C]0.045284[/C][C]0.3137[/C][C]0.37754[/C][/ROW]
[ROW][C]31[/C][C]-0.014979[/C][C]-0.1038[/C][C]0.458889[/C][/ROW]
[ROW][C]32[/C][C]-0.06457[/C][C]-0.4474[/C][C]0.328317[/C][/ROW]
[ROW][C]33[/C][C]0.004979[/C][C]0.0345[/C][C]0.486312[/C][/ROW]
[ROW][C]34[/C][C]-0.001295[/C][C]-0.009[/C][C]0.49644[/C][/ROW]
[ROW][C]35[/C][C]-0.116785[/C][C]-0.8091[/C][C]0.211221[/C][/ROW]
[ROW][C]36[/C][C]0.254197[/C][C]1.7611[/C][C]0.042293[/C][/ROW]
[ROW][C]37[/C][C]-0.127694[/C][C]-0.8847[/C][C]0.190368[/C][/ROW]
[ROW][C]38[/C][C]8.9e-05[/C][C]6e-04[/C][C]0.499756[/C][/ROW]
[ROW][C]39[/C][C]0.007486[/C][C]0.0519[/C][C]0.479425[/C][/ROW]
[ROW][C]40[/C][C]-0.019898[/C][C]-0.1379[/C][C]0.445466[/C][/ROW]
[ROW][C]41[/C][C]0.061123[/C][C]0.4235[/C][C]0.336921[/C][/ROW]
[ROW][C]42[/C][C]-0.039062[/C][C]-0.2706[/C][C]0.393917[/C][/ROW]
[ROW][C]43[/C][C]-0.025031[/C][C]-0.1734[/C][C]0.431524[/C][/ROW]
[ROW][C]44[/C][C]0.059611[/C][C]0.413[/C][C]0.340724[/C][/ROW]
[ROW][C]45[/C][C]0.022407[/C][C]0.1552[/C][C]0.43864[/C][/ROW]
[ROW][C]46[/C][C]0.00651[/C][C]0.0451[/C][C]0.482107[/C][/ROW]
[ROW][C]47[/C][C]0.000722[/C][C]0.005[/C][C]0.498015[/C][/ROW]
[ROW][C]48[/C][C]NA[/C][C]NA[/C][C]NA[/C][/ROW]
[ROW][C]49[/C][C]NA[/C][C]NA[/C][C]NA[/C][/ROW]
[ROW][C]50[/C][C]NA[/C][C]NA[/C][C]NA[/C][/ROW]
[ROW][C]51[/C][C]NA[/C][C]NA[/C][C]NA[/C][/ROW]
[ROW][C]52[/C][C]NA[/C][C]NA[/C][C]NA[/C][/ROW]
[ROW][C]53[/C][C]NA[/C][C]NA[/C][C]NA[/C][/ROW]
[ROW][C]54[/C][C]NA[/C][C]NA[/C][C]NA[/C][/ROW]
[ROW][C]55[/C][C]NA[/C][C]NA[/C][C]NA[/C][/ROW]
[ROW][C]56[/C][C]NA[/C][C]NA[/C][C]NA[/C][/ROW]
[ROW][C]57[/C][C]NA[/C][C]NA[/C][C]NA[/C][/ROW]
[ROW][C]58[/C][C]NA[/C][C]NA[/C][C]NA[/C][/ROW]
[ROW][C]59[/C][C]NA[/C][C]NA[/C][C]NA[/C][/ROW]
[ROW][C]60[/C][C]NA[/C][C]NA[/C][C]NA[/C][/ROW]
[/TABLE]
Source: https://freestatistics.org/blog/index.php?pk=62925&T=1

Globally Unique Identifier (entire table): ba.freestatistics.org/blog/index.php?pk=62925&T=1

As an alternative you can also use a QR Code:  

The GUIDs for individual cells are displayed in the table below:

Autocorrelation Function
Time lag kACF(k)T-STATP-value
1-0.468068-3.24290.001078
20.102840.71250.239804
30.0597230.41380.340441
4-0.110671-0.76680.223492
50.0895410.62040.268978
6-0.032656-0.22620.410984
7-0.030946-0.21440.41557
80.1101860.76340.224482
90.0301130.20860.41781
10-0.015397-0.10670.457747
110.0595140.41230.340968
12-0.155453-1.0770.143429
130.1048620.72650.235528
14-0.078151-0.54140.295353
150.057640.39930.345706
16-0.035977-0.24930.402112
17-0.04902-0.33960.367811
180.0733230.5080.306892
19-0.09725-0.67380.251846
200.038030.26350.396656
210.001480.01030.495931
22-0.179669-1.24480.109627
230.2504751.73530.044549
24-0.32237-2.23340.015108
250.1035320.71730.238337
26-0.052096-0.36090.359868
270.0137010.09490.462384
280.0403880.27980.390411
29-0.060716-0.42070.337942
300.0452840.31370.37754
31-0.014979-0.10380.458889
32-0.06457-0.44740.328317
330.0049790.03450.486312
34-0.001295-0.0090.49644
35-0.116785-0.80910.211221
360.2541971.76110.042293
37-0.127694-0.88470.190368
388.9e-056e-040.499756
390.0074860.05190.479425
40-0.019898-0.13790.445466
410.0611230.42350.336921
42-0.039062-0.27060.393917
43-0.025031-0.17340.431524
440.0596110.4130.340724
450.0224070.15520.43864
460.006510.04510.482107
470.0007220.0050.498015
48NANANA
49NANANA
50NANANA
51NANANA
52NANANA
53NANANA
54NANANA
55NANANA
56NANANA
57NANANA
58NANANA
59NANANA
60NANANA


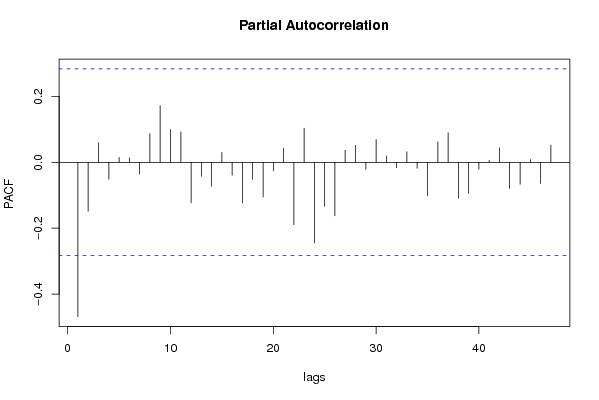
Partial Autocorrelation Function
Time lag kPACF(k)T-STATP-value
1-0.468068-3.24290.001078
2-0.148861-1.03130.153775
30.0593860.41140.341291
4-0.051598-0.35750.361149
50.0148070.10260.45936
60.0133240.09230.463416
7-0.035439-0.24550.403548
80.0864210.59870.276081
90.1714511.18780.120369
100.0991950.68720.247619
110.0920250.63760.263392
12-0.123119-0.8530.198949
13-0.042418-0.29390.385058
14-0.073091-0.50640.307452
150.0296290.20530.419113
16-0.039182-0.27150.393602
17-0.123668-0.85680.197907
18-0.051658-0.35790.360994
19-0.105318-0.72970.234571
20-0.025948-0.17980.429044
210.0419820.29090.386207
22-0.189112-1.31020.098181
230.1033790.71620.23866
24-0.244675-1.69520.048262
25-0.133402-0.92420.179992
26-0.162224-1.12390.133318
270.0366490.25390.400325
280.0515390.35710.361302
29-0.021244-0.14720.441803
300.0689670.47780.317475
310.0190190.13180.447859
32-0.016905-0.11710.453626
330.0321340.22260.412384
34-0.018256-0.12650.449939
35-0.100924-0.69920.243893
360.0615440.42640.335865
370.0897880.62210.268421
38-0.108818-0.75390.227293
39-0.094576-0.65520.257719
40-0.020881-0.14470.44279
410.0055960.03880.484617
420.0439090.30420.381142
43-0.078835-0.54620.293733
44-0.066298-0.45930.324038
450.0078540.05440.478415
46-0.064227-0.4450.329169
470.0521340.36120.35977
48NANANA
49NANANA
50NANANA
51NANANA
52NANANA
53NANANA
54NANANA
55NANANA
56NANANA
57NANANA
58NANANA
59NANANA
60NANANA

\begin{tabular}{lllllllll}
\hline
Partial Autocorrelation Function \tabularnewline
Time lag k & PACF(k) & T-STAT & P-value \tabularnewline
1 & -0.468068 & -3.2429 & 0.001078 \tabularnewline
2 & -0.148861 & -1.0313 & 0.153775 \tabularnewline
3 & 0.059386 & 0.4114 & 0.341291 \tabularnewline
4 & -0.051598 & -0.3575 & 0.361149 \tabularnewline
5 & 0.014807 & 0.1026 & 0.45936 \tabularnewline
6 & 0.013324 & 0.0923 & 0.463416 \tabularnewline
7 & -0.035439 & -0.2455 & 0.403548 \tabularnewline
8 & 0.086421 & 0.5987 & 0.276081 \tabularnewline
9 & 0.171451 & 1.1878 & 0.120369 \tabularnewline
10 & 0.099195 & 0.6872 & 0.247619 \tabularnewline
11 & 0.092025 & 0.6376 & 0.263392 \tabularnewline
12 & -0.123119 & -0.853 & 0.198949 \tabularnewline
13 & -0.042418 & -0.2939 & 0.385058 \tabularnewline
14 & -0.073091 & -0.5064 & 0.307452 \tabularnewline
15 & 0.029629 & 0.2053 & 0.419113 \tabularnewline
16 & -0.039182 & -0.2715 & 0.393602 \tabularnewline
17 & -0.123668 & -0.8568 & 0.197907 \tabularnewline
18 & -0.051658 & -0.3579 & 0.360994 \tabularnewline
19 & -0.105318 & -0.7297 & 0.234571 \tabularnewline
20 & -0.025948 & -0.1798 & 0.429044 \tabularnewline
21 & 0.041982 & 0.2909 & 0.386207 \tabularnewline
22 & -0.189112 & -1.3102 & 0.098181 \tabularnewline
23 & 0.103379 & 0.7162 & 0.23866 \tabularnewline
24 & -0.244675 & -1.6952 & 0.048262 \tabularnewline
25 & -0.133402 & -0.9242 & 0.179992 \tabularnewline
26 & -0.162224 & -1.1239 & 0.133318 \tabularnewline
27 & 0.036649 & 0.2539 & 0.400325 \tabularnewline
28 & 0.051539 & 0.3571 & 0.361302 \tabularnewline
29 & -0.021244 & -0.1472 & 0.441803 \tabularnewline
30 & 0.068967 & 0.4778 & 0.317475 \tabularnewline
31 & 0.019019 & 0.1318 & 0.447859 \tabularnewline
32 & -0.016905 & -0.1171 & 0.453626 \tabularnewline
33 & 0.032134 & 0.2226 & 0.412384 \tabularnewline
34 & -0.018256 & -0.1265 & 0.449939 \tabularnewline
35 & -0.100924 & -0.6992 & 0.243893 \tabularnewline
36 & 0.061544 & 0.4264 & 0.335865 \tabularnewline
37 & 0.089788 & 0.6221 & 0.268421 \tabularnewline
38 & -0.108818 & -0.7539 & 0.227293 \tabularnewline
39 & -0.094576 & -0.6552 & 0.257719 \tabularnewline
40 & -0.020881 & -0.1447 & 0.44279 \tabularnewline
41 & 0.005596 & 0.0388 & 0.484617 \tabularnewline
42 & 0.043909 & 0.3042 & 0.381142 \tabularnewline
43 & -0.078835 & -0.5462 & 0.293733 \tabularnewline
44 & -0.066298 & -0.4593 & 0.324038 \tabularnewline
45 & 0.007854 & 0.0544 & 0.478415 \tabularnewline
46 & -0.064227 & -0.445 & 0.329169 \tabularnewline
47 & 0.052134 & 0.3612 & 0.35977 \tabularnewline
48 & NA & NA & NA \tabularnewline
49 & NA & NA & NA \tabularnewline
50 & NA & NA & NA \tabularnewline
51 & NA & NA & NA \tabularnewline
52 & NA & NA & NA \tabularnewline
53 & NA & NA & NA \tabularnewline
54 & NA & NA & NA \tabularnewline
55 & NA & NA & NA \tabularnewline
56 & NA & NA & NA \tabularnewline
57 & NA & NA & NA \tabularnewline
58 & NA & NA & NA \tabularnewline
59 & NA & NA & NA \tabularnewline
60 & NA & NA & NA \tabularnewline
\hline
\end{tabular}
%Source: https://freestatistics.org/blog/index.php?pk=62925&T=2

[TABLE]
[ROW][C]Partial Autocorrelation Function[/C][/ROW]
[ROW][C]Time lag k[/C][C]PACF(k)[/C][C]T-STAT[/C][C]P-value[/C][/ROW]
[ROW][C]1[/C][C]-0.468068[/C][C]-3.2429[/C][C]0.001078[/C][/ROW]
[ROW][C]2[/C][C]-0.148861[/C][C]-1.0313[/C][C]0.153775[/C][/ROW]
[ROW][C]3[/C][C]0.059386[/C][C]0.4114[/C][C]0.341291[/C][/ROW]
[ROW][C]4[/C][C]-0.051598[/C][C]-0.3575[/C][C]0.361149[/C][/ROW]
[ROW][C]5[/C][C]0.014807[/C][C]0.1026[/C][C]0.45936[/C][/ROW]
[ROW][C]6[/C][C]0.013324[/C][C]0.0923[/C][C]0.463416[/C][/ROW]
[ROW][C]7[/C][C]-0.035439[/C][C]-0.2455[/C][C]0.403548[/C][/ROW]
[ROW][C]8[/C][C]0.086421[/C][C]0.5987[/C][C]0.276081[/C][/ROW]
[ROW][C]9[/C][C]0.171451[/C][C]1.1878[/C][C]0.120369[/C][/ROW]
[ROW][C]10[/C][C]0.099195[/C][C]0.6872[/C][C]0.247619[/C][/ROW]
[ROW][C]11[/C][C]0.092025[/C][C]0.6376[/C][C]0.263392[/C][/ROW]
[ROW][C]12[/C][C]-0.123119[/C][C]-0.853[/C][C]0.198949[/C][/ROW]
[ROW][C]13[/C][C]-0.042418[/C][C]-0.2939[/C][C]0.385058[/C][/ROW]
[ROW][C]14[/C][C]-0.073091[/C][C]-0.5064[/C][C]0.307452[/C][/ROW]
[ROW][C]15[/C][C]0.029629[/C][C]0.2053[/C][C]0.419113[/C][/ROW]
[ROW][C]16[/C][C]-0.039182[/C][C]-0.2715[/C][C]0.393602[/C][/ROW]
[ROW][C]17[/C][C]-0.123668[/C][C]-0.8568[/C][C]0.197907[/C][/ROW]
[ROW][C]18[/C][C]-0.051658[/C][C]-0.3579[/C][C]0.360994[/C][/ROW]
[ROW][C]19[/C][C]-0.105318[/C][C]-0.7297[/C][C]0.234571[/C][/ROW]
[ROW][C]20[/C][C]-0.025948[/C][C]-0.1798[/C][C]0.429044[/C][/ROW]
[ROW][C]21[/C][C]0.041982[/C][C]0.2909[/C][C]0.386207[/C][/ROW]
[ROW][C]22[/C][C]-0.189112[/C][C]-1.3102[/C][C]0.098181[/C][/ROW]
[ROW][C]23[/C][C]0.103379[/C][C]0.7162[/C][C]0.23866[/C][/ROW]
[ROW][C]24[/C][C]-0.244675[/C][C]-1.6952[/C][C]0.048262[/C][/ROW]
[ROW][C]25[/C][C]-0.133402[/C][C]-0.9242[/C][C]0.179992[/C][/ROW]
[ROW][C]26[/C][C]-0.162224[/C][C]-1.1239[/C][C]0.133318[/C][/ROW]
[ROW][C]27[/C][C]0.036649[/C][C]0.2539[/C][C]0.400325[/C][/ROW]
[ROW][C]28[/C][C]0.051539[/C][C]0.3571[/C][C]0.361302[/C][/ROW]
[ROW][C]29[/C][C]-0.021244[/C][C]-0.1472[/C][C]0.441803[/C][/ROW]
[ROW][C]30[/C][C]0.068967[/C][C]0.4778[/C][C]0.317475[/C][/ROW]
[ROW][C]31[/C][C]0.019019[/C][C]0.1318[/C][C]0.447859[/C][/ROW]
[ROW][C]32[/C][C]-0.016905[/C][C]-0.1171[/C][C]0.453626[/C][/ROW]
[ROW][C]33[/C][C]0.032134[/C][C]0.2226[/C][C]0.412384[/C][/ROW]
[ROW][C]34[/C][C]-0.018256[/C][C]-0.1265[/C][C]0.449939[/C][/ROW]
[ROW][C]35[/C][C]-0.100924[/C][C]-0.6992[/C][C]0.243893[/C][/ROW]
[ROW][C]36[/C][C]0.061544[/C][C]0.4264[/C][C]0.335865[/C][/ROW]
[ROW][C]37[/C][C]0.089788[/C][C]0.6221[/C][C]0.268421[/C][/ROW]
[ROW][C]38[/C][C]-0.108818[/C][C]-0.7539[/C][C]0.227293[/C][/ROW]
[ROW][C]39[/C][C]-0.094576[/C][C]-0.6552[/C][C]0.257719[/C][/ROW]
[ROW][C]40[/C][C]-0.020881[/C][C]-0.1447[/C][C]0.44279[/C][/ROW]
[ROW][C]41[/C][C]0.005596[/C][C]0.0388[/C][C]0.484617[/C][/ROW]
[ROW][C]42[/C][C]0.043909[/C][C]0.3042[/C][C]0.381142[/C][/ROW]
[ROW][C]43[/C][C]-0.078835[/C][C]-0.5462[/C][C]0.293733[/C][/ROW]
[ROW][C]44[/C][C]-0.066298[/C][C]-0.4593[/C][C]0.324038[/C][/ROW]
[ROW][C]45[/C][C]0.007854[/C][C]0.0544[/C][C]0.478415[/C][/ROW]
[ROW][C]46[/C][C]-0.064227[/C][C]-0.445[/C][C]0.329169[/C][/ROW]
[ROW][C]47[/C][C]0.052134[/C][C]0.3612[/C][C]0.35977[/C][/ROW]
[ROW][C]48[/C][C]NA[/C][C]NA[/C][C]NA[/C][/ROW]
[ROW][C]49[/C][C]NA[/C][C]NA[/C][C]NA[/C][/ROW]
[ROW][C]50[/C][C]NA[/C][C]NA[/C][C]NA[/C][/ROW]
[ROW][C]51[/C][C]NA[/C][C]NA[/C][C]NA[/C][/ROW]
[ROW][C]52[/C][C]NA[/C][C]NA[/C][C]NA[/C][/ROW]
[ROW][C]53[/C][C]NA[/C][C]NA[/C][C]NA[/C][/ROW]
[ROW][C]54[/C][C]NA[/C][C]NA[/C][C]NA[/C][/ROW]
[ROW][C]55[/C][C]NA[/C][C]NA[/C][C]NA[/C][/ROW]
[ROW][C]56[/C][C]NA[/C][C]NA[/C][C]NA[/C][/ROW]
[ROW][C]57[/C][C]NA[/C][C]NA[/C][C]NA[/C][/ROW]
[ROW][C]58[/C][C]NA[/C][C]NA[/C][C]NA[/C][/ROW]
[ROW][C]59[/C][C]NA[/C][C]NA[/C][C]NA[/C][/ROW]
[ROW][C]60[/C][C]NA[/C][C]NA[/C][C]NA[/C][/ROW]
[/TABLE]
Source: https://freestatistics.org/blog/index.php?pk=62925&T=2

Globally Unique Identifier (entire table): ba.freestatistics.org/blog/index.php?pk=62925&T=2

As an alternative you can also use a QR Code:  

The GUIDs for individual cells are displayed in the table below:

Partial Autocorrelation Function
Time lag kPACF(k)T-STATP-value
1-0.468068-3.24290.001078
2-0.148861-1.03130.153775
30.0593860.41140.341291
4-0.051598-0.35750.361149
50.0148070.10260.45936
60.0133240.09230.463416
7-0.035439-0.24550.403548
80.0864210.59870.276081
90.1714511.18780.120369
100.0991950.68720.247619
110.0920250.63760.263392
12-0.123119-0.8530.198949
13-0.042418-0.29390.385058
14-0.073091-0.50640.307452
150.0296290.20530.419113
16-0.039182-0.27150.393602
17-0.123668-0.85680.197907
18-0.051658-0.35790.360994
19-0.105318-0.72970.234571
20-0.025948-0.17980.429044
210.0419820.29090.386207
22-0.189112-1.31020.098181
230.1033790.71620.23866
24-0.244675-1.69520.048262
25-0.133402-0.92420.179992
26-0.162224-1.12390.133318
270.0366490.25390.400325
280.0515390.35710.361302
29-0.021244-0.14720.441803
300.0689670.47780.317475
310.0190190.13180.447859
32-0.016905-0.11710.453626
330.0321340.22260.412384
34-0.018256-0.12650.449939
35-0.100924-0.69920.243893
360.0615440.42640.335865
370.0897880.62210.268421
38-0.108818-0.75390.227293
39-0.094576-0.65520.257719
40-0.020881-0.14470.44279
410.0055960.03880.484617
420.0439090.30420.381142
43-0.078835-0.54620.293733
44-0.066298-0.45930.324038
450.0078540.05440.478415
46-0.064227-0.4450.329169
470.0521340.36120.35977
48NANANA
49NANANA
50NANANA
51NANANA
52NANANA
53NANANA
54NANANA
55NANANA
56NANANA
57NANANA
58NANANA
59NANANA
60NANANA


Parameters (Session):
par1 = 60 ; par2 = 1 ; par3 = 0 ; par4 = 1 ; par5 = 12 ; par6 = MA ; par7 = 0.95 ;
Parameters (R input):
par1 = 60 ; par2 = 1 ; par3 = 0 ; par4 = 1 ; par5 = 12 ; par6 = MA ; par7 = 0.95 ;
R code (references can be found in the software module):
if (par1 == 'Default') {
par1 = 10*log10(length(x))
} else {
par1 <- as.numeric(par1)
}
par2 <- as.numeric(par2)
par3 <- as.numeric(par3)
par4 <- as.numeric(par4)
par5 <- as.numeric(par5)
if (par6 == 'White Noise') par6 <- 'white' else par6 <- 'ma'
par7 <- as.numeric(par7)
if (par2 == 0) {
x <- log(x)
} else {
x <- (x ^ par2 - 1) / par2
}
if (par3 > 0) x <- diff(x,lag=1,difference=par3)
if (par4 > 0) x <- diff(x,lag=par5,difference=par4)
bitmap(file='pic1.png')
racf <- acf(x, par1, main='Autocorrelation', xlab='time lag', ylab='ACF', ci.type=par6, ci=par7, sub=paste('(lambda=',par2,', d=',par3,', D=',par4,', CI=', par7, ', CI type=',par6,')',sep=''))
dev.off()
bitmap(file='pic2.png')
rpacf <- pacf(x,par1,main='Partial Autocorrelation',xlab='lags',ylab='PACF')
dev.off()
(myacf <- c(racf$acf))
(mypacf <- c(rpacf$acf))
lengthx <- length(x)
sqrtn <- sqrt(lengthx)
load(file='createtable')
a<-table.start()
a<-table.row.start(a)
a<-table.element(a,'Autocorrelation Function',4,TRUE)
a<-table.row.end(a)
a<-table.row.start(a)
a<-table.element(a,'Time lag k',header=TRUE)
a<-table.element(a,hyperlink('basics.htm','ACF(k)','click here for more information about the Autocorrelation Function'),header=TRUE)
a<-table.element(a,'T-STAT',header=TRUE)
a<-table.element(a,'P-value',header=TRUE)
a<-table.row.end(a)
for (i in 2:(par1+1)) {
a<-table.row.start(a)
a<-table.element(a,i-1,header=TRUE)
a<-table.element(a,round(myacf[i],6))
mytstat <- myacf[i]*sqrtn
a<-table.element(a,round(mytstat,4))
a<-table.element(a,round(1-pt(abs(mytstat),lengthx),6))
a<-table.row.end(a)
}
a<-table.end(a)
table.save(a,file='mytable.tab')
a<-table.start()
a<-table.row.start(a)
a<-table.element(a,'Partial Autocorrelation Function',4,TRUE)
a<-table.row.end(a)
a<-table.row.start(a)
a<-table.element(a,'Time lag k',header=TRUE)
a<-table.element(a,hyperlink('basics.htm','PACF(k)','click here for more information about the Partial Autocorrelation Function'),header=TRUE)
a<-table.element(a,'T-STAT',header=TRUE)
a<-table.element(a,'P-value',header=TRUE)
a<-table.row.end(a)
for (i in 1:par1) {
a<-table.row.start(a)
a<-table.element(a,i,header=TRUE)
a<-table.element(a,round(mypacf[i],6))
mytstat <- mypacf[i]*sqrtn
a<-table.element(a,round(mytstat,4))
a<-table.element(a,round(1-pt(abs(mytstat),lengthx),6))
a<-table.row.end(a)
}
a<-table.end(a)
table.save(a,file='mytable1.tab')