Free Statistics

of Irreproducible Research!

Author's title

Author*The author of this computation has been verified*
R Software Modulerwasp_autocorrelation.wasp
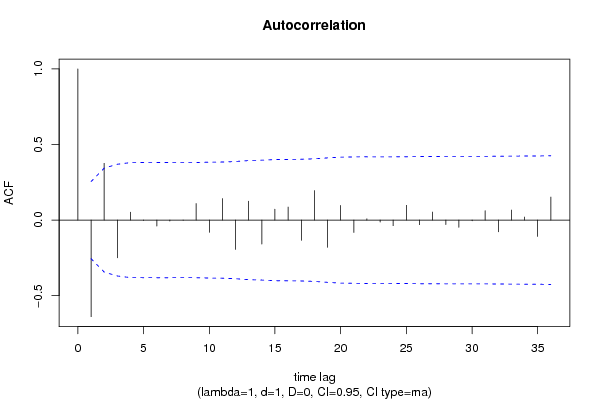
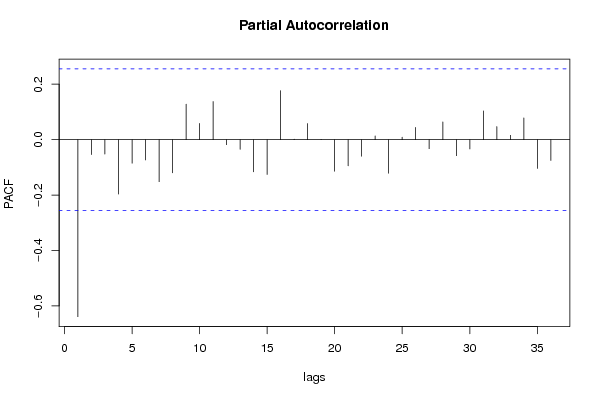
Title produced by software(Partial) Autocorrelation Function
Date of computationThu, 03 Dec 2009 16:43:37 -0700
Cite this page as followsStatistical Computations at FreeStatistics.org, Office for Research Development and Education, URL https://freestatistics.org/blog/index.php?v=date/2009/Dec/04/t12598838619kn6m486hjtnywi.htm/, Retrieved Sat, 27 Apr 2024 19:08:18 +0000
Statistical Computations at FreeStatistics.org, Office for Research Development and Education, URL https://freestatistics.org/blog/index.php?pk=63153, Retrieved Sat, 27 Apr 2024 19:08:18 +0000
QR Codes:

Original text written by user:
IsPrivate?No (this computation is public)
User-defined keywords
Estimated Impact155
Family? (F = Feedback message, R = changed R code, M = changed R Module, P = changed Parameters, D = changed Data)
-     [Univariate Data Series] [data set] [2008-12-01 19:54:57] [b98453cac15ba1066b407e146608df68]
- RMP   [(Partial) Autocorrelation Function] [] [2009-11-27 14:47:30] [b98453cac15ba1066b407e146608df68]
-    D      [(Partial) Autocorrelation Function] [WS9] [2009-12-03 23:43:37] [557d56ec4b06cd0135c259898de8ce95] [Current]
Feedback Forum

Post a new message
Dataseries X:
10284,5
12792
12823,61538
13845,66667
15335,63636
11188,5
13633,25
12298,46667
15353,63636
12696,15385
12213,93333
13683,72727
11214,14286
13950,23077
11179,13333
11801,875
11188,82353
16456,27273
11110,0625
16530,69231
10038,41176
11681,25
11148,88235
8631
9386,444444
9764,736842
12043,75
12948,06667
10987,125
11648,3125
10633,35294
10219,3
9037,6
10296,31579
11705,41176
10681,94444
9362,947368
11306,35294
10984,45
10062,61905
8118,583333
8867,48
8346,72
8529,307692
10697,18182
8591,84
8695,607143
8125,571429
7009,758621
7883,466667
7527,645161
6763,758621
6682,333333
7855,681818
6738,88
7895,434783
6361,884615
6935,956522
8344,454545
9107,944444


Summary of computational transaction
Raw Inputview raw input (R code)
Raw Outputview raw output of R engine
Computing time1 seconds
R Server'Gwilym Jenkins' @ 72.249.127.135

\begin{tabular}{lllllllll}
\hline
Summary of computational transaction \tabularnewline
Raw Input & view raw input (R code)  \tabularnewline
Raw Output & view raw output of R engine  \tabularnewline
Computing time & 1 seconds \tabularnewline
R Server & 'Gwilym Jenkins' @ 72.249.127.135 \tabularnewline
\hline
\end{tabular}
%Source: https://freestatistics.org/blog/index.php?pk=63153&T=0

[TABLE]
[ROW][C]Summary of computational transaction[/C][/ROW]
[ROW][C]Raw Input[/C][C]view raw input (R code) [/C][/ROW]
[ROW][C]Raw Output[/C][C]view raw output of R engine [/C][/ROW]
[ROW][C]Computing time[/C][C]1 seconds[/C][/ROW]
[ROW][C]R Server[/C][C]'Gwilym Jenkins' @ 72.249.127.135[/C][/ROW]
[/TABLE]
Source: https://freestatistics.org/blog/index.php?pk=63153&T=0

Globally Unique Identifier (entire table): ba.freestatistics.org/blog/index.php?pk=63153&T=0

As an alternative you can also use a QR Code:  

The GUIDs for individual cells are displayed in the table below:

Summary of computational transaction
Raw Inputview raw input (R code)
Raw Outputview raw output of R engine
Computing time1 seconds
R Server'Gwilym Jenkins' @ 72.249.127.135


Autocorrelation Function
Time lag kACF(k)T-STATP-value
1-0.638609-4.90524e-06
20.376042.88840.002703
3-0.249426-1.91590.030115
40.0527070.40480.343527
5-0.001724-0.01320.494739
6-0.03969-0.30490.380772
7-0.00619-0.04750.481121
8-0.001297-0.010.496043
90.1091390.83830.20262
10-0.080325-0.6170.269808
110.1427511.09650.138659
12-0.194012-1.49020.070744
130.1255760.96460.169349
14-0.158247-1.21550.114505
150.0722430.55490.290527
160.0867370.66620.253927
17-0.13364-1.02650.154422
180.1957811.50380.068981
19-0.179845-1.38140.08618
200.0973940.74810.228686
21-0.081336-0.62480.26727
220.0085060.06530.474062
23-0.01256-0.09650.461734
24-0.037254-0.28620.38788
250.0975380.74920.228357
26-0.030141-0.23150.408858
270.0536190.41190.340968
28-0.029358-0.22550.411184
29-0.047954-0.36830.356967
30-0.004345-0.03340.486744
310.0627290.48180.315854
32-0.077433-0.59480.277134
330.0669260.51410.304561
340.020460.15720.437829
35-0.107565-0.82620.206003
360.1521761.16890.123575

\begin{tabular}{lllllllll}
\hline
Autocorrelation Function \tabularnewline
Time lag k & ACF(k) & T-STAT & P-value \tabularnewline
1 & -0.638609 & -4.9052 & 4e-06 \tabularnewline
2 & 0.37604 & 2.8884 & 0.002703 \tabularnewline
3 & -0.249426 & -1.9159 & 0.030115 \tabularnewline
4 & 0.052707 & 0.4048 & 0.343527 \tabularnewline
5 & -0.001724 & -0.0132 & 0.494739 \tabularnewline
6 & -0.03969 & -0.3049 & 0.380772 \tabularnewline
7 & -0.00619 & -0.0475 & 0.481121 \tabularnewline
8 & -0.001297 & -0.01 & 0.496043 \tabularnewline
9 & 0.109139 & 0.8383 & 0.20262 \tabularnewline
10 & -0.080325 & -0.617 & 0.269808 \tabularnewline
11 & 0.142751 & 1.0965 & 0.138659 \tabularnewline
12 & -0.194012 & -1.4902 & 0.070744 \tabularnewline
13 & 0.125576 & 0.9646 & 0.169349 \tabularnewline
14 & -0.158247 & -1.2155 & 0.114505 \tabularnewline
15 & 0.072243 & 0.5549 & 0.290527 \tabularnewline
16 & 0.086737 & 0.6662 & 0.253927 \tabularnewline
17 & -0.13364 & -1.0265 & 0.154422 \tabularnewline
18 & 0.195781 & 1.5038 & 0.068981 \tabularnewline
19 & -0.179845 & -1.3814 & 0.08618 \tabularnewline
20 & 0.097394 & 0.7481 & 0.228686 \tabularnewline
21 & -0.081336 & -0.6248 & 0.26727 \tabularnewline
22 & 0.008506 & 0.0653 & 0.474062 \tabularnewline
23 & -0.01256 & -0.0965 & 0.461734 \tabularnewline
24 & -0.037254 & -0.2862 & 0.38788 \tabularnewline
25 & 0.097538 & 0.7492 & 0.228357 \tabularnewline
26 & -0.030141 & -0.2315 & 0.408858 \tabularnewline
27 & 0.053619 & 0.4119 & 0.340968 \tabularnewline
28 & -0.029358 & -0.2255 & 0.411184 \tabularnewline
29 & -0.047954 & -0.3683 & 0.356967 \tabularnewline
30 & -0.004345 & -0.0334 & 0.486744 \tabularnewline
31 & 0.062729 & 0.4818 & 0.315854 \tabularnewline
32 & -0.077433 & -0.5948 & 0.277134 \tabularnewline
33 & 0.066926 & 0.5141 & 0.304561 \tabularnewline
34 & 0.02046 & 0.1572 & 0.437829 \tabularnewline
35 & -0.107565 & -0.8262 & 0.206003 \tabularnewline
36 & 0.152176 & 1.1689 & 0.123575 \tabularnewline
\hline
\end{tabular}
%Source: https://freestatistics.org/blog/index.php?pk=63153&T=1

[TABLE]
[ROW][C]Autocorrelation Function[/C][/ROW]
[ROW][C]Time lag k[/C][C]ACF(k)[/C][C]T-STAT[/C][C]P-value[/C][/ROW]
[ROW][C]1[/C][C]-0.638609[/C][C]-4.9052[/C][C]4e-06[/C][/ROW]
[ROW][C]2[/C][C]0.37604[/C][C]2.8884[/C][C]0.002703[/C][/ROW]
[ROW][C]3[/C][C]-0.249426[/C][C]-1.9159[/C][C]0.030115[/C][/ROW]
[ROW][C]4[/C][C]0.052707[/C][C]0.4048[/C][C]0.343527[/C][/ROW]
[ROW][C]5[/C][C]-0.001724[/C][C]-0.0132[/C][C]0.494739[/C][/ROW]
[ROW][C]6[/C][C]-0.03969[/C][C]-0.3049[/C][C]0.380772[/C][/ROW]
[ROW][C]7[/C][C]-0.00619[/C][C]-0.0475[/C][C]0.481121[/C][/ROW]
[ROW][C]8[/C][C]-0.001297[/C][C]-0.01[/C][C]0.496043[/C][/ROW]
[ROW][C]9[/C][C]0.109139[/C][C]0.8383[/C][C]0.20262[/C][/ROW]
[ROW][C]10[/C][C]-0.080325[/C][C]-0.617[/C][C]0.269808[/C][/ROW]
[ROW][C]11[/C][C]0.142751[/C][C]1.0965[/C][C]0.138659[/C][/ROW]
[ROW][C]12[/C][C]-0.194012[/C][C]-1.4902[/C][C]0.070744[/C][/ROW]
[ROW][C]13[/C][C]0.125576[/C][C]0.9646[/C][C]0.169349[/C][/ROW]
[ROW][C]14[/C][C]-0.158247[/C][C]-1.2155[/C][C]0.114505[/C][/ROW]
[ROW][C]15[/C][C]0.072243[/C][C]0.5549[/C][C]0.290527[/C][/ROW]
[ROW][C]16[/C][C]0.086737[/C][C]0.6662[/C][C]0.253927[/C][/ROW]
[ROW][C]17[/C][C]-0.13364[/C][C]-1.0265[/C][C]0.154422[/C][/ROW]
[ROW][C]18[/C][C]0.195781[/C][C]1.5038[/C][C]0.068981[/C][/ROW]
[ROW][C]19[/C][C]-0.179845[/C][C]-1.3814[/C][C]0.08618[/C][/ROW]
[ROW][C]20[/C][C]0.097394[/C][C]0.7481[/C][C]0.228686[/C][/ROW]
[ROW][C]21[/C][C]-0.081336[/C][C]-0.6248[/C][C]0.26727[/C][/ROW]
[ROW][C]22[/C][C]0.008506[/C][C]0.0653[/C][C]0.474062[/C][/ROW]
[ROW][C]23[/C][C]-0.01256[/C][C]-0.0965[/C][C]0.461734[/C][/ROW]
[ROW][C]24[/C][C]-0.037254[/C][C]-0.2862[/C][C]0.38788[/C][/ROW]
[ROW][C]25[/C][C]0.097538[/C][C]0.7492[/C][C]0.228357[/C][/ROW]
[ROW][C]26[/C][C]-0.030141[/C][C]-0.2315[/C][C]0.408858[/C][/ROW]
[ROW][C]27[/C][C]0.053619[/C][C]0.4119[/C][C]0.340968[/C][/ROW]
[ROW][C]28[/C][C]-0.029358[/C][C]-0.2255[/C][C]0.411184[/C][/ROW]
[ROW][C]29[/C][C]-0.047954[/C][C]-0.3683[/C][C]0.356967[/C][/ROW]
[ROW][C]30[/C][C]-0.004345[/C][C]-0.0334[/C][C]0.486744[/C][/ROW]
[ROW][C]31[/C][C]0.062729[/C][C]0.4818[/C][C]0.315854[/C][/ROW]
[ROW][C]32[/C][C]-0.077433[/C][C]-0.5948[/C][C]0.277134[/C][/ROW]
[ROW][C]33[/C][C]0.066926[/C][C]0.5141[/C][C]0.304561[/C][/ROW]
[ROW][C]34[/C][C]0.02046[/C][C]0.1572[/C][C]0.437829[/C][/ROW]
[ROW][C]35[/C][C]-0.107565[/C][C]-0.8262[/C][C]0.206003[/C][/ROW]
[ROW][C]36[/C][C]0.152176[/C][C]1.1689[/C][C]0.123575[/C][/ROW]
[/TABLE]
Source: https://freestatistics.org/blog/index.php?pk=63153&T=1

Globally Unique Identifier (entire table): ba.freestatistics.org/blog/index.php?pk=63153&T=1

As an alternative you can also use a QR Code:  

The GUIDs for individual cells are displayed in the table below:

Autocorrelation Function
Time lag kACF(k)T-STATP-value
1-0.638609-4.90524e-06
20.376042.88840.002703
3-0.249426-1.91590.030115
40.0527070.40480.343527
5-0.001724-0.01320.494739
6-0.03969-0.30490.380772
7-0.00619-0.04750.481121
8-0.001297-0.010.496043
90.1091390.83830.20262
10-0.080325-0.6170.269808
110.1427511.09650.138659
12-0.194012-1.49020.070744
130.1255760.96460.169349
14-0.158247-1.21550.114505
150.0722430.55490.290527
160.0867370.66620.253927
17-0.13364-1.02650.154422
180.1957811.50380.068981
19-0.179845-1.38140.08618
200.0973940.74810.228686
21-0.081336-0.62480.26727
220.0085060.06530.474062
23-0.01256-0.09650.461734
24-0.037254-0.28620.38788
250.0975380.74920.228357
26-0.030141-0.23150.408858
270.0536190.41190.340968
28-0.029358-0.22550.411184
29-0.047954-0.36830.356967
30-0.004345-0.03340.486744
310.0627290.48180.315854
32-0.077433-0.59480.277134
330.0669260.51410.304561
340.020460.15720.437829
35-0.107565-0.82620.206003
360.1521761.16890.123575


Partial Autocorrelation Function
Time lag kPACF(k)T-STATP-value
1-0.638609-4.90524e-06
2-0.053668-0.41220.340831
3-0.051938-0.39890.345688
4-0.196419-1.50870.068353
5-0.084812-0.65150.258642
6-0.073322-0.56320.287718
7-0.15185-1.16640.124076
8-0.119501-0.91790.181204
90.1281070.9840.164564
100.0583580.44830.327805
110.1374431.05570.147699
12-0.018303-0.14060.444336
13-0.034761-0.2670.395198
14-0.115994-0.8910.188282
15-0.125396-0.96320.169693
160.1769291.3590.089657
170.0019370.01490.494091
180.0580340.44580.328699
190.0003360.00260.498974
20-0.113887-0.87480.19262
21-0.094383-0.7250.235668
22-0.059642-0.45810.324276
230.0132670.10190.459588
24-0.120907-0.92870.178413
250.0090850.06980.472301
260.0442160.33960.367672
27-0.032572-0.25020.401656
280.0639360.49110.312588
29-0.05802-0.44570.328737
30-0.033388-0.25650.399246
310.1037580.7970.214328
320.0470750.36160.359477
330.0155850.11970.45256
340.0784350.60250.274584
35-0.103951-0.79850.213901
36-0.074917-0.57540.283589

\begin{tabular}{lllllllll}
\hline
Partial Autocorrelation Function \tabularnewline
Time lag k & PACF(k) & T-STAT & P-value \tabularnewline
1 & -0.638609 & -4.9052 & 4e-06 \tabularnewline
2 & -0.053668 & -0.4122 & 0.340831 \tabularnewline
3 & -0.051938 & -0.3989 & 0.345688 \tabularnewline
4 & -0.196419 & -1.5087 & 0.068353 \tabularnewline
5 & -0.084812 & -0.6515 & 0.258642 \tabularnewline
6 & -0.073322 & -0.5632 & 0.287718 \tabularnewline
7 & -0.15185 & -1.1664 & 0.124076 \tabularnewline
8 & -0.119501 & -0.9179 & 0.181204 \tabularnewline
9 & 0.128107 & 0.984 & 0.164564 \tabularnewline
10 & 0.058358 & 0.4483 & 0.327805 \tabularnewline
11 & 0.137443 & 1.0557 & 0.147699 \tabularnewline
12 & -0.018303 & -0.1406 & 0.444336 \tabularnewline
13 & -0.034761 & -0.267 & 0.395198 \tabularnewline
14 & -0.115994 & -0.891 & 0.188282 \tabularnewline
15 & -0.125396 & -0.9632 & 0.169693 \tabularnewline
16 & 0.176929 & 1.359 & 0.089657 \tabularnewline
17 & 0.001937 & 0.0149 & 0.494091 \tabularnewline
18 & 0.058034 & 0.4458 & 0.328699 \tabularnewline
19 & 0.000336 & 0.0026 & 0.498974 \tabularnewline
20 & -0.113887 & -0.8748 & 0.19262 \tabularnewline
21 & -0.094383 & -0.725 & 0.235668 \tabularnewline
22 & -0.059642 & -0.4581 & 0.324276 \tabularnewline
23 & 0.013267 & 0.1019 & 0.459588 \tabularnewline
24 & -0.120907 & -0.9287 & 0.178413 \tabularnewline
25 & 0.009085 & 0.0698 & 0.472301 \tabularnewline
26 & 0.044216 & 0.3396 & 0.367672 \tabularnewline
27 & -0.032572 & -0.2502 & 0.401656 \tabularnewline
28 & 0.063936 & 0.4911 & 0.312588 \tabularnewline
29 & -0.05802 & -0.4457 & 0.328737 \tabularnewline
30 & -0.033388 & -0.2565 & 0.399246 \tabularnewline
31 & 0.103758 & 0.797 & 0.214328 \tabularnewline
32 & 0.047075 & 0.3616 & 0.359477 \tabularnewline
33 & 0.015585 & 0.1197 & 0.45256 \tabularnewline
34 & 0.078435 & 0.6025 & 0.274584 \tabularnewline
35 & -0.103951 & -0.7985 & 0.213901 \tabularnewline
36 & -0.074917 & -0.5754 & 0.283589 \tabularnewline
\hline
\end{tabular}
%Source: https://freestatistics.org/blog/index.php?pk=63153&T=2

[TABLE]
[ROW][C]Partial Autocorrelation Function[/C][/ROW]
[ROW][C]Time lag k[/C][C]PACF(k)[/C][C]T-STAT[/C][C]P-value[/C][/ROW]
[ROW][C]1[/C][C]-0.638609[/C][C]-4.9052[/C][C]4e-06[/C][/ROW]
[ROW][C]2[/C][C]-0.053668[/C][C]-0.4122[/C][C]0.340831[/C][/ROW]
[ROW][C]3[/C][C]-0.051938[/C][C]-0.3989[/C][C]0.345688[/C][/ROW]
[ROW][C]4[/C][C]-0.196419[/C][C]-1.5087[/C][C]0.068353[/C][/ROW]
[ROW][C]5[/C][C]-0.084812[/C][C]-0.6515[/C][C]0.258642[/C][/ROW]
[ROW][C]6[/C][C]-0.073322[/C][C]-0.5632[/C][C]0.287718[/C][/ROW]
[ROW][C]7[/C][C]-0.15185[/C][C]-1.1664[/C][C]0.124076[/C][/ROW]
[ROW][C]8[/C][C]-0.119501[/C][C]-0.9179[/C][C]0.181204[/C][/ROW]
[ROW][C]9[/C][C]0.128107[/C][C]0.984[/C][C]0.164564[/C][/ROW]
[ROW][C]10[/C][C]0.058358[/C][C]0.4483[/C][C]0.327805[/C][/ROW]
[ROW][C]11[/C][C]0.137443[/C][C]1.0557[/C][C]0.147699[/C][/ROW]
[ROW][C]12[/C][C]-0.018303[/C][C]-0.1406[/C][C]0.444336[/C][/ROW]
[ROW][C]13[/C][C]-0.034761[/C][C]-0.267[/C][C]0.395198[/C][/ROW]
[ROW][C]14[/C][C]-0.115994[/C][C]-0.891[/C][C]0.188282[/C][/ROW]
[ROW][C]15[/C][C]-0.125396[/C][C]-0.9632[/C][C]0.169693[/C][/ROW]
[ROW][C]16[/C][C]0.176929[/C][C]1.359[/C][C]0.089657[/C][/ROW]
[ROW][C]17[/C][C]0.001937[/C][C]0.0149[/C][C]0.494091[/C][/ROW]
[ROW][C]18[/C][C]0.058034[/C][C]0.4458[/C][C]0.328699[/C][/ROW]
[ROW][C]19[/C][C]0.000336[/C][C]0.0026[/C][C]0.498974[/C][/ROW]
[ROW][C]20[/C][C]-0.113887[/C][C]-0.8748[/C][C]0.19262[/C][/ROW]
[ROW][C]21[/C][C]-0.094383[/C][C]-0.725[/C][C]0.235668[/C][/ROW]
[ROW][C]22[/C][C]-0.059642[/C][C]-0.4581[/C][C]0.324276[/C][/ROW]
[ROW][C]23[/C][C]0.013267[/C][C]0.1019[/C][C]0.459588[/C][/ROW]
[ROW][C]24[/C][C]-0.120907[/C][C]-0.9287[/C][C]0.178413[/C][/ROW]
[ROW][C]25[/C][C]0.009085[/C][C]0.0698[/C][C]0.472301[/C][/ROW]
[ROW][C]26[/C][C]0.044216[/C][C]0.3396[/C][C]0.367672[/C][/ROW]
[ROW][C]27[/C][C]-0.032572[/C][C]-0.2502[/C][C]0.401656[/C][/ROW]
[ROW][C]28[/C][C]0.063936[/C][C]0.4911[/C][C]0.312588[/C][/ROW]
[ROW][C]29[/C][C]-0.05802[/C][C]-0.4457[/C][C]0.328737[/C][/ROW]
[ROW][C]30[/C][C]-0.033388[/C][C]-0.2565[/C][C]0.399246[/C][/ROW]
[ROW][C]31[/C][C]0.103758[/C][C]0.797[/C][C]0.214328[/C][/ROW]
[ROW][C]32[/C][C]0.047075[/C][C]0.3616[/C][C]0.359477[/C][/ROW]
[ROW][C]33[/C][C]0.015585[/C][C]0.1197[/C][C]0.45256[/C][/ROW]
[ROW][C]34[/C][C]0.078435[/C][C]0.6025[/C][C]0.274584[/C][/ROW]
[ROW][C]35[/C][C]-0.103951[/C][C]-0.7985[/C][C]0.213901[/C][/ROW]
[ROW][C]36[/C][C]-0.074917[/C][C]-0.5754[/C][C]0.283589[/C][/ROW]
[/TABLE]
Source: https://freestatistics.org/blog/index.php?pk=63153&T=2

Globally Unique Identifier (entire table): ba.freestatistics.org/blog/index.php?pk=63153&T=2

As an alternative you can also use a QR Code:  

The GUIDs for individual cells are displayed in the table below:

Partial Autocorrelation Function
Time lag kPACF(k)T-STATP-value
1-0.638609-4.90524e-06
2-0.053668-0.41220.340831
3-0.051938-0.39890.345688
4-0.196419-1.50870.068353
5-0.084812-0.65150.258642
6-0.073322-0.56320.287718
7-0.15185-1.16640.124076
8-0.119501-0.91790.181204
90.1281070.9840.164564
100.0583580.44830.327805
110.1374431.05570.147699
12-0.018303-0.14060.444336
13-0.034761-0.2670.395198
14-0.115994-0.8910.188282
15-0.125396-0.96320.169693
160.1769291.3590.089657
170.0019370.01490.494091
180.0580340.44580.328699
190.0003360.00260.498974
20-0.113887-0.87480.19262
21-0.094383-0.7250.235668
22-0.059642-0.45810.324276
230.0132670.10190.459588
24-0.120907-0.92870.178413
250.0090850.06980.472301
260.0442160.33960.367672
27-0.032572-0.25020.401656
280.0639360.49110.312588
29-0.05802-0.44570.328737
30-0.033388-0.25650.399246
310.1037580.7970.214328
320.0470750.36160.359477
330.0155850.11970.45256
340.0784350.60250.274584
35-0.103951-0.79850.213901
36-0.074917-0.57540.283589


Parameters (Session):
par1 = 36 ; par2 = 1 ; par3 = 1 ; par4 = 0 ; par5 = 12 ; par6 = MA ; par7 = 0.95 ;
Parameters (R input):
par1 = 36 ; par2 = 1 ; par3 = 1 ; par4 = 0 ; par5 = 12 ; par6 = MA ; par7 = 0.95 ;
R code (references can be found in the software module):
if (par1 == 'Default') {
par1 = 10*log10(length(x))
} else {
par1 <- as.numeric(par1)
}
par2 <- as.numeric(par2)
par3 <- as.numeric(par3)
par4 <- as.numeric(par4)
par5 <- as.numeric(par5)
if (par6 == 'White Noise') par6 <- 'white' else par6 <- 'ma'
par7 <- as.numeric(par7)
if (par2 == 0) {
x <- log(x)
} else {
x <- (x ^ par2 - 1) / par2
}
if (par3 > 0) x <- diff(x,lag=1,difference=par3)
if (par4 > 0) x <- diff(x,lag=par5,difference=par4)
bitmap(file='pic1.png')
racf <- acf(x, par1, main='Autocorrelation', xlab='time lag', ylab='ACF', ci.type=par6, ci=par7, sub=paste('(lambda=',par2,', d=',par3,', D=',par4,', CI=', par7, ', CI type=',par6,')',sep=''))
dev.off()
bitmap(file='pic2.png')
rpacf <- pacf(x,par1,main='Partial Autocorrelation',xlab='lags',ylab='PACF')
dev.off()
(myacf <- c(racf$acf))
(mypacf <- c(rpacf$acf))
lengthx <- length(x)
sqrtn <- sqrt(lengthx)
load(file='createtable')
a<-table.start()
a<-table.row.start(a)
a<-table.element(a,'Autocorrelation Function',4,TRUE)
a<-table.row.end(a)
a<-table.row.start(a)
a<-table.element(a,'Time lag k',header=TRUE)
a<-table.element(a,hyperlink('basics.htm','ACF(k)','click here for more information about the Autocorrelation Function'),header=TRUE)
a<-table.element(a,'T-STAT',header=TRUE)
a<-table.element(a,'P-value',header=TRUE)
a<-table.row.end(a)
for (i in 2:(par1+1)) {
a<-table.row.start(a)
a<-table.element(a,i-1,header=TRUE)
a<-table.element(a,round(myacf[i],6))
mytstat <- myacf[i]*sqrtn
a<-table.element(a,round(mytstat,4))
a<-table.element(a,round(1-pt(abs(mytstat),lengthx),6))
a<-table.row.end(a)
}
a<-table.end(a)
table.save(a,file='mytable.tab')
a<-table.start()
a<-table.row.start(a)
a<-table.element(a,'Partial Autocorrelation Function',4,TRUE)
a<-table.row.end(a)
a<-table.row.start(a)
a<-table.element(a,'Time lag k',header=TRUE)
a<-table.element(a,hyperlink('basics.htm','PACF(k)','click here for more information about the Partial Autocorrelation Function'),header=TRUE)
a<-table.element(a,'T-STAT',header=TRUE)
a<-table.element(a,'P-value',header=TRUE)
a<-table.row.end(a)
for (i in 1:par1) {
a<-table.row.start(a)
a<-table.element(a,i,header=TRUE)
a<-table.element(a,round(mypacf[i],6))
mytstat <- mypacf[i]*sqrtn
a<-table.element(a,round(mytstat,4))
a<-table.element(a,round(1-pt(abs(mytstat),lengthx),6))
a<-table.row.end(a)
}
a<-table.end(a)
table.save(a,file='mytable1.tab')