Free Statistics

of Irreproducible Research!

Author's title

Author*The author of this computation has been verified*
R Software Modulerwasp_autocorrelation.wasp
Title produced by software(Partial) Autocorrelation Function
Date of computationFri, 04 Dec 2009 03:00:10 -0700
Cite this page as followsStatistical Computations at FreeStatistics.org, Office for Research Development and Education, URL https://freestatistics.org/blog/index.php?v=date/2009/Dec/04/t1259920870ktq8n9xkbnhxy2r.htm/, Retrieved Sat, 27 Apr 2024 15:15:29 +0000
Statistical Computations at FreeStatistics.org, Office for Research Development and Education, URL https://freestatistics.org/blog/index.php?pk=63224, Retrieved Sat, 27 Apr 2024 15:15:29 +0000
QR Codes:

Original text written by user:
IsPrivate?No (this computation is public)
User-defined keywords
Estimated Impact125
Family? (F = Feedback message, R = changed R code, M = changed R Module, P = changed Parameters, D = changed Data)
-     [Univariate Data Series] [data set] [2008-12-01 19:54:57] [b98453cac15ba1066b407e146608df68]
- RMP   [(Partial) Autocorrelation Function] [] [2009-11-27 14:46:03] [b98453cac15ba1066b407e146608df68]
-   PD      [(Partial) Autocorrelation Function] [WS 9 (P)ACF 1] [2009-12-04 10:00:10] [eba9f01697e64705b70041e6f338cb22] [Current]
-             [(Partial) Autocorrelation Function] [WS 9 (P)ACF 2] [2009-12-04 10:02:05] [83058a88a37d754675a5cd22dab372fc]
-   P           [(Partial) Autocorrelation Function] [WS9 aanvulling] [2009-12-09 22:06:03] [e0fc65a5811681d807296d590d5b45de]
Feedback Forum

Post a new message
Dataseries X:
98.8
100.5
110.4
96.4
101.9
106.2
81
94.7
101
109.4
102.3
90.7
96.2
96.1
106
103.1
102
104.7
86
92.1
106.9
112.6
101.7
92
97.4
97
105.4
102.7
98.1
104.5
87.4
89.9
109.8
111.7
98.6
96.9
95.1
97
112.7
102.9
97.4
111.4
87.4
96.8
114.1
110.3
103.9
101.6
94.6
95.9
104.7
102.8
98.1
113.9
80.9
95.7
113.2
105.9
108.8
102.3
99
100.7
115.5
100.7
109.9
114.6
85.4
100.5
114.8
116.5
112.9
102
106
105.3
118.8
106.1
109.3
117.2
92.5
104.2
112.5
122.4
113.3
100
110.7
112.8
109.8
117.3
109.1
115.9
96
99.8
116.8
115.7
99.4
94.3


Summary of computational transaction
Raw Inputview raw input (R code)
Raw Outputview raw output of R engine
Computing time1 seconds
R Server'Gwilym Jenkins' @ 72.249.127.135

\begin{tabular}{lllllllll}
\hline
Summary of computational transaction \tabularnewline
Raw Input & view raw input (R code)  \tabularnewline
Raw Output & view raw output of R engine  \tabularnewline
Computing time & 1 seconds \tabularnewline
R Server & 'Gwilym Jenkins' @ 72.249.127.135 \tabularnewline
\hline
\end{tabular}
%Source: https://freestatistics.org/blog/index.php?pk=63224&T=0

[TABLE]
[ROW][C]Summary of computational transaction[/C][/ROW]
[ROW][C]Raw Input[/C][C]view raw input (R code) [/C][/ROW]
[ROW][C]Raw Output[/C][C]view raw output of R engine [/C][/ROW]
[ROW][C]Computing time[/C][C]1 seconds[/C][/ROW]
[ROW][C]R Server[/C][C]'Gwilym Jenkins' @ 72.249.127.135[/C][/ROW]
[/TABLE]
Source: https://freestatistics.org/blog/index.php?pk=63224&T=0

Globally Unique Identifier (entire table): ba.freestatistics.org/blog/index.php?pk=63224&T=0

As an alternative you can also use a QR Code:  

The GUIDs for individual cells are displayed in the table below:

Summary of computational transaction
Raw Inputview raw input (R code)
Raw Outputview raw output of R engine
Computing time1 seconds
R Server'Gwilym Jenkins' @ 72.249.127.135


Autocorrelation Function
Time lag kACF(k)T-STATP-value
10.1734641.69960.046223
2-0.145121-1.42190.079149
30.0237080.23230.408402
40.0157240.15410.438941
50.3359643.29180.000697
60.3824053.74680.000153
70.2638092.58480.005625
80.0130410.12780.449299
9-0.058564-0.57380.283721
10-0.173649-1.70140.046052
110.1589081.5570.061383
120.742287.27280
130.0904630.88640.188821
14-0.187822-1.84030.034409
15-0.049742-0.48740.313552
16-0.052428-0.51370.304324
170.2386312.33810.010729
180.2633052.57990.0057
190.1655021.62160.054087
20-0.037652-0.36890.356504
21-0.124371-1.21860.112995
22-0.200544-1.96490.026157
230.1060931.03950.150592
240.5253115.1471e-06
250.0297090.29110.385806
26-0.200485-1.96430.026191
27-0.137849-1.35060.089993
28-0.082856-0.81180.209453
290.1378621.35080.089972
300.1345991.31880.095188
310.1020931.00030.15984
32-0.091619-0.89770.185802
33-0.190939-1.87080.032209
34-0.198157-1.94150.027563
35-0.006156-0.06030.476014
360.3751273.67550.000196

\begin{tabular}{lllllllll}
\hline
Autocorrelation Function \tabularnewline
Time lag k & ACF(k) & T-STAT & P-value \tabularnewline
1 & 0.173464 & 1.6996 & 0.046223 \tabularnewline
2 & -0.145121 & -1.4219 & 0.079149 \tabularnewline
3 & 0.023708 & 0.2323 & 0.408402 \tabularnewline
4 & 0.015724 & 0.1541 & 0.438941 \tabularnewline
5 & 0.335964 & 3.2918 & 0.000697 \tabularnewline
6 & 0.382405 & 3.7468 & 0.000153 \tabularnewline
7 & 0.263809 & 2.5848 & 0.005625 \tabularnewline
8 & 0.013041 & 0.1278 & 0.449299 \tabularnewline
9 & -0.058564 & -0.5738 & 0.283721 \tabularnewline
10 & -0.173649 & -1.7014 & 0.046052 \tabularnewline
11 & 0.158908 & 1.557 & 0.061383 \tabularnewline
12 & 0.74228 & 7.2728 & 0 \tabularnewline
13 & 0.090463 & 0.8864 & 0.188821 \tabularnewline
14 & -0.187822 & -1.8403 & 0.034409 \tabularnewline
15 & -0.049742 & -0.4874 & 0.313552 \tabularnewline
16 & -0.052428 & -0.5137 & 0.304324 \tabularnewline
17 & 0.238631 & 2.3381 & 0.010729 \tabularnewline
18 & 0.263305 & 2.5799 & 0.0057 \tabularnewline
19 & 0.165502 & 1.6216 & 0.054087 \tabularnewline
20 & -0.037652 & -0.3689 & 0.356504 \tabularnewline
21 & -0.124371 & -1.2186 & 0.112995 \tabularnewline
22 & -0.200544 & -1.9649 & 0.026157 \tabularnewline
23 & 0.106093 & 1.0395 & 0.150592 \tabularnewline
24 & 0.525311 & 5.147 & 1e-06 \tabularnewline
25 & 0.029709 & 0.2911 & 0.385806 \tabularnewline
26 & -0.200485 & -1.9643 & 0.026191 \tabularnewline
27 & -0.137849 & -1.3506 & 0.089993 \tabularnewline
28 & -0.082856 & -0.8118 & 0.209453 \tabularnewline
29 & 0.137862 & 1.3508 & 0.089972 \tabularnewline
30 & 0.134599 & 1.3188 & 0.095188 \tabularnewline
31 & 0.102093 & 1.0003 & 0.15984 \tabularnewline
32 & -0.091619 & -0.8977 & 0.185802 \tabularnewline
33 & -0.190939 & -1.8708 & 0.032209 \tabularnewline
34 & -0.198157 & -1.9415 & 0.027563 \tabularnewline
35 & -0.006156 & -0.0603 & 0.476014 \tabularnewline
36 & 0.375127 & 3.6755 & 0.000196 \tabularnewline
\hline
\end{tabular}
%Source: https://freestatistics.org/blog/index.php?pk=63224&T=1

[TABLE]
[ROW][C]Autocorrelation Function[/C][/ROW]
[ROW][C]Time lag k[/C][C]ACF(k)[/C][C]T-STAT[/C][C]P-value[/C][/ROW]
[ROW][C]1[/C][C]0.173464[/C][C]1.6996[/C][C]0.046223[/C][/ROW]
[ROW][C]2[/C][C]-0.145121[/C][C]-1.4219[/C][C]0.079149[/C][/ROW]
[ROW][C]3[/C][C]0.023708[/C][C]0.2323[/C][C]0.408402[/C][/ROW]
[ROW][C]4[/C][C]0.015724[/C][C]0.1541[/C][C]0.438941[/C][/ROW]
[ROW][C]5[/C][C]0.335964[/C][C]3.2918[/C][C]0.000697[/C][/ROW]
[ROW][C]6[/C][C]0.382405[/C][C]3.7468[/C][C]0.000153[/C][/ROW]
[ROW][C]7[/C][C]0.263809[/C][C]2.5848[/C][C]0.005625[/C][/ROW]
[ROW][C]8[/C][C]0.013041[/C][C]0.1278[/C][C]0.449299[/C][/ROW]
[ROW][C]9[/C][C]-0.058564[/C][C]-0.5738[/C][C]0.283721[/C][/ROW]
[ROW][C]10[/C][C]-0.173649[/C][C]-1.7014[/C][C]0.046052[/C][/ROW]
[ROW][C]11[/C][C]0.158908[/C][C]1.557[/C][C]0.061383[/C][/ROW]
[ROW][C]12[/C][C]0.74228[/C][C]7.2728[/C][C]0[/C][/ROW]
[ROW][C]13[/C][C]0.090463[/C][C]0.8864[/C][C]0.188821[/C][/ROW]
[ROW][C]14[/C][C]-0.187822[/C][C]-1.8403[/C][C]0.034409[/C][/ROW]
[ROW][C]15[/C][C]-0.049742[/C][C]-0.4874[/C][C]0.313552[/C][/ROW]
[ROW][C]16[/C][C]-0.052428[/C][C]-0.5137[/C][C]0.304324[/C][/ROW]
[ROW][C]17[/C][C]0.238631[/C][C]2.3381[/C][C]0.010729[/C][/ROW]
[ROW][C]18[/C][C]0.263305[/C][C]2.5799[/C][C]0.0057[/C][/ROW]
[ROW][C]19[/C][C]0.165502[/C][C]1.6216[/C][C]0.054087[/C][/ROW]
[ROW][C]20[/C][C]-0.037652[/C][C]-0.3689[/C][C]0.356504[/C][/ROW]
[ROW][C]21[/C][C]-0.124371[/C][C]-1.2186[/C][C]0.112995[/C][/ROW]
[ROW][C]22[/C][C]-0.200544[/C][C]-1.9649[/C][C]0.026157[/C][/ROW]
[ROW][C]23[/C][C]0.106093[/C][C]1.0395[/C][C]0.150592[/C][/ROW]
[ROW][C]24[/C][C]0.525311[/C][C]5.147[/C][C]1e-06[/C][/ROW]
[ROW][C]25[/C][C]0.029709[/C][C]0.2911[/C][C]0.385806[/C][/ROW]
[ROW][C]26[/C][C]-0.200485[/C][C]-1.9643[/C][C]0.026191[/C][/ROW]
[ROW][C]27[/C][C]-0.137849[/C][C]-1.3506[/C][C]0.089993[/C][/ROW]
[ROW][C]28[/C][C]-0.082856[/C][C]-0.8118[/C][C]0.209453[/C][/ROW]
[ROW][C]29[/C][C]0.137862[/C][C]1.3508[/C][C]0.089972[/C][/ROW]
[ROW][C]30[/C][C]0.134599[/C][C]1.3188[/C][C]0.095188[/C][/ROW]
[ROW][C]31[/C][C]0.102093[/C][C]1.0003[/C][C]0.15984[/C][/ROW]
[ROW][C]32[/C][C]-0.091619[/C][C]-0.8977[/C][C]0.185802[/C][/ROW]
[ROW][C]33[/C][C]-0.190939[/C][C]-1.8708[/C][C]0.032209[/C][/ROW]
[ROW][C]34[/C][C]-0.198157[/C][C]-1.9415[/C][C]0.027563[/C][/ROW]
[ROW][C]35[/C][C]-0.006156[/C][C]-0.0603[/C][C]0.476014[/C][/ROW]
[ROW][C]36[/C][C]0.375127[/C][C]3.6755[/C][C]0.000196[/C][/ROW]
[/TABLE]
Source: https://freestatistics.org/blog/index.php?pk=63224&T=1

Globally Unique Identifier (entire table): ba.freestatistics.org/blog/index.php?pk=63224&T=1

As an alternative you can also use a QR Code:  

The GUIDs for individual cells are displayed in the table below:

Autocorrelation Function
Time lag kACF(k)T-STATP-value
10.1734641.69960.046223
2-0.145121-1.42190.079149
30.0237080.23230.408402
40.0157240.15410.438941
50.3359643.29180.000697
60.3824053.74680.000153
70.2638092.58480.005625
80.0130410.12780.449299
9-0.058564-0.57380.283721
10-0.173649-1.70140.046052
110.1589081.5570.061383
120.742287.27280
130.0904630.88640.188821
14-0.187822-1.84030.034409
15-0.049742-0.48740.313552
16-0.052428-0.51370.304324
170.2386312.33810.010729
180.2633052.57990.0057
190.1655021.62160.054087
20-0.037652-0.36890.356504
21-0.124371-1.21860.112995
22-0.200544-1.96490.026157
230.1060931.03950.150592
240.5253115.1471e-06
250.0297090.29110.385806
26-0.200485-1.96430.026191
27-0.137849-1.35060.089993
28-0.082856-0.81180.209453
290.1378621.35080.089972
300.1345991.31880.095188
310.1020931.00030.15984
32-0.091619-0.89770.185802
33-0.190939-1.87080.032209
34-0.198157-1.94150.027563
35-0.006156-0.06030.476014
360.3751273.67550.000196


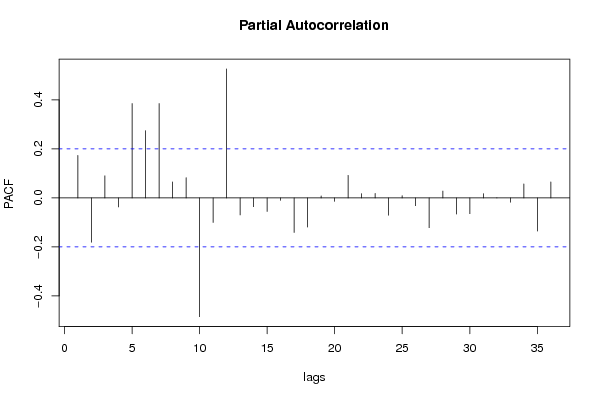
Partial Autocorrelation Function
Time lag kPACF(k)T-STATP-value
10.1734641.69960.046223
2-0.180647-1.770.039954
30.0903430.88520.189137
4-0.036632-0.35890.360221
50.3851823.7740.000139
60.2744412.6890.004226
70.385123.77340.000139
80.0651790.63860.262296
90.0825390.80870.21034
10-0.484597-4.74814e-06
11-0.100265-0.98240.164189
120.5264435.15811e-06
13-0.069256-0.67860.249523
14-0.035734-0.35010.363508
15-0.055007-0.5390.295583
16-0.00979-0.09590.461891
17-0.141139-1.38290.084956
18-0.118896-1.16490.123465
190.0080990.07930.46846
20-0.013843-0.13560.446196
210.0920630.9020.184649
220.0172910.16940.432912
230.0184880.18110.428318
24-0.070715-0.69290.245034
250.0093590.09170.463564
26-0.03147-0.30830.379247
27-0.121252-1.1880.118878
280.0281230.27550.391745
29-0.066101-0.64770.259378
30-0.064464-0.63160.264568
310.0173060.16960.432855
320.0005430.00530.497885
33-0.017372-0.17020.432603
340.0569560.55810.289053
35-0.135052-1.32320.09445
360.0653640.64040.261707

\begin{tabular}{lllllllll}
\hline
Partial Autocorrelation Function \tabularnewline
Time lag k & PACF(k) & T-STAT & P-value \tabularnewline
1 & 0.173464 & 1.6996 & 0.046223 \tabularnewline
2 & -0.180647 & -1.77 & 0.039954 \tabularnewline
3 & 0.090343 & 0.8852 & 0.189137 \tabularnewline
4 & -0.036632 & -0.3589 & 0.360221 \tabularnewline
5 & 0.385182 & 3.774 & 0.000139 \tabularnewline
6 & 0.274441 & 2.689 & 0.004226 \tabularnewline
7 & 0.38512 & 3.7734 & 0.000139 \tabularnewline
8 & 0.065179 & 0.6386 & 0.262296 \tabularnewline
9 & 0.082539 & 0.8087 & 0.21034 \tabularnewline
10 & -0.484597 & -4.7481 & 4e-06 \tabularnewline
11 & -0.100265 & -0.9824 & 0.164189 \tabularnewline
12 & 0.526443 & 5.1581 & 1e-06 \tabularnewline
13 & -0.069256 & -0.6786 & 0.249523 \tabularnewline
14 & -0.035734 & -0.3501 & 0.363508 \tabularnewline
15 & -0.055007 & -0.539 & 0.295583 \tabularnewline
16 & -0.00979 & -0.0959 & 0.461891 \tabularnewline
17 & -0.141139 & -1.3829 & 0.084956 \tabularnewline
18 & -0.118896 & -1.1649 & 0.123465 \tabularnewline
19 & 0.008099 & 0.0793 & 0.46846 \tabularnewline
20 & -0.013843 & -0.1356 & 0.446196 \tabularnewline
21 & 0.092063 & 0.902 & 0.184649 \tabularnewline
22 & 0.017291 & 0.1694 & 0.432912 \tabularnewline
23 & 0.018488 & 0.1811 & 0.428318 \tabularnewline
24 & -0.070715 & -0.6929 & 0.245034 \tabularnewline
25 & 0.009359 & 0.0917 & 0.463564 \tabularnewline
26 & -0.03147 & -0.3083 & 0.379247 \tabularnewline
27 & -0.121252 & -1.188 & 0.118878 \tabularnewline
28 & 0.028123 & 0.2755 & 0.391745 \tabularnewline
29 & -0.066101 & -0.6477 & 0.259378 \tabularnewline
30 & -0.064464 & -0.6316 & 0.264568 \tabularnewline
31 & 0.017306 & 0.1696 & 0.432855 \tabularnewline
32 & 0.000543 & 0.0053 & 0.497885 \tabularnewline
33 & -0.017372 & -0.1702 & 0.432603 \tabularnewline
34 & 0.056956 & 0.5581 & 0.289053 \tabularnewline
35 & -0.135052 & -1.3232 & 0.09445 \tabularnewline
36 & 0.065364 & 0.6404 & 0.261707 \tabularnewline
\hline
\end{tabular}
%Source: https://freestatistics.org/blog/index.php?pk=63224&T=2

[TABLE]
[ROW][C]Partial Autocorrelation Function[/C][/ROW]
[ROW][C]Time lag k[/C][C]PACF(k)[/C][C]T-STAT[/C][C]P-value[/C][/ROW]
[ROW][C]1[/C][C]0.173464[/C][C]1.6996[/C][C]0.046223[/C][/ROW]
[ROW][C]2[/C][C]-0.180647[/C][C]-1.77[/C][C]0.039954[/C][/ROW]
[ROW][C]3[/C][C]0.090343[/C][C]0.8852[/C][C]0.189137[/C][/ROW]
[ROW][C]4[/C][C]-0.036632[/C][C]-0.3589[/C][C]0.360221[/C][/ROW]
[ROW][C]5[/C][C]0.385182[/C][C]3.774[/C][C]0.000139[/C][/ROW]
[ROW][C]6[/C][C]0.274441[/C][C]2.689[/C][C]0.004226[/C][/ROW]
[ROW][C]7[/C][C]0.38512[/C][C]3.7734[/C][C]0.000139[/C][/ROW]
[ROW][C]8[/C][C]0.065179[/C][C]0.6386[/C][C]0.262296[/C][/ROW]
[ROW][C]9[/C][C]0.082539[/C][C]0.8087[/C][C]0.21034[/C][/ROW]
[ROW][C]10[/C][C]-0.484597[/C][C]-4.7481[/C][C]4e-06[/C][/ROW]
[ROW][C]11[/C][C]-0.100265[/C][C]-0.9824[/C][C]0.164189[/C][/ROW]
[ROW][C]12[/C][C]0.526443[/C][C]5.1581[/C][C]1e-06[/C][/ROW]
[ROW][C]13[/C][C]-0.069256[/C][C]-0.6786[/C][C]0.249523[/C][/ROW]
[ROW][C]14[/C][C]-0.035734[/C][C]-0.3501[/C][C]0.363508[/C][/ROW]
[ROW][C]15[/C][C]-0.055007[/C][C]-0.539[/C][C]0.295583[/C][/ROW]
[ROW][C]16[/C][C]-0.00979[/C][C]-0.0959[/C][C]0.461891[/C][/ROW]
[ROW][C]17[/C][C]-0.141139[/C][C]-1.3829[/C][C]0.084956[/C][/ROW]
[ROW][C]18[/C][C]-0.118896[/C][C]-1.1649[/C][C]0.123465[/C][/ROW]
[ROW][C]19[/C][C]0.008099[/C][C]0.0793[/C][C]0.46846[/C][/ROW]
[ROW][C]20[/C][C]-0.013843[/C][C]-0.1356[/C][C]0.446196[/C][/ROW]
[ROW][C]21[/C][C]0.092063[/C][C]0.902[/C][C]0.184649[/C][/ROW]
[ROW][C]22[/C][C]0.017291[/C][C]0.1694[/C][C]0.432912[/C][/ROW]
[ROW][C]23[/C][C]0.018488[/C][C]0.1811[/C][C]0.428318[/C][/ROW]
[ROW][C]24[/C][C]-0.070715[/C][C]-0.6929[/C][C]0.245034[/C][/ROW]
[ROW][C]25[/C][C]0.009359[/C][C]0.0917[/C][C]0.463564[/C][/ROW]
[ROW][C]26[/C][C]-0.03147[/C][C]-0.3083[/C][C]0.379247[/C][/ROW]
[ROW][C]27[/C][C]-0.121252[/C][C]-1.188[/C][C]0.118878[/C][/ROW]
[ROW][C]28[/C][C]0.028123[/C][C]0.2755[/C][C]0.391745[/C][/ROW]
[ROW][C]29[/C][C]-0.066101[/C][C]-0.6477[/C][C]0.259378[/C][/ROW]
[ROW][C]30[/C][C]-0.064464[/C][C]-0.6316[/C][C]0.264568[/C][/ROW]
[ROW][C]31[/C][C]0.017306[/C][C]0.1696[/C][C]0.432855[/C][/ROW]
[ROW][C]32[/C][C]0.000543[/C][C]0.0053[/C][C]0.497885[/C][/ROW]
[ROW][C]33[/C][C]-0.017372[/C][C]-0.1702[/C][C]0.432603[/C][/ROW]
[ROW][C]34[/C][C]0.056956[/C][C]0.5581[/C][C]0.289053[/C][/ROW]
[ROW][C]35[/C][C]-0.135052[/C][C]-1.3232[/C][C]0.09445[/C][/ROW]
[ROW][C]36[/C][C]0.065364[/C][C]0.6404[/C][C]0.261707[/C][/ROW]
[/TABLE]
Source: https://freestatistics.org/blog/index.php?pk=63224&T=2

Globally Unique Identifier (entire table): ba.freestatistics.org/blog/index.php?pk=63224&T=2

As an alternative you can also use a QR Code:  

The GUIDs for individual cells are displayed in the table below:

Partial Autocorrelation Function
Time lag kPACF(k)T-STATP-value
10.1734641.69960.046223
2-0.180647-1.770.039954
30.0903430.88520.189137
4-0.036632-0.35890.360221
50.3851823.7740.000139
60.2744412.6890.004226
70.385123.77340.000139
80.0651790.63860.262296
90.0825390.80870.21034
10-0.484597-4.74814e-06
11-0.100265-0.98240.164189
120.5264435.15811e-06
13-0.069256-0.67860.249523
14-0.035734-0.35010.363508
15-0.055007-0.5390.295583
16-0.00979-0.09590.461891
17-0.141139-1.38290.084956
18-0.118896-1.16490.123465
190.0080990.07930.46846
20-0.013843-0.13560.446196
210.0920630.9020.184649
220.0172910.16940.432912
230.0184880.18110.428318
24-0.070715-0.69290.245034
250.0093590.09170.463564
26-0.03147-0.30830.379247
27-0.121252-1.1880.118878
280.0281230.27550.391745
29-0.066101-0.64770.259378
30-0.064464-0.63160.264568
310.0173060.16960.432855
320.0005430.00530.497885
33-0.017372-0.17020.432603
340.0569560.55810.289053
35-0.135052-1.32320.09445
360.0653640.64040.261707


Parameters (Session):
par1 = 12 ;
Parameters (R input):
par1 = 36 ; par2 = 0.0 ; par3 = 0 ; par4 = 0 ; par5 = 12 ; par6 = MA ; par7 = 0.95 ;
R code (references can be found in the software module):
if (par1 == 'Default') {
par1 = 10*log10(length(x))
} else {
par1 <- as.numeric(par1)
}
par2 <- as.numeric(par2)
par3 <- as.numeric(par3)
par4 <- as.numeric(par4)
par5 <- as.numeric(par5)
if (par6 == 'White Noise') par6 <- 'white' else par6 <- 'ma'
par7 <- as.numeric(par7)
if (par2 == 0) {
x <- log(x)
} else {
x <- (x ^ par2 - 1) / par2
}
if (par3 > 0) x <- diff(x,lag=1,difference=par3)
if (par4 > 0) x <- diff(x,lag=par5,difference=par4)
bitmap(file='pic1.png')
racf <- acf(x, par1, main='Autocorrelation', xlab='time lag', ylab='ACF', ci.type=par6, ci=par7, sub=paste('(lambda=',par2,', d=',par3,', D=',par4,', CI=', par7, ', CI type=',par6,')',sep=''))
dev.off()
bitmap(file='pic2.png')
rpacf <- pacf(x,par1,main='Partial Autocorrelation',xlab='lags',ylab='PACF')
dev.off()
(myacf <- c(racf$acf))
(mypacf <- c(rpacf$acf))
lengthx <- length(x)
sqrtn <- sqrt(lengthx)
load(file='createtable')
a<-table.start()
a<-table.row.start(a)
a<-table.element(a,'Autocorrelation Function',4,TRUE)
a<-table.row.end(a)
a<-table.row.start(a)
a<-table.element(a,'Time lag k',header=TRUE)
a<-table.element(a,hyperlink('basics.htm','ACF(k)','click here for more information about the Autocorrelation Function'),header=TRUE)
a<-table.element(a,'T-STAT',header=TRUE)
a<-table.element(a,'P-value',header=TRUE)
a<-table.row.end(a)
for (i in 2:(par1+1)) {
a<-table.row.start(a)
a<-table.element(a,i-1,header=TRUE)
a<-table.element(a,round(myacf[i],6))
mytstat <- myacf[i]*sqrtn
a<-table.element(a,round(mytstat,4))
a<-table.element(a,round(1-pt(abs(mytstat),lengthx),6))
a<-table.row.end(a)
}
a<-table.end(a)
table.save(a,file='mytable.tab')
a<-table.start()
a<-table.row.start(a)
a<-table.element(a,'Partial Autocorrelation Function',4,TRUE)
a<-table.row.end(a)
a<-table.row.start(a)
a<-table.element(a,'Time lag k',header=TRUE)
a<-table.element(a,hyperlink('basics.htm','PACF(k)','click here for more information about the Partial Autocorrelation Function'),header=TRUE)
a<-table.element(a,'T-STAT',header=TRUE)
a<-table.element(a,'P-value',header=TRUE)
a<-table.row.end(a)
for (i in 1:par1) {
a<-table.row.start(a)
a<-table.element(a,i,header=TRUE)
a<-table.element(a,round(mypacf[i],6))
mytstat <- mypacf[i]*sqrtn
a<-table.element(a,round(mytstat,4))
a<-table.element(a,round(1-pt(abs(mytstat),lengthx),6))
a<-table.row.end(a)
}
a<-table.end(a)
table.save(a,file='mytable1.tab')