Free Statistics

of Irreproducible Research!

Author's title

Author*The author of this computation has been verified*
R Software Modulerwasp_autocorrelation.wasp
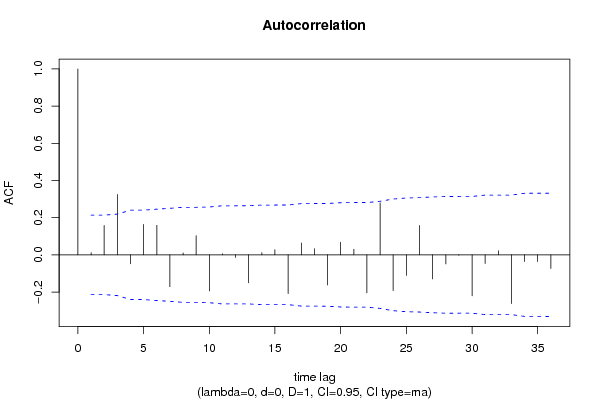
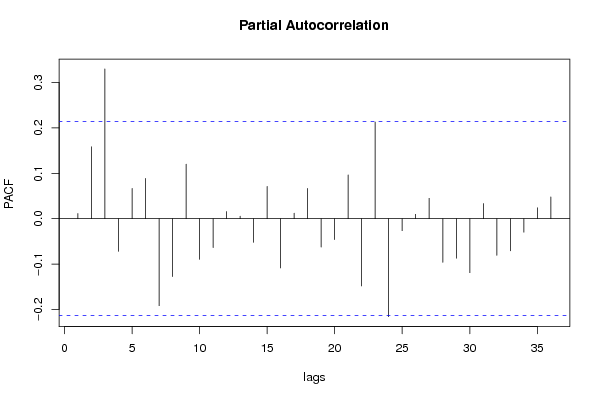
Title produced by software(Partial) Autocorrelation Function
Date of computationFri, 04 Dec 2009 03:02:05 -0700
Cite this page as followsStatistical Computations at FreeStatistics.org, Office for Research Development and Education, URL https://freestatistics.org/blog/index.php?v=date/2009/Dec/04/t1259921014zj9tlgnll8u2g2w.htm/, Retrieved Sun, 28 Apr 2024 18:52:45 +0000
Statistical Computations at FreeStatistics.org, Office for Research Development and Education, URL https://freestatistics.org/blog/index.php?pk=63227, Retrieved Sun, 28 Apr 2024 18:52:45 +0000
QR Codes:

Original text written by user:
IsPrivate?No (this computation is public)
User-defined keywords
Estimated Impact123
Family? (F = Feedback message, R = changed R code, M = changed R Module, P = changed Parameters, D = changed Data)
-     [Univariate Data Series] [data set] [2008-12-01 19:54:57] [b98453cac15ba1066b407e146608df68]
- RMP   [(Partial) Autocorrelation Function] [] [2009-11-27 14:46:03] [b98453cac15ba1066b407e146608df68]
-   PD    [(Partial) Autocorrelation Function] [WS 9 (P)ACF 1] [2009-12-04 10:00:10] [83058a88a37d754675a5cd22dab372fc]
-             [(Partial) Autocorrelation Function] [WS 9 (P)ACF 2] [2009-12-04 10:02:05] [eba9f01697e64705b70041e6f338cb22] [Current]
-   P           [(Partial) Autocorrelation Function] [WS9 aanvulling] [2009-12-09 22:06:03] [e0fc65a5811681d807296d590d5b45de]
Feedback Forum

Post a new message
Dataseries X:
98.8
100.5
110.4
96.4
101.9
106.2
81
94.7
101
109.4
102.3
90.7
96.2
96.1
106
103.1
102
104.7
86
92.1
106.9
112.6
101.7
92
97.4
97
105.4
102.7
98.1
104.5
87.4
89.9
109.8
111.7
98.6
96.9
95.1
97
112.7
102.9
97.4
111.4
87.4
96.8
114.1
110.3
103.9
101.6
94.6
95.9
104.7
102.8
98.1
113.9
80.9
95.7
113.2
105.9
108.8
102.3
99
100.7
115.5
100.7
109.9
114.6
85.4
100.5
114.8
116.5
112.9
102
106
105.3
118.8
106.1
109.3
117.2
92.5
104.2
112.5
122.4
113.3
100
110.7
112.8
109.8
117.3
109.1
115.9
96
99.8
116.8
115.7
99.4
94.3


Summary of computational transaction
Raw Inputview raw input (R code)
Raw Outputview raw output of R engine
Computing time2 seconds
R Server'Gwilym Jenkins' @ 72.249.127.135

\begin{tabular}{lllllllll}
\hline
Summary of computational transaction \tabularnewline
Raw Input & view raw input (R code)  \tabularnewline
Raw Output & view raw output of R engine  \tabularnewline
Computing time & 2 seconds \tabularnewline
R Server & 'Gwilym Jenkins' @ 72.249.127.135 \tabularnewline
\hline
\end{tabular}
%Source: https://freestatistics.org/blog/index.php?pk=63227&T=0

[TABLE]
[ROW][C]Summary of computational transaction[/C][/ROW]
[ROW][C]Raw Input[/C][C]view raw input (R code) [/C][/ROW]
[ROW][C]Raw Output[/C][C]view raw output of R engine [/C][/ROW]
[ROW][C]Computing time[/C][C]2 seconds[/C][/ROW]
[ROW][C]R Server[/C][C]'Gwilym Jenkins' @ 72.249.127.135[/C][/ROW]
[/TABLE]
Source: https://freestatistics.org/blog/index.php?pk=63227&T=0

Globally Unique Identifier (entire table): ba.freestatistics.org/blog/index.php?pk=63227&T=0

As an alternative you can also use a QR Code:  

The GUIDs for individual cells are displayed in the table below:

Summary of computational transaction
Raw Inputview raw input (R code)
Raw Outputview raw output of R engine
Computing time2 seconds
R Server'Gwilym Jenkins' @ 72.249.127.135


Autocorrelation Function
Time lag kACF(k)T-STATP-value
10.0113650.10420.458644
20.1584871.45260.075036
30.3251122.97970.001886
4-0.048166-0.44150.33001
50.1636331.49970.068718
60.1591831.45890.074156
7-0.171681-1.57350.059683
80.0101630.09310.463003
90.1028430.94260.174301
10-0.193869-1.77680.039608
110.0053930.04940.480348
12-0.013936-0.12770.449334
13-0.15033-1.37780.085963
140.0112990.10360.458882
150.0280210.25680.398975
16-0.208438-1.91040.029749
170.0632680.57990.28178
180.0330470.30290.381364
19-0.161705-1.4820.071035
200.0682850.62580.266557
210.0295430.27080.393618
22-0.20456-1.87480.032146
230.2801952.5680.005999
24-0.192466-1.7640.040685
25-0.110532-1.0130.156974
260.1581391.44940.075479
27-0.129719-1.18890.118916
28-0.049121-0.45020.326862
29-0.002291-0.0210.491647
30-0.220606-2.02190.023186
31-0.046484-0.4260.335588
320.0217560.19940.421217
33-0.261841-2.39980.009307
34-0.036364-0.33330.369877
35-0.036307-0.33280.370074
36-0.073275-0.67160.251848

\begin{tabular}{lllllllll}
\hline
Autocorrelation Function \tabularnewline
Time lag k & ACF(k) & T-STAT & P-value \tabularnewline
1 & 0.011365 & 0.1042 & 0.458644 \tabularnewline
2 & 0.158487 & 1.4526 & 0.075036 \tabularnewline
3 & 0.325112 & 2.9797 & 0.001886 \tabularnewline
4 & -0.048166 & -0.4415 & 0.33001 \tabularnewline
5 & 0.163633 & 1.4997 & 0.068718 \tabularnewline
6 & 0.159183 & 1.4589 & 0.074156 \tabularnewline
7 & -0.171681 & -1.5735 & 0.059683 \tabularnewline
8 & 0.010163 & 0.0931 & 0.463003 \tabularnewline
9 & 0.102843 & 0.9426 & 0.174301 \tabularnewline
10 & -0.193869 & -1.7768 & 0.039608 \tabularnewline
11 & 0.005393 & 0.0494 & 0.480348 \tabularnewline
12 & -0.013936 & -0.1277 & 0.449334 \tabularnewline
13 & -0.15033 & -1.3778 & 0.085963 \tabularnewline
14 & 0.011299 & 0.1036 & 0.458882 \tabularnewline
15 & 0.028021 & 0.2568 & 0.398975 \tabularnewline
16 & -0.208438 & -1.9104 & 0.029749 \tabularnewline
17 & 0.063268 & 0.5799 & 0.28178 \tabularnewline
18 & 0.033047 & 0.3029 & 0.381364 \tabularnewline
19 & -0.161705 & -1.482 & 0.071035 \tabularnewline
20 & 0.068285 & 0.6258 & 0.266557 \tabularnewline
21 & 0.029543 & 0.2708 & 0.393618 \tabularnewline
22 & -0.20456 & -1.8748 & 0.032146 \tabularnewline
23 & 0.280195 & 2.568 & 0.005999 \tabularnewline
24 & -0.192466 & -1.764 & 0.040685 \tabularnewline
25 & -0.110532 & -1.013 & 0.156974 \tabularnewline
26 & 0.158139 & 1.4494 & 0.075479 \tabularnewline
27 & -0.129719 & -1.1889 & 0.118916 \tabularnewline
28 & -0.049121 & -0.4502 & 0.326862 \tabularnewline
29 & -0.002291 & -0.021 & 0.491647 \tabularnewline
30 & -0.220606 & -2.0219 & 0.023186 \tabularnewline
31 & -0.046484 & -0.426 & 0.335588 \tabularnewline
32 & 0.021756 & 0.1994 & 0.421217 \tabularnewline
33 & -0.261841 & -2.3998 & 0.009307 \tabularnewline
34 & -0.036364 & -0.3333 & 0.369877 \tabularnewline
35 & -0.036307 & -0.3328 & 0.370074 \tabularnewline
36 & -0.073275 & -0.6716 & 0.251848 \tabularnewline
\hline
\end{tabular}
%Source: https://freestatistics.org/blog/index.php?pk=63227&T=1

[TABLE]
[ROW][C]Autocorrelation Function[/C][/ROW]
[ROW][C]Time lag k[/C][C]ACF(k)[/C][C]T-STAT[/C][C]P-value[/C][/ROW]
[ROW][C]1[/C][C]0.011365[/C][C]0.1042[/C][C]0.458644[/C][/ROW]
[ROW][C]2[/C][C]0.158487[/C][C]1.4526[/C][C]0.075036[/C][/ROW]
[ROW][C]3[/C][C]0.325112[/C][C]2.9797[/C][C]0.001886[/C][/ROW]
[ROW][C]4[/C][C]-0.048166[/C][C]-0.4415[/C][C]0.33001[/C][/ROW]
[ROW][C]5[/C][C]0.163633[/C][C]1.4997[/C][C]0.068718[/C][/ROW]
[ROW][C]6[/C][C]0.159183[/C][C]1.4589[/C][C]0.074156[/C][/ROW]
[ROW][C]7[/C][C]-0.171681[/C][C]-1.5735[/C][C]0.059683[/C][/ROW]
[ROW][C]8[/C][C]0.010163[/C][C]0.0931[/C][C]0.463003[/C][/ROW]
[ROW][C]9[/C][C]0.102843[/C][C]0.9426[/C][C]0.174301[/C][/ROW]
[ROW][C]10[/C][C]-0.193869[/C][C]-1.7768[/C][C]0.039608[/C][/ROW]
[ROW][C]11[/C][C]0.005393[/C][C]0.0494[/C][C]0.480348[/C][/ROW]
[ROW][C]12[/C][C]-0.013936[/C][C]-0.1277[/C][C]0.449334[/C][/ROW]
[ROW][C]13[/C][C]-0.15033[/C][C]-1.3778[/C][C]0.085963[/C][/ROW]
[ROW][C]14[/C][C]0.011299[/C][C]0.1036[/C][C]0.458882[/C][/ROW]
[ROW][C]15[/C][C]0.028021[/C][C]0.2568[/C][C]0.398975[/C][/ROW]
[ROW][C]16[/C][C]-0.208438[/C][C]-1.9104[/C][C]0.029749[/C][/ROW]
[ROW][C]17[/C][C]0.063268[/C][C]0.5799[/C][C]0.28178[/C][/ROW]
[ROW][C]18[/C][C]0.033047[/C][C]0.3029[/C][C]0.381364[/C][/ROW]
[ROW][C]19[/C][C]-0.161705[/C][C]-1.482[/C][C]0.071035[/C][/ROW]
[ROW][C]20[/C][C]0.068285[/C][C]0.6258[/C][C]0.266557[/C][/ROW]
[ROW][C]21[/C][C]0.029543[/C][C]0.2708[/C][C]0.393618[/C][/ROW]
[ROW][C]22[/C][C]-0.20456[/C][C]-1.8748[/C][C]0.032146[/C][/ROW]
[ROW][C]23[/C][C]0.280195[/C][C]2.568[/C][C]0.005999[/C][/ROW]
[ROW][C]24[/C][C]-0.192466[/C][C]-1.764[/C][C]0.040685[/C][/ROW]
[ROW][C]25[/C][C]-0.110532[/C][C]-1.013[/C][C]0.156974[/C][/ROW]
[ROW][C]26[/C][C]0.158139[/C][C]1.4494[/C][C]0.075479[/C][/ROW]
[ROW][C]27[/C][C]-0.129719[/C][C]-1.1889[/C][C]0.118916[/C][/ROW]
[ROW][C]28[/C][C]-0.049121[/C][C]-0.4502[/C][C]0.326862[/C][/ROW]
[ROW][C]29[/C][C]-0.002291[/C][C]-0.021[/C][C]0.491647[/C][/ROW]
[ROW][C]30[/C][C]-0.220606[/C][C]-2.0219[/C][C]0.023186[/C][/ROW]
[ROW][C]31[/C][C]-0.046484[/C][C]-0.426[/C][C]0.335588[/C][/ROW]
[ROW][C]32[/C][C]0.021756[/C][C]0.1994[/C][C]0.421217[/C][/ROW]
[ROW][C]33[/C][C]-0.261841[/C][C]-2.3998[/C][C]0.009307[/C][/ROW]
[ROW][C]34[/C][C]-0.036364[/C][C]-0.3333[/C][C]0.369877[/C][/ROW]
[ROW][C]35[/C][C]-0.036307[/C][C]-0.3328[/C][C]0.370074[/C][/ROW]
[ROW][C]36[/C][C]-0.073275[/C][C]-0.6716[/C][C]0.251848[/C][/ROW]
[/TABLE]
Source: https://freestatistics.org/blog/index.php?pk=63227&T=1

Globally Unique Identifier (entire table): ba.freestatistics.org/blog/index.php?pk=63227&T=1

As an alternative you can also use a QR Code:  

The GUIDs for individual cells are displayed in the table below:

Autocorrelation Function
Time lag kACF(k)T-STATP-value
10.0113650.10420.458644
20.1584871.45260.075036
30.3251122.97970.001886
4-0.048166-0.44150.33001
50.1636331.49970.068718
60.1591831.45890.074156
7-0.171681-1.57350.059683
80.0101630.09310.463003
90.1028430.94260.174301
10-0.193869-1.77680.039608
110.0053930.04940.480348
12-0.013936-0.12770.449334
13-0.15033-1.37780.085963
140.0112990.10360.458882
150.0280210.25680.398975
16-0.208438-1.91040.029749
170.0632680.57990.28178
180.0330470.30290.381364
19-0.161705-1.4820.071035
200.0682850.62580.266557
210.0295430.27080.393618
22-0.20456-1.87480.032146
230.2801952.5680.005999
24-0.192466-1.7640.040685
25-0.110532-1.0130.156974
260.1581391.44940.075479
27-0.129719-1.18890.118916
28-0.049121-0.45020.326862
29-0.002291-0.0210.491647
30-0.220606-2.02190.023186
31-0.046484-0.4260.335588
320.0217560.19940.421217
33-0.261841-2.39980.009307
34-0.036364-0.33330.369877
35-0.036307-0.33280.370074
36-0.073275-0.67160.251848


Partial Autocorrelation Function
Time lag kPACF(k)T-STATP-value
10.0113650.10420.458644
20.1583781.45160.075174
30.3301183.02560.001646
4-0.072108-0.66090.255248
50.0666720.61110.271405
60.0885960.8120.209543
7-0.19203-1.760.041025
8-0.127806-1.17140.122382
90.1200081.09990.137261
10-0.08956-0.82080.207033
11-0.063872-0.58540.279926
120.0156430.14340.443169
130.0054290.04980.480216
14-0.052085-0.47740.31717
150.0709750.65050.258573
16-0.108815-0.99730.160739
170.0120710.11060.456084
180.0666670.6110.271421
19-0.062617-0.57390.283788
20-0.046198-0.42340.336538
210.0964850.88430.189529
22-0.148426-1.36040.088679
230.2130671.95280.027087
24-0.216097-1.98060.025457
25-0.026621-0.2440.403918
260.0095450.08750.46525
270.0448530.41110.341029
28-0.096312-0.88270.189956
29-0.087291-0.80.212974
30-0.119273-1.09320.138726
310.0332920.30510.380514
32-0.080913-0.74160.230206
33-0.070865-0.64950.258897
34-0.029781-0.2730.392781
350.0240310.22020.413107
360.0478960.4390.330904

\begin{tabular}{lllllllll}
\hline
Partial Autocorrelation Function \tabularnewline
Time lag k & PACF(k) & T-STAT & P-value \tabularnewline
1 & 0.011365 & 0.1042 & 0.458644 \tabularnewline
2 & 0.158378 & 1.4516 & 0.075174 \tabularnewline
3 & 0.330118 & 3.0256 & 0.001646 \tabularnewline
4 & -0.072108 & -0.6609 & 0.255248 \tabularnewline
5 & 0.066672 & 0.6111 & 0.271405 \tabularnewline
6 & 0.088596 & 0.812 & 0.209543 \tabularnewline
7 & -0.19203 & -1.76 & 0.041025 \tabularnewline
8 & -0.127806 & -1.1714 & 0.122382 \tabularnewline
9 & 0.120008 & 1.0999 & 0.137261 \tabularnewline
10 & -0.08956 & -0.8208 & 0.207033 \tabularnewline
11 & -0.063872 & -0.5854 & 0.279926 \tabularnewline
12 & 0.015643 & 0.1434 & 0.443169 \tabularnewline
13 & 0.005429 & 0.0498 & 0.480216 \tabularnewline
14 & -0.052085 & -0.4774 & 0.31717 \tabularnewline
15 & 0.070975 & 0.6505 & 0.258573 \tabularnewline
16 & -0.108815 & -0.9973 & 0.160739 \tabularnewline
17 & 0.012071 & 0.1106 & 0.456084 \tabularnewline
18 & 0.066667 & 0.611 & 0.271421 \tabularnewline
19 & -0.062617 & -0.5739 & 0.283788 \tabularnewline
20 & -0.046198 & -0.4234 & 0.336538 \tabularnewline
21 & 0.096485 & 0.8843 & 0.189529 \tabularnewline
22 & -0.148426 & -1.3604 & 0.088679 \tabularnewline
23 & 0.213067 & 1.9528 & 0.027087 \tabularnewline
24 & -0.216097 & -1.9806 & 0.025457 \tabularnewline
25 & -0.026621 & -0.244 & 0.403918 \tabularnewline
26 & 0.009545 & 0.0875 & 0.46525 \tabularnewline
27 & 0.044853 & 0.4111 & 0.341029 \tabularnewline
28 & -0.096312 & -0.8827 & 0.189956 \tabularnewline
29 & -0.087291 & -0.8 & 0.212974 \tabularnewline
30 & -0.119273 & -1.0932 & 0.138726 \tabularnewline
31 & 0.033292 & 0.3051 & 0.380514 \tabularnewline
32 & -0.080913 & -0.7416 & 0.230206 \tabularnewline
33 & -0.070865 & -0.6495 & 0.258897 \tabularnewline
34 & -0.029781 & -0.273 & 0.392781 \tabularnewline
35 & 0.024031 & 0.2202 & 0.413107 \tabularnewline
36 & 0.047896 & 0.439 & 0.330904 \tabularnewline
\hline
\end{tabular}
%Source: https://freestatistics.org/blog/index.php?pk=63227&T=2

[TABLE]
[ROW][C]Partial Autocorrelation Function[/C][/ROW]
[ROW][C]Time lag k[/C][C]PACF(k)[/C][C]T-STAT[/C][C]P-value[/C][/ROW]
[ROW][C]1[/C][C]0.011365[/C][C]0.1042[/C][C]0.458644[/C][/ROW]
[ROW][C]2[/C][C]0.158378[/C][C]1.4516[/C][C]0.075174[/C][/ROW]
[ROW][C]3[/C][C]0.330118[/C][C]3.0256[/C][C]0.001646[/C][/ROW]
[ROW][C]4[/C][C]-0.072108[/C][C]-0.6609[/C][C]0.255248[/C][/ROW]
[ROW][C]5[/C][C]0.066672[/C][C]0.6111[/C][C]0.271405[/C][/ROW]
[ROW][C]6[/C][C]0.088596[/C][C]0.812[/C][C]0.209543[/C][/ROW]
[ROW][C]7[/C][C]-0.19203[/C][C]-1.76[/C][C]0.041025[/C][/ROW]
[ROW][C]8[/C][C]-0.127806[/C][C]-1.1714[/C][C]0.122382[/C][/ROW]
[ROW][C]9[/C][C]0.120008[/C][C]1.0999[/C][C]0.137261[/C][/ROW]
[ROW][C]10[/C][C]-0.08956[/C][C]-0.8208[/C][C]0.207033[/C][/ROW]
[ROW][C]11[/C][C]-0.063872[/C][C]-0.5854[/C][C]0.279926[/C][/ROW]
[ROW][C]12[/C][C]0.015643[/C][C]0.1434[/C][C]0.443169[/C][/ROW]
[ROW][C]13[/C][C]0.005429[/C][C]0.0498[/C][C]0.480216[/C][/ROW]
[ROW][C]14[/C][C]-0.052085[/C][C]-0.4774[/C][C]0.31717[/C][/ROW]
[ROW][C]15[/C][C]0.070975[/C][C]0.6505[/C][C]0.258573[/C][/ROW]
[ROW][C]16[/C][C]-0.108815[/C][C]-0.9973[/C][C]0.160739[/C][/ROW]
[ROW][C]17[/C][C]0.012071[/C][C]0.1106[/C][C]0.456084[/C][/ROW]
[ROW][C]18[/C][C]0.066667[/C][C]0.611[/C][C]0.271421[/C][/ROW]
[ROW][C]19[/C][C]-0.062617[/C][C]-0.5739[/C][C]0.283788[/C][/ROW]
[ROW][C]20[/C][C]-0.046198[/C][C]-0.4234[/C][C]0.336538[/C][/ROW]
[ROW][C]21[/C][C]0.096485[/C][C]0.8843[/C][C]0.189529[/C][/ROW]
[ROW][C]22[/C][C]-0.148426[/C][C]-1.3604[/C][C]0.088679[/C][/ROW]
[ROW][C]23[/C][C]0.213067[/C][C]1.9528[/C][C]0.027087[/C][/ROW]
[ROW][C]24[/C][C]-0.216097[/C][C]-1.9806[/C][C]0.025457[/C][/ROW]
[ROW][C]25[/C][C]-0.026621[/C][C]-0.244[/C][C]0.403918[/C][/ROW]
[ROW][C]26[/C][C]0.009545[/C][C]0.0875[/C][C]0.46525[/C][/ROW]
[ROW][C]27[/C][C]0.044853[/C][C]0.4111[/C][C]0.341029[/C][/ROW]
[ROW][C]28[/C][C]-0.096312[/C][C]-0.8827[/C][C]0.189956[/C][/ROW]
[ROW][C]29[/C][C]-0.087291[/C][C]-0.8[/C][C]0.212974[/C][/ROW]
[ROW][C]30[/C][C]-0.119273[/C][C]-1.0932[/C][C]0.138726[/C][/ROW]
[ROW][C]31[/C][C]0.033292[/C][C]0.3051[/C][C]0.380514[/C][/ROW]
[ROW][C]32[/C][C]-0.080913[/C][C]-0.7416[/C][C]0.230206[/C][/ROW]
[ROW][C]33[/C][C]-0.070865[/C][C]-0.6495[/C][C]0.258897[/C][/ROW]
[ROW][C]34[/C][C]-0.029781[/C][C]-0.273[/C][C]0.392781[/C][/ROW]
[ROW][C]35[/C][C]0.024031[/C][C]0.2202[/C][C]0.413107[/C][/ROW]
[ROW][C]36[/C][C]0.047896[/C][C]0.439[/C][C]0.330904[/C][/ROW]
[/TABLE]
Source: https://freestatistics.org/blog/index.php?pk=63227&T=2

Globally Unique Identifier (entire table): ba.freestatistics.org/blog/index.php?pk=63227&T=2

As an alternative you can also use a QR Code:  

The GUIDs for individual cells are displayed in the table below:

Partial Autocorrelation Function
Time lag kPACF(k)T-STATP-value
10.0113650.10420.458644
20.1583781.45160.075174
30.3301183.02560.001646
4-0.072108-0.66090.255248
50.0666720.61110.271405
60.0885960.8120.209543
7-0.19203-1.760.041025
8-0.127806-1.17140.122382
90.1200081.09990.137261
10-0.08956-0.82080.207033
11-0.063872-0.58540.279926
120.0156430.14340.443169
130.0054290.04980.480216
14-0.052085-0.47740.31717
150.0709750.65050.258573
16-0.108815-0.99730.160739
170.0120710.11060.456084
180.0666670.6110.271421
19-0.062617-0.57390.283788
20-0.046198-0.42340.336538
210.0964850.88430.189529
22-0.148426-1.36040.088679
230.2130671.95280.027087
24-0.216097-1.98060.025457
25-0.026621-0.2440.403918
260.0095450.08750.46525
270.0448530.41110.341029
28-0.096312-0.88270.189956
29-0.087291-0.80.212974
30-0.119273-1.09320.138726
310.0332920.30510.380514
32-0.080913-0.74160.230206
33-0.070865-0.64950.258897
34-0.029781-0.2730.392781
350.0240310.22020.413107
360.0478960.4390.330904


Parameters (Session):
par1 = 12 ;
Parameters (R input):
par1 = 36 ; par2 = 0.0 ; par3 = 0 ; par4 = 1 ; par5 = 12 ; par6 = MA ; par7 = 0.95 ;
R code (references can be found in the software module):
if (par1 == 'Default') {
par1 = 10*log10(length(x))
} else {
par1 <- as.numeric(par1)
}
par2 <- as.numeric(par2)
par3 <- as.numeric(par3)
par4 <- as.numeric(par4)
par5 <- as.numeric(par5)
if (par6 == 'White Noise') par6 <- 'white' else par6 <- 'ma'
par7 <- as.numeric(par7)
if (par2 == 0) {
x <- log(x)
} else {
x <- (x ^ par2 - 1) / par2
}
if (par3 > 0) x <- diff(x,lag=1,difference=par3)
if (par4 > 0) x <- diff(x,lag=par5,difference=par4)
bitmap(file='pic1.png')
racf <- acf(x, par1, main='Autocorrelation', xlab='time lag', ylab='ACF', ci.type=par6, ci=par7, sub=paste('(lambda=',par2,', d=',par3,', D=',par4,', CI=', par7, ', CI type=',par6,')',sep=''))
dev.off()
bitmap(file='pic2.png')
rpacf <- pacf(x,par1,main='Partial Autocorrelation',xlab='lags',ylab='PACF')
dev.off()
(myacf <- c(racf$acf))
(mypacf <- c(rpacf$acf))
lengthx <- length(x)
sqrtn <- sqrt(lengthx)
load(file='createtable')
a<-table.start()
a<-table.row.start(a)
a<-table.element(a,'Autocorrelation Function',4,TRUE)
a<-table.row.end(a)
a<-table.row.start(a)
a<-table.element(a,'Time lag k',header=TRUE)
a<-table.element(a,hyperlink('basics.htm','ACF(k)','click here for more information about the Autocorrelation Function'),header=TRUE)
a<-table.element(a,'T-STAT',header=TRUE)
a<-table.element(a,'P-value',header=TRUE)
a<-table.row.end(a)
for (i in 2:(par1+1)) {
a<-table.row.start(a)
a<-table.element(a,i-1,header=TRUE)
a<-table.element(a,round(myacf[i],6))
mytstat <- myacf[i]*sqrtn
a<-table.element(a,round(mytstat,4))
a<-table.element(a,round(1-pt(abs(mytstat),lengthx),6))
a<-table.row.end(a)
}
a<-table.end(a)
table.save(a,file='mytable.tab')
a<-table.start()
a<-table.row.start(a)
a<-table.element(a,'Partial Autocorrelation Function',4,TRUE)
a<-table.row.end(a)
a<-table.row.start(a)
a<-table.element(a,'Time lag k',header=TRUE)
a<-table.element(a,hyperlink('basics.htm','PACF(k)','click here for more information about the Partial Autocorrelation Function'),header=TRUE)
a<-table.element(a,'T-STAT',header=TRUE)
a<-table.element(a,'P-value',header=TRUE)
a<-table.row.end(a)
for (i in 1:par1) {
a<-table.row.start(a)
a<-table.element(a,i,header=TRUE)
a<-table.element(a,round(mypacf[i],6))
mytstat <- mypacf[i]*sqrtn
a<-table.element(a,round(mytstat,4))
a<-table.element(a,round(1-pt(abs(mytstat),lengthx),6))
a<-table.row.end(a)
}
a<-table.end(a)
table.save(a,file='mytable1.tab')