Free Statistics

of Irreproducible Research!

Author's title

Author*The author of this computation has been verified*
R Software Modulerwasp_smp.wasp
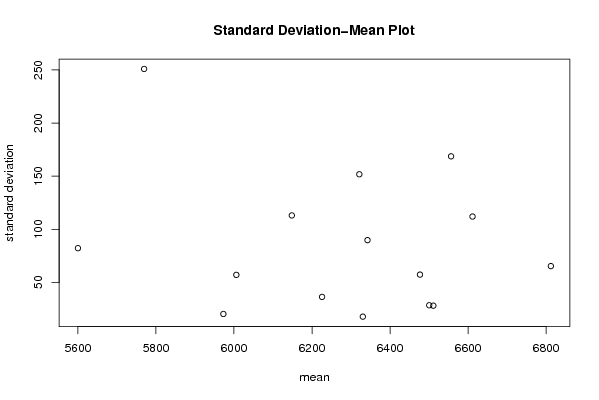
Title produced by softwareStandard Deviation-Mean Plot
Date of computationFri, 04 Dec 2009 03:04:58 -0700
Cite this page as followsStatistical Computations at FreeStatistics.org, Office for Research Development and Education, URL https://freestatistics.org/blog/index.php?v=date/2009/Dec/04/t1259922215i2q3nppgyemvrp3.htm/, Retrieved Sat, 27 Apr 2024 19:09:11 +0000
Statistical Computations at FreeStatistics.org, Office for Research Development and Education, URL https://freestatistics.org/blog/index.php?pk=63243, Retrieved Sat, 27 Apr 2024 19:09:11 +0000
QR Codes:

Original text written by user:
IsPrivate?No (this computation is public)
User-defined keywords
Estimated Impact119
Family? (F = Feedback message, R = changed R code, M = changed R Module, P = changed Parameters, D = changed Data)
-       [Standard Deviation-Mean Plot] [standard deviatio...] [2009-12-04 10:04:58] [b243db81ea3e1f02fb3382887fb0f701] [Current]
Feedback Forum

Post a new message
Dataseries X:
5594
5585
5710
5511
5403
5826
5884
5965
5960
6064
6046
5954
5952
5960
5983
5996
6021
6094
6202
6276
6306
6342
6345
6328
6191
6261
6253
6198
6247
6293
6381
6448
6470
6516
6532
6526
6533
6498
6507
6464
6453
6468
6497
6808
6793
6907
6792
6757
6734
6654
6589
6469
6521
6448
6410
6528
6445
6458
6215
6167


Summary of computational transaction
Raw Inputview raw input (R code)
Raw Outputview raw output of R engine
Computing time1 seconds
R Server'Gwilym Jenkins' @ 72.249.127.135

\begin{tabular}{lllllllll}
\hline
Summary of computational transaction \tabularnewline
Raw Input & view raw input (R code)  \tabularnewline
Raw Output & view raw output of R engine  \tabularnewline
Computing time & 1 seconds \tabularnewline
R Server & 'Gwilym Jenkins' @ 72.249.127.135 \tabularnewline
\hline
\end{tabular}
%Source: https://freestatistics.org/blog/index.php?pk=63243&T=0

[TABLE]
[ROW][C]Summary of computational transaction[/C][/ROW]
[ROW][C]Raw Input[/C][C]view raw input (R code) [/C][/ROW]
[ROW][C]Raw Output[/C][C]view raw output of R engine [/C][/ROW]
[ROW][C]Computing time[/C][C]1 seconds[/C][/ROW]
[ROW][C]R Server[/C][C]'Gwilym Jenkins' @ 72.249.127.135[/C][/ROW]
[/TABLE]
Source: https://freestatistics.org/blog/index.php?pk=63243&T=0

Globally Unique Identifier (entire table): ba.freestatistics.org/blog/index.php?pk=63243&T=0

As an alternative you can also use a QR Code:  

The GUIDs for individual cells are displayed in the table below:

Summary of computational transaction
Raw Inputview raw input (R code)
Raw Outputview raw output of R engine
Computing time1 seconds
R Server'Gwilym Jenkins' @ 72.249.127.135


Standard Deviation-Mean Plot
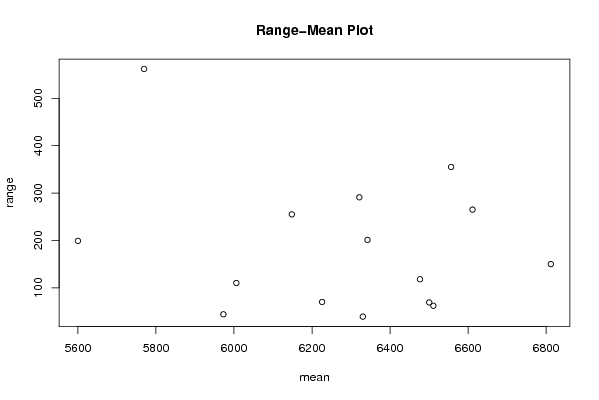
SectionMeanStandard DeviationRange
1560082.2232732665555199
25769.5250.895064386156562
3600657.1080846582455110
45972.7520.320351046836444
56148.25113.055664755612255
66330.2517.783419243778739
76225.7536.344417269598270
86342.2589.7826078183668201
9651128.118795611950962
106500.528.501461950807669
116556.5168.658431946543355
126812.2565.347149899594150
136611.5111.989582848882265
146476.7557.3490772956869118
156321.25151.763796736903291

\begin{tabular}{lllllllll}
\hline
Standard Deviation-Mean Plot \tabularnewline
Section & Mean & Standard Deviation & Range \tabularnewline
1 & 5600 & 82.2232732665555 & 199 \tabularnewline
2 & 5769.5 & 250.895064386156 & 562 \tabularnewline
3 & 6006 & 57.1080846582455 & 110 \tabularnewline
4 & 5972.75 & 20.3203510468364 & 44 \tabularnewline
5 & 6148.25 & 113.055664755612 & 255 \tabularnewline
6 & 6330.25 & 17.7834192437787 & 39 \tabularnewline
7 & 6225.75 & 36.3444172695982 & 70 \tabularnewline
8 & 6342.25 & 89.7826078183668 & 201 \tabularnewline
9 & 6511 & 28.1187956119509 & 62 \tabularnewline
10 & 6500.5 & 28.5014619508076 & 69 \tabularnewline
11 & 6556.5 & 168.658431946543 & 355 \tabularnewline
12 & 6812.25 & 65.347149899594 & 150 \tabularnewline
13 & 6611.5 & 111.989582848882 & 265 \tabularnewline
14 & 6476.75 & 57.3490772956869 & 118 \tabularnewline
15 & 6321.25 & 151.763796736903 & 291 \tabularnewline
\hline
\end{tabular}
%Source: https://freestatistics.org/blog/index.php?pk=63243&T=1

[TABLE]
[ROW][C]Standard Deviation-Mean Plot[/C][/ROW]
[ROW][C]Section[/C][C]Mean[/C][C]Standard Deviation[/C][C]Range[/C][/ROW]
[ROW][C]1[/C][C]5600[/C][C]82.2232732665555[/C][C]199[/C][/ROW]
[ROW][C]2[/C][C]5769.5[/C][C]250.895064386156[/C][C]562[/C][/ROW]
[ROW][C]3[/C][C]6006[/C][C]57.1080846582455[/C][C]110[/C][/ROW]
[ROW][C]4[/C][C]5972.75[/C][C]20.3203510468364[/C][C]44[/C][/ROW]
[ROW][C]5[/C][C]6148.25[/C][C]113.055664755612[/C][C]255[/C][/ROW]
[ROW][C]6[/C][C]6330.25[/C][C]17.7834192437787[/C][C]39[/C][/ROW]
[ROW][C]7[/C][C]6225.75[/C][C]36.3444172695982[/C][C]70[/C][/ROW]
[ROW][C]8[/C][C]6342.25[/C][C]89.7826078183668[/C][C]201[/C][/ROW]
[ROW][C]9[/C][C]6511[/C][C]28.1187956119509[/C][C]62[/C][/ROW]
[ROW][C]10[/C][C]6500.5[/C][C]28.5014619508076[/C][C]69[/C][/ROW]
[ROW][C]11[/C][C]6556.5[/C][C]168.658431946543[/C][C]355[/C][/ROW]
[ROW][C]12[/C][C]6812.25[/C][C]65.347149899594[/C][C]150[/C][/ROW]
[ROW][C]13[/C][C]6611.5[/C][C]111.989582848882[/C][C]265[/C][/ROW]
[ROW][C]14[/C][C]6476.75[/C][C]57.3490772956869[/C][C]118[/C][/ROW]
[ROW][C]15[/C][C]6321.25[/C][C]151.763796736903[/C][C]291[/C][/ROW]
[/TABLE]
Source: https://freestatistics.org/blog/index.php?pk=63243&T=1

Globally Unique Identifier (entire table): ba.freestatistics.org/blog/index.php?pk=63243&T=1

As an alternative you can also use a QR Code:  

The GUIDs for individual cells are displayed in the table below:

Standard Deviation-Mean Plot
SectionMeanStandard DeviationRange
1560082.2232732665555199
25769.5250.895064386156562
3600657.1080846582455110
45972.7520.320351046836444
56148.25113.055664755612255
66330.2517.783419243778739
76225.7536.344417269598270
86342.2589.7826078183668201
9651128.118795611950962
106500.528.501461950807669
116556.5168.658431946543355
126812.2565.347149899594150
136611.5111.989582848882265
146476.7557.3490772956869118
156321.25151.763796736903291


Regression: S.E.(k) = alpha + beta * Mean(k)
alpha356.271046443114
beta-0.0431581047615180
S.D.0.0535565638767715
T-STAT-0.805841555870177
p-value0.434827627162153

\begin{tabular}{lllllllll}
\hline
Regression: S.E.(k) = alpha + beta * Mean(k) \tabularnewline
alpha & 356.271046443114 \tabularnewline
beta & -0.0431581047615180 \tabularnewline
S.D. & 0.0535565638767715 \tabularnewline
T-STAT & -0.805841555870177 \tabularnewline
p-value & 0.434827627162153 \tabularnewline
\hline
\end{tabular}
%Source: https://freestatistics.org/blog/index.php?pk=63243&T=2

[TABLE]
[ROW][C]Regression: S.E.(k) = alpha + beta * Mean(k)[/C][/ROW]
[ROW][C]alpha[/C][C]356.271046443114[/C][/ROW]
[ROW][C]beta[/C][C]-0.0431581047615180[/C][/ROW]
[ROW][C]S.D.[/C][C]0.0535565638767715[/C][/ROW]
[ROW][C]T-STAT[/C][C]-0.805841555870177[/C][/ROW]
[ROW][C]p-value[/C][C]0.434827627162153[/C][/ROW]
[/TABLE]
Source: https://freestatistics.org/blog/index.php?pk=63243&T=2

Globally Unique Identifier (entire table): ba.freestatistics.org/blog/index.php?pk=63243&T=2

As an alternative you can also use a QR Code:  

The GUIDs for individual cells are displayed in the table below:

Regression: S.E.(k) = alpha + beta * Mean(k)
alpha356.271046443114
beta-0.0431581047615180
S.D.0.0535565638767715
T-STAT-0.805841555870177
p-value0.434827627162153


Regression: ln S.E.(k) = alpha + beta * ln Mean(k)
alpha21.3785230665225
beta-1.96871778345078
S.D.4.11875495582466
T-STAT-0.477988568042063
p-value0.64059586630305
Lambda2.96871778345078

\begin{tabular}{lllllllll}
\hline
Regression: ln S.E.(k) = alpha + beta * ln Mean(k) \tabularnewline
alpha & 21.3785230665225 \tabularnewline
beta & -1.96871778345078 \tabularnewline
S.D. & 4.11875495582466 \tabularnewline
T-STAT & -0.477988568042063 \tabularnewline
p-value & 0.64059586630305 \tabularnewline
Lambda & 2.96871778345078 \tabularnewline
\hline
\end{tabular}
%Source: https://freestatistics.org/blog/index.php?pk=63243&T=3

[TABLE]
[ROW][C]Regression: ln S.E.(k) = alpha + beta * ln Mean(k)[/C][/ROW]
[ROW][C]alpha[/C][C]21.3785230665225[/C][/ROW]
[ROW][C]beta[/C][C]-1.96871778345078[/C][/ROW]
[ROW][C]S.D.[/C][C]4.11875495582466[/C][/ROW]
[ROW][C]T-STAT[/C][C]-0.477988568042063[/C][/ROW]
[ROW][C]p-value[/C][C]0.64059586630305[/C][/ROW]
[ROW][C]Lambda[/C][C]2.96871778345078[/C][/ROW]
[/TABLE]
Source: https://freestatistics.org/blog/index.php?pk=63243&T=3

Globally Unique Identifier (entire table): ba.freestatistics.org/blog/index.php?pk=63243&T=3

As an alternative you can also use a QR Code:  

The GUIDs for individual cells are displayed in the table below:

Regression: ln S.E.(k) = alpha + beta * ln Mean(k)
alpha21.3785230665225
beta-1.96871778345078
S.D.4.11875495582466
T-STAT-0.477988568042063
p-value0.64059586630305
Lambda2.96871778345078


Parameters (Session):
par1 = 4 ;
Parameters (R input):
par1 = 4 ;
R code (references can be found in the software module):
par1 <- as.numeric(par1)
(n <- length(x))
(np <- floor(n / par1))
arr <- array(NA,dim=c(par1,np))
j <- 0
k <- 1
for (i in 1:(np*par1))
{
j = j + 1
arr[j,k] <- x[i]
if (j == par1) {
j = 0
k=k+1
}
}
arr
arr.mean <- array(NA,dim=np)
arr.sd <- array(NA,dim=np)
arr.range <- array(NA,dim=np)
for (j in 1:np)
{
arr.mean[j] <- mean(arr[,j],na.rm=TRUE)
arr.sd[j] <- sd(arr[,j],na.rm=TRUE)
arr.range[j] <- max(arr[,j],na.rm=TRUE) - min(arr[,j],na.rm=TRUE)
}
arr.mean
arr.sd
arr.range
(lm1 <- lm(arr.sd~arr.mean))
(lnlm1 <- lm(log(arr.sd)~log(arr.mean)))
(lm2 <- lm(arr.range~arr.mean))
bitmap(file='test1.png')
plot(arr.mean,arr.sd,main='Standard Deviation-Mean Plot',xlab='mean',ylab='standard deviation')
dev.off()
bitmap(file='test2.png')
plot(arr.mean,arr.range,main='Range-Mean Plot',xlab='mean',ylab='range')
dev.off()
load(file='createtable')
a<-table.start()
a<-table.row.start(a)
a<-table.element(a,'Standard Deviation-Mean Plot',4,TRUE)
a<-table.row.end(a)
a<-table.row.start(a)
a<-table.element(a,'Section',header=TRUE)
a<-table.element(a,'Mean',header=TRUE)
a<-table.element(a,'Standard Deviation',header=TRUE)
a<-table.element(a,'Range',header=TRUE)
a<-table.row.end(a)
for (j in 1:np) {
a<-table.row.start(a)
a<-table.element(a,j,header=TRUE)
a<-table.element(a,arr.mean[j])
a<-table.element(a,arr.sd[j] )
a<-table.element(a,arr.range[j] )
a<-table.row.end(a)
}
a<-table.end(a)
table.save(a,file='mytable.tab')
a<-table.start()
a<-table.row.start(a)
a<-table.element(a,'Regression: S.E.(k) = alpha + beta * Mean(k)',2,TRUE)
a<-table.row.end(a)
a<-table.row.start(a)
a<-table.element(a,'alpha',header=TRUE)
a<-table.element(a,lm1$coefficients[[1]])
a<-table.row.end(a)
a<-table.row.start(a)
a<-table.element(a,'beta',header=TRUE)
a<-table.element(a,lm1$coefficients[[2]])
a<-table.row.end(a)
a<-table.row.start(a)
a<-table.element(a,'S.D.',header=TRUE)
a<-table.element(a,summary(lm1)$coefficients[2,2])
a<-table.row.end(a)
a<-table.row.start(a)
a<-table.element(a,'T-STAT',header=TRUE)
a<-table.element(a,summary(lm1)$coefficients[2,3])
a<-table.row.end(a)
a<-table.row.start(a)
a<-table.element(a,'p-value',header=TRUE)
a<-table.element(a,summary(lm1)$coefficients[2,4])
a<-table.row.end(a)
a<-table.end(a)
table.save(a,file='mytable1.tab')
a<-table.start()
a<-table.row.start(a)
a<-table.element(a,'Regression: ln S.E.(k) = alpha + beta * ln Mean(k)',2,TRUE)
a<-table.row.end(a)
a<-table.row.start(a)
a<-table.element(a,'alpha',header=TRUE)
a<-table.element(a,lnlm1$coefficients[[1]])
a<-table.row.end(a)
a<-table.row.start(a)
a<-table.element(a,'beta',header=TRUE)
a<-table.element(a,lnlm1$coefficients[[2]])
a<-table.row.end(a)
a<-table.row.start(a)
a<-table.element(a,'S.D.',header=TRUE)
a<-table.element(a,summary(lnlm1)$coefficients[2,2])
a<-table.row.end(a)
a<-table.row.start(a)
a<-table.element(a,'T-STAT',header=TRUE)
a<-table.element(a,summary(lnlm1)$coefficients[2,3])
a<-table.row.end(a)
a<-table.row.start(a)
a<-table.element(a,'p-value',header=TRUE)
a<-table.element(a,summary(lnlm1)$coefficients[2,4])
a<-table.row.end(a)
a<-table.row.start(a)
a<-table.element(a,'Lambda',header=TRUE)
a<-table.element(a,1-lnlm1$coefficients[[2]])
a<-table.row.end(a)
a<-table.end(a)
table.save(a,file='mytable2.tab')