Free Statistics

of Irreproducible Research!

Author's title

Author*The author of this computation has been verified*
R Software Modulerwasp_autocorrelation.wasp
Title produced by software(Partial) Autocorrelation Function
Date of computationFri, 04 Dec 2009 03:30:27 -0700
Cite this page as followsStatistical Computations at FreeStatistics.org, Office for Research Development and Education, URL https://freestatistics.org/blog/index.php?v=date/2009/Dec/04/t125992267373cjqj985loj0hh.htm/, Retrieved Sat, 27 Apr 2024 16:04:37 +0000
Statistical Computations at FreeStatistics.org, Office for Research Development and Education, URL https://freestatistics.org/blog/index.php?pk=63254, Retrieved Sat, 27 Apr 2024 16:04:37 +0000
QR Codes:

Original text written by user:
IsPrivate?No (this computation is public)
User-defined keywords
Estimated Impact118
Family? (F = Feedback message, R = changed R code, M = changed R Module, P = changed Parameters, D = changed Data)
-     [Univariate Data Series] [data set] [2008-12-01 19:54:57] [b98453cac15ba1066b407e146608df68]
- RMP   [(Partial) Autocorrelation Function] [] [2009-11-27 14:47:30] [b98453cac15ba1066b407e146608df68]
F   PD      [(Partial) Autocorrelation Function] [WS9] [2009-12-04 10:30:27] [9a1fef436e1d399a5ecd6808bfbd8489] [Current]
Feedback Forum
2009-12-11 13:29:17 [6af4ee214cbc060e38f4dce8356a5567] [reply
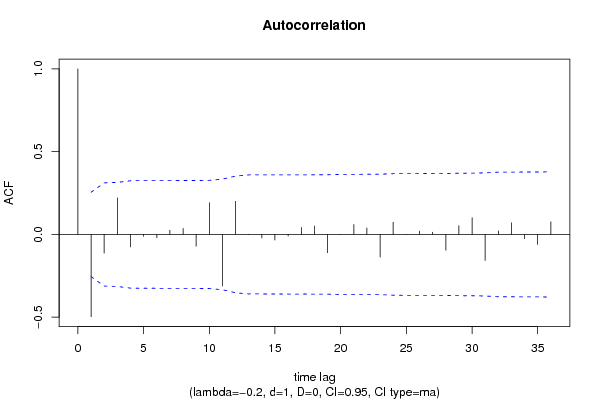
Zoals je kan zien is er bij d=0 en D=0 nog een niet-seizoenale lange termijn trend aanwezig. Je zou dus 1x niet-seizoenaal moeten differentiëren (d=1).

Post a new message
Dataseries X:
3922
3759
4138
4634
3995
4308
4143
4429
5219
4929
5755
5592
4163
4962
5208
4755
4491
5732
5731
5040
6102
4904
5369
5578
4619
4731
5011
5299
4146
4625
4736
4219
5116
4205
4121
5103
4300
4578
3809
5526
4247
3830
4394
4826
4409
4569
4106
4794
3914
3793
4405
4022
4100
4788
3163
3585
3903
4178
3863
4187


Summary of computational transaction
Raw Inputview raw input (R code)
Raw Outputview raw output of R engine
Computing time1 seconds
R Server'Gwilym Jenkins' @ 72.249.127.135

\begin{tabular}{lllllllll}
\hline
Summary of computational transaction \tabularnewline
Raw Input & view raw input (R code)  \tabularnewline
Raw Output & view raw output of R engine  \tabularnewline
Computing time & 1 seconds \tabularnewline
R Server & 'Gwilym Jenkins' @ 72.249.127.135 \tabularnewline
\hline
\end{tabular}
%Source: https://freestatistics.org/blog/index.php?pk=63254&T=0

[TABLE]
[ROW][C]Summary of computational transaction[/C][/ROW]
[ROW][C]Raw Input[/C][C]view raw input (R code) [/C][/ROW]
[ROW][C]Raw Output[/C][C]view raw output of R engine [/C][/ROW]
[ROW][C]Computing time[/C][C]1 seconds[/C][/ROW]
[ROW][C]R Server[/C][C]'Gwilym Jenkins' @ 72.249.127.135[/C][/ROW]
[/TABLE]
Source: https://freestatistics.org/blog/index.php?pk=63254&T=0

Globally Unique Identifier (entire table): ba.freestatistics.org/blog/index.php?pk=63254&T=0

As an alternative you can also use a QR Code:  

The GUIDs for individual cells are displayed in the table below:

Summary of computational transaction
Raw Inputview raw input (R code)
Raw Outputview raw output of R engine
Computing time1 seconds
R Server'Gwilym Jenkins' @ 72.249.127.135


Autocorrelation Function
Time lag kACF(k)T-STATP-value
1-0.496746-3.81560.000164
2-0.11246-0.86380.195592
30.2203281.69240.047925
4-0.075836-0.58250.281223
5-0.011651-0.08950.464496
6-0.019363-0.14870.441138
70.0259540.19940.421334
80.0365590.28080.389918
9-0.070589-0.54220.294861
100.1918581.47370.072941
11-0.311248-2.39070.010012
120.1999371.53570.064973
13-0.000876-0.00670.497327
14-0.021396-0.16430.435009
15-0.033694-0.25880.398341
16-0.009997-0.07680.469525
170.0423920.32560.372934
180.0507520.38980.349031
19-0.110584-0.84940.199542
20-0.000837-0.00640.497445
210.0597650.45910.323937
220.0382760.2940.384893
23-0.136515-1.04860.149321
240.0741230.56940.28564
250.000440.00340.498657
260.0195310.150.440629
270.0136610.10490.458392
28-0.095207-0.73130.233745
290.052650.40440.343686
300.1013220.77830.219761
31-0.157369-1.20880.115785
320.0209410.16090.43638
330.0702230.53940.295824
34-0.025512-0.1960.422657
35-0.060562-0.46520.321756
360.0764910.58750.279542

\begin{tabular}{lllllllll}
\hline
Autocorrelation Function \tabularnewline
Time lag k & ACF(k) & T-STAT & P-value \tabularnewline
1 & -0.496746 & -3.8156 & 0.000164 \tabularnewline
2 & -0.11246 & -0.8638 & 0.195592 \tabularnewline
3 & 0.220328 & 1.6924 & 0.047925 \tabularnewline
4 & -0.075836 & -0.5825 & 0.281223 \tabularnewline
5 & -0.011651 & -0.0895 & 0.464496 \tabularnewline
6 & -0.019363 & -0.1487 & 0.441138 \tabularnewline
7 & 0.025954 & 0.1994 & 0.421334 \tabularnewline
8 & 0.036559 & 0.2808 & 0.389918 \tabularnewline
9 & -0.070589 & -0.5422 & 0.294861 \tabularnewline
10 & 0.191858 & 1.4737 & 0.072941 \tabularnewline
11 & -0.311248 & -2.3907 & 0.010012 \tabularnewline
12 & 0.199937 & 1.5357 & 0.064973 \tabularnewline
13 & -0.000876 & -0.0067 & 0.497327 \tabularnewline
14 & -0.021396 & -0.1643 & 0.435009 \tabularnewline
15 & -0.033694 & -0.2588 & 0.398341 \tabularnewline
16 & -0.009997 & -0.0768 & 0.469525 \tabularnewline
17 & 0.042392 & 0.3256 & 0.372934 \tabularnewline
18 & 0.050752 & 0.3898 & 0.349031 \tabularnewline
19 & -0.110584 & -0.8494 & 0.199542 \tabularnewline
20 & -0.000837 & -0.0064 & 0.497445 \tabularnewline
21 & 0.059765 & 0.4591 & 0.323937 \tabularnewline
22 & 0.038276 & 0.294 & 0.384893 \tabularnewline
23 & -0.136515 & -1.0486 & 0.149321 \tabularnewline
24 & 0.074123 & 0.5694 & 0.28564 \tabularnewline
25 & 0.00044 & 0.0034 & 0.498657 \tabularnewline
26 & 0.019531 & 0.15 & 0.440629 \tabularnewline
27 & 0.013661 & 0.1049 & 0.458392 \tabularnewline
28 & -0.095207 & -0.7313 & 0.233745 \tabularnewline
29 & 0.05265 & 0.4044 & 0.343686 \tabularnewline
30 & 0.101322 & 0.7783 & 0.219761 \tabularnewline
31 & -0.157369 & -1.2088 & 0.115785 \tabularnewline
32 & 0.020941 & 0.1609 & 0.43638 \tabularnewline
33 & 0.070223 & 0.5394 & 0.295824 \tabularnewline
34 & -0.025512 & -0.196 & 0.422657 \tabularnewline
35 & -0.060562 & -0.4652 & 0.321756 \tabularnewline
36 & 0.076491 & 0.5875 & 0.279542 \tabularnewline
\hline
\end{tabular}
%Source: https://freestatistics.org/blog/index.php?pk=63254&T=1

[TABLE]
[ROW][C]Autocorrelation Function[/C][/ROW]
[ROW][C]Time lag k[/C][C]ACF(k)[/C][C]T-STAT[/C][C]P-value[/C][/ROW]
[ROW][C]1[/C][C]-0.496746[/C][C]-3.8156[/C][C]0.000164[/C][/ROW]
[ROW][C]2[/C][C]-0.11246[/C][C]-0.8638[/C][C]0.195592[/C][/ROW]
[ROW][C]3[/C][C]0.220328[/C][C]1.6924[/C][C]0.047925[/C][/ROW]
[ROW][C]4[/C][C]-0.075836[/C][C]-0.5825[/C][C]0.281223[/C][/ROW]
[ROW][C]5[/C][C]-0.011651[/C][C]-0.0895[/C][C]0.464496[/C][/ROW]
[ROW][C]6[/C][C]-0.019363[/C][C]-0.1487[/C][C]0.441138[/C][/ROW]
[ROW][C]7[/C][C]0.025954[/C][C]0.1994[/C][C]0.421334[/C][/ROW]
[ROW][C]8[/C][C]0.036559[/C][C]0.2808[/C][C]0.389918[/C][/ROW]
[ROW][C]9[/C][C]-0.070589[/C][C]-0.5422[/C][C]0.294861[/C][/ROW]
[ROW][C]10[/C][C]0.191858[/C][C]1.4737[/C][C]0.072941[/C][/ROW]
[ROW][C]11[/C][C]-0.311248[/C][C]-2.3907[/C][C]0.010012[/C][/ROW]
[ROW][C]12[/C][C]0.199937[/C][C]1.5357[/C][C]0.064973[/C][/ROW]
[ROW][C]13[/C][C]-0.000876[/C][C]-0.0067[/C][C]0.497327[/C][/ROW]
[ROW][C]14[/C][C]-0.021396[/C][C]-0.1643[/C][C]0.435009[/C][/ROW]
[ROW][C]15[/C][C]-0.033694[/C][C]-0.2588[/C][C]0.398341[/C][/ROW]
[ROW][C]16[/C][C]-0.009997[/C][C]-0.0768[/C][C]0.469525[/C][/ROW]
[ROW][C]17[/C][C]0.042392[/C][C]0.3256[/C][C]0.372934[/C][/ROW]
[ROW][C]18[/C][C]0.050752[/C][C]0.3898[/C][C]0.349031[/C][/ROW]
[ROW][C]19[/C][C]-0.110584[/C][C]-0.8494[/C][C]0.199542[/C][/ROW]
[ROW][C]20[/C][C]-0.000837[/C][C]-0.0064[/C][C]0.497445[/C][/ROW]
[ROW][C]21[/C][C]0.059765[/C][C]0.4591[/C][C]0.323937[/C][/ROW]
[ROW][C]22[/C][C]0.038276[/C][C]0.294[/C][C]0.384893[/C][/ROW]
[ROW][C]23[/C][C]-0.136515[/C][C]-1.0486[/C][C]0.149321[/C][/ROW]
[ROW][C]24[/C][C]0.074123[/C][C]0.5694[/C][C]0.28564[/C][/ROW]
[ROW][C]25[/C][C]0.00044[/C][C]0.0034[/C][C]0.498657[/C][/ROW]
[ROW][C]26[/C][C]0.019531[/C][C]0.15[/C][C]0.440629[/C][/ROW]
[ROW][C]27[/C][C]0.013661[/C][C]0.1049[/C][C]0.458392[/C][/ROW]
[ROW][C]28[/C][C]-0.095207[/C][C]-0.7313[/C][C]0.233745[/C][/ROW]
[ROW][C]29[/C][C]0.05265[/C][C]0.4044[/C][C]0.343686[/C][/ROW]
[ROW][C]30[/C][C]0.101322[/C][C]0.7783[/C][C]0.219761[/C][/ROW]
[ROW][C]31[/C][C]-0.157369[/C][C]-1.2088[/C][C]0.115785[/C][/ROW]
[ROW][C]32[/C][C]0.020941[/C][C]0.1609[/C][C]0.43638[/C][/ROW]
[ROW][C]33[/C][C]0.070223[/C][C]0.5394[/C][C]0.295824[/C][/ROW]
[ROW][C]34[/C][C]-0.025512[/C][C]-0.196[/C][C]0.422657[/C][/ROW]
[ROW][C]35[/C][C]-0.060562[/C][C]-0.4652[/C][C]0.321756[/C][/ROW]
[ROW][C]36[/C][C]0.076491[/C][C]0.5875[/C][C]0.279542[/C][/ROW]
[/TABLE]
Source: https://freestatistics.org/blog/index.php?pk=63254&T=1

Globally Unique Identifier (entire table): ba.freestatistics.org/blog/index.php?pk=63254&T=1

As an alternative you can also use a QR Code:  

The GUIDs for individual cells are displayed in the table below:

Autocorrelation Function
Time lag kACF(k)T-STATP-value
1-0.496746-3.81560.000164
2-0.11246-0.86380.195592
30.2203281.69240.047925
4-0.075836-0.58250.281223
5-0.011651-0.08950.464496
6-0.019363-0.14870.441138
70.0259540.19940.421334
80.0365590.28080.389918
9-0.070589-0.54220.294861
100.1918581.47370.072941
11-0.311248-2.39070.010012
120.1999371.53570.064973
13-0.000876-0.00670.497327
14-0.021396-0.16430.435009
15-0.033694-0.25880.398341
16-0.009997-0.07680.469525
170.0423920.32560.372934
180.0507520.38980.349031
19-0.110584-0.84940.199542
20-0.000837-0.00640.497445
210.0597650.45910.323937
220.0382760.2940.384893
23-0.136515-1.04860.149321
240.0741230.56940.28564
250.000440.00340.498657
260.0195310.150.440629
270.0136610.10490.458392
28-0.095207-0.73130.233745
290.052650.40440.343686
300.1013220.77830.219761
31-0.157369-1.20880.115785
320.0209410.16090.43638
330.0702230.53940.295824
34-0.025512-0.1960.422657
35-0.060562-0.46520.321756
360.0764910.58750.279542


Partial Autocorrelation Function
Time lag kPACF(k)T-STATP-value
1-0.496746-3.81560.000164
2-0.476892-3.66310.000267
3-0.170244-1.30770.098029
4-0.085921-0.660.255919
5-0.000481-0.00370.498531
6-0.063357-0.48670.314152
7-0.047401-0.36410.358544
80.0272230.20910.417542
9-0.011072-0.0850.466256
100.2826972.17140.016965
11-0.127109-0.97630.16644
120.0068630.05270.479068
13-0.076386-0.58670.279811
140.1363121.0470.149678
150.0195620.15030.440537
16-0.04235-0.32530.373054
17-0.099104-0.76120.224775
180.0675890.51920.302796
190.0530540.40750.342552
20-0.113832-0.87440.192733
21-0.027698-0.21270.416128
22-0.047631-0.36590.357889
23-0.026626-0.20450.419327
24-0.064626-0.49640.310728
25-0.034623-0.26590.395605
26-0.011802-0.09070.464037
270.0986370.75760.22584
28-0.048218-0.37040.356216
290.0009560.00730.497082
300.1143040.8780.191756
31-0.045382-0.34860.364321
32-0.07053-0.54180.295015
33-0.018204-0.13980.444636
34-0.007981-0.06130.475663
35-0.10822-0.83130.204591
36-0.020733-0.15930.437006

\begin{tabular}{lllllllll}
\hline
Partial Autocorrelation Function \tabularnewline
Time lag k & PACF(k) & T-STAT & P-value \tabularnewline
1 & -0.496746 & -3.8156 & 0.000164 \tabularnewline
2 & -0.476892 & -3.6631 & 0.000267 \tabularnewline
3 & -0.170244 & -1.3077 & 0.098029 \tabularnewline
4 & -0.085921 & -0.66 & 0.255919 \tabularnewline
5 & -0.000481 & -0.0037 & 0.498531 \tabularnewline
6 & -0.063357 & -0.4867 & 0.314152 \tabularnewline
7 & -0.047401 & -0.3641 & 0.358544 \tabularnewline
8 & 0.027223 & 0.2091 & 0.417542 \tabularnewline
9 & -0.011072 & -0.085 & 0.466256 \tabularnewline
10 & 0.282697 & 2.1714 & 0.016965 \tabularnewline
11 & -0.127109 & -0.9763 & 0.16644 \tabularnewline
12 & 0.006863 & 0.0527 & 0.479068 \tabularnewline
13 & -0.076386 & -0.5867 & 0.279811 \tabularnewline
14 & 0.136312 & 1.047 & 0.149678 \tabularnewline
15 & 0.019562 & 0.1503 & 0.440537 \tabularnewline
16 & -0.04235 & -0.3253 & 0.373054 \tabularnewline
17 & -0.099104 & -0.7612 & 0.224775 \tabularnewline
18 & 0.067589 & 0.5192 & 0.302796 \tabularnewline
19 & 0.053054 & 0.4075 & 0.342552 \tabularnewline
20 & -0.113832 & -0.8744 & 0.192733 \tabularnewline
21 & -0.027698 & -0.2127 & 0.416128 \tabularnewline
22 & -0.047631 & -0.3659 & 0.357889 \tabularnewline
23 & -0.026626 & -0.2045 & 0.419327 \tabularnewline
24 & -0.064626 & -0.4964 & 0.310728 \tabularnewline
25 & -0.034623 & -0.2659 & 0.395605 \tabularnewline
26 & -0.011802 & -0.0907 & 0.464037 \tabularnewline
27 & 0.098637 & 0.7576 & 0.22584 \tabularnewline
28 & -0.048218 & -0.3704 & 0.356216 \tabularnewline
29 & 0.000956 & 0.0073 & 0.497082 \tabularnewline
30 & 0.114304 & 0.878 & 0.191756 \tabularnewline
31 & -0.045382 & -0.3486 & 0.364321 \tabularnewline
32 & -0.07053 & -0.5418 & 0.295015 \tabularnewline
33 & -0.018204 & -0.1398 & 0.444636 \tabularnewline
34 & -0.007981 & -0.0613 & 0.475663 \tabularnewline
35 & -0.10822 & -0.8313 & 0.204591 \tabularnewline
36 & -0.020733 & -0.1593 & 0.437006 \tabularnewline
\hline
\end{tabular}
%Source: https://freestatistics.org/blog/index.php?pk=63254&T=2

[TABLE]
[ROW][C]Partial Autocorrelation Function[/C][/ROW]
[ROW][C]Time lag k[/C][C]PACF(k)[/C][C]T-STAT[/C][C]P-value[/C][/ROW]
[ROW][C]1[/C][C]-0.496746[/C][C]-3.8156[/C][C]0.000164[/C][/ROW]
[ROW][C]2[/C][C]-0.476892[/C][C]-3.6631[/C][C]0.000267[/C][/ROW]
[ROW][C]3[/C][C]-0.170244[/C][C]-1.3077[/C][C]0.098029[/C][/ROW]
[ROW][C]4[/C][C]-0.085921[/C][C]-0.66[/C][C]0.255919[/C][/ROW]
[ROW][C]5[/C][C]-0.000481[/C][C]-0.0037[/C][C]0.498531[/C][/ROW]
[ROW][C]6[/C][C]-0.063357[/C][C]-0.4867[/C][C]0.314152[/C][/ROW]
[ROW][C]7[/C][C]-0.047401[/C][C]-0.3641[/C][C]0.358544[/C][/ROW]
[ROW][C]8[/C][C]0.027223[/C][C]0.2091[/C][C]0.417542[/C][/ROW]
[ROW][C]9[/C][C]-0.011072[/C][C]-0.085[/C][C]0.466256[/C][/ROW]
[ROW][C]10[/C][C]0.282697[/C][C]2.1714[/C][C]0.016965[/C][/ROW]
[ROW][C]11[/C][C]-0.127109[/C][C]-0.9763[/C][C]0.16644[/C][/ROW]
[ROW][C]12[/C][C]0.006863[/C][C]0.0527[/C][C]0.479068[/C][/ROW]
[ROW][C]13[/C][C]-0.076386[/C][C]-0.5867[/C][C]0.279811[/C][/ROW]
[ROW][C]14[/C][C]0.136312[/C][C]1.047[/C][C]0.149678[/C][/ROW]
[ROW][C]15[/C][C]0.019562[/C][C]0.1503[/C][C]0.440537[/C][/ROW]
[ROW][C]16[/C][C]-0.04235[/C][C]-0.3253[/C][C]0.373054[/C][/ROW]
[ROW][C]17[/C][C]-0.099104[/C][C]-0.7612[/C][C]0.224775[/C][/ROW]
[ROW][C]18[/C][C]0.067589[/C][C]0.5192[/C][C]0.302796[/C][/ROW]
[ROW][C]19[/C][C]0.053054[/C][C]0.4075[/C][C]0.342552[/C][/ROW]
[ROW][C]20[/C][C]-0.113832[/C][C]-0.8744[/C][C]0.192733[/C][/ROW]
[ROW][C]21[/C][C]-0.027698[/C][C]-0.2127[/C][C]0.416128[/C][/ROW]
[ROW][C]22[/C][C]-0.047631[/C][C]-0.3659[/C][C]0.357889[/C][/ROW]
[ROW][C]23[/C][C]-0.026626[/C][C]-0.2045[/C][C]0.419327[/C][/ROW]
[ROW][C]24[/C][C]-0.064626[/C][C]-0.4964[/C][C]0.310728[/C][/ROW]
[ROW][C]25[/C][C]-0.034623[/C][C]-0.2659[/C][C]0.395605[/C][/ROW]
[ROW][C]26[/C][C]-0.011802[/C][C]-0.0907[/C][C]0.464037[/C][/ROW]
[ROW][C]27[/C][C]0.098637[/C][C]0.7576[/C][C]0.22584[/C][/ROW]
[ROW][C]28[/C][C]-0.048218[/C][C]-0.3704[/C][C]0.356216[/C][/ROW]
[ROW][C]29[/C][C]0.000956[/C][C]0.0073[/C][C]0.497082[/C][/ROW]
[ROW][C]30[/C][C]0.114304[/C][C]0.878[/C][C]0.191756[/C][/ROW]
[ROW][C]31[/C][C]-0.045382[/C][C]-0.3486[/C][C]0.364321[/C][/ROW]
[ROW][C]32[/C][C]-0.07053[/C][C]-0.5418[/C][C]0.295015[/C][/ROW]
[ROW][C]33[/C][C]-0.018204[/C][C]-0.1398[/C][C]0.444636[/C][/ROW]
[ROW][C]34[/C][C]-0.007981[/C][C]-0.0613[/C][C]0.475663[/C][/ROW]
[ROW][C]35[/C][C]-0.10822[/C][C]-0.8313[/C][C]0.204591[/C][/ROW]
[ROW][C]36[/C][C]-0.020733[/C][C]-0.1593[/C][C]0.437006[/C][/ROW]
[/TABLE]
Source: https://freestatistics.org/blog/index.php?pk=63254&T=2

Globally Unique Identifier (entire table): ba.freestatistics.org/blog/index.php?pk=63254&T=2

As an alternative you can also use a QR Code:  

The GUIDs for individual cells are displayed in the table below:

Partial Autocorrelation Function
Time lag kPACF(k)T-STATP-value
1-0.496746-3.81560.000164
2-0.476892-3.66310.000267
3-0.170244-1.30770.098029
4-0.085921-0.660.255919
5-0.000481-0.00370.498531
6-0.063357-0.48670.314152
7-0.047401-0.36410.358544
80.0272230.20910.417542
9-0.011072-0.0850.466256
100.2826972.17140.016965
11-0.127109-0.97630.16644
120.0068630.05270.479068
13-0.076386-0.58670.279811
140.1363121.0470.149678
150.0195620.15030.440537
16-0.04235-0.32530.373054
17-0.099104-0.76120.224775
180.0675890.51920.302796
190.0530540.40750.342552
20-0.113832-0.87440.192733
21-0.027698-0.21270.416128
22-0.047631-0.36590.357889
23-0.026626-0.20450.419327
24-0.064626-0.49640.310728
25-0.034623-0.26590.395605
26-0.011802-0.09070.464037
270.0986370.75760.22584
28-0.048218-0.37040.356216
290.0009560.00730.497082
300.1143040.8780.191756
31-0.045382-0.34860.364321
32-0.07053-0.54180.295015
33-0.018204-0.13980.444636
34-0.007981-0.06130.475663
35-0.10822-0.83130.204591
36-0.020733-0.15930.437006


Parameters (Session):
par1 = 36 ; par2 = -0.2 ; par3 = 1 ; par4 = 0 ; par5 = 12 ; par6 = MA ; par7 = 0.95 ;
Parameters (R input):
par1 = 36 ; par2 = -0.2 ; par3 = 1 ; par4 = 0 ; par5 = 12 ; par6 = MA ; par7 = 0.95 ;
R code (references can be found in the software module):
if (par1 == 'Default') {
par1 = 10*log10(length(x))
} else {
par1 <- as.numeric(par1)
}
par2 <- as.numeric(par2)
par3 <- as.numeric(par3)
par4 <- as.numeric(par4)
par5 <- as.numeric(par5)
if (par6 == 'White Noise') par6 <- 'white' else par6 <- 'ma'
par7 <- as.numeric(par7)
if (par2 == 0) {
x <- log(x)
} else {
x <- (x ^ par2 - 1) / par2
}
if (par3 > 0) x <- diff(x,lag=1,difference=par3)
if (par4 > 0) x <- diff(x,lag=par5,difference=par4)
bitmap(file='pic1.png')
racf <- acf(x, par1, main='Autocorrelation', xlab='time lag', ylab='ACF', ci.type=par6, ci=par7, sub=paste('(lambda=',par2,', d=',par3,', D=',par4,', CI=', par7, ', CI type=',par6,')',sep=''))
dev.off()
bitmap(file='pic2.png')
rpacf <- pacf(x,par1,main='Partial Autocorrelation',xlab='lags',ylab='PACF')
dev.off()
(myacf <- c(racf$acf))
(mypacf <- c(rpacf$acf))
lengthx <- length(x)
sqrtn <- sqrt(lengthx)
load(file='createtable')
a<-table.start()
a<-table.row.start(a)
a<-table.element(a,'Autocorrelation Function',4,TRUE)
a<-table.row.end(a)
a<-table.row.start(a)
a<-table.element(a,'Time lag k',header=TRUE)
a<-table.element(a,hyperlink('basics.htm','ACF(k)','click here for more information about the Autocorrelation Function'),header=TRUE)
a<-table.element(a,'T-STAT',header=TRUE)
a<-table.element(a,'P-value',header=TRUE)
a<-table.row.end(a)
for (i in 2:(par1+1)) {
a<-table.row.start(a)
a<-table.element(a,i-1,header=TRUE)
a<-table.element(a,round(myacf[i],6))
mytstat <- myacf[i]*sqrtn
a<-table.element(a,round(mytstat,4))
a<-table.element(a,round(1-pt(abs(mytstat),lengthx),6))
a<-table.row.end(a)
}
a<-table.end(a)
table.save(a,file='mytable.tab')
a<-table.start()
a<-table.row.start(a)
a<-table.element(a,'Partial Autocorrelation Function',4,TRUE)
a<-table.row.end(a)
a<-table.row.start(a)
a<-table.element(a,'Time lag k',header=TRUE)
a<-table.element(a,hyperlink('basics.htm','PACF(k)','click here for more information about the Partial Autocorrelation Function'),header=TRUE)
a<-table.element(a,'T-STAT',header=TRUE)
a<-table.element(a,'P-value',header=TRUE)
a<-table.row.end(a)
for (i in 1:par1) {
a<-table.row.start(a)
a<-table.element(a,i,header=TRUE)
a<-table.element(a,round(mypacf[i],6))
mytstat <- mypacf[i]*sqrtn
a<-table.element(a,round(mytstat,4))
a<-table.element(a,round(1-pt(abs(mytstat),lengthx),6))
a<-table.row.end(a)
}
a<-table.end(a)
table.save(a,file='mytable1.tab')