Free Statistics

of Irreproducible Research!

Author's title

Author*The author of this computation has been verified*
R Software Modulerwasp_autocorrelation.wasp
Title produced by software(Partial) Autocorrelation Function
Date of computationFri, 04 Dec 2009 03:32:15 -0700
Cite this page as followsStatistical Computations at FreeStatistics.org, Office for Research Development and Education, URL https://freestatistics.org/blog/index.php?v=date/2009/Dec/04/t1259922780zivu2truq0m4ggc.htm/, Retrieved Sun, 28 Apr 2024 18:00:28 +0000
Statistical Computations at FreeStatistics.org, Office for Research Development and Education, URL https://freestatistics.org/blog/index.php?pk=63256, Retrieved Sun, 28 Apr 2024 18:00:28 +0000
QR Codes:

Original text written by user:
IsPrivate?No (this computation is public)
User-defined keywords
Estimated Impact154
Family? (F = Feedback message, R = changed R code, M = changed R Module, P = changed Parameters, D = changed Data)
-     [Univariate Data Series] [data set] [2008-12-01 19:54:57] [b98453cac15ba1066b407e146608df68]
- RMP   [(Partial) Autocorrelation Function] [] [2009-11-27 14:48:46] [b98453cac15ba1066b407e146608df68]
F   PD      [(Partial) Autocorrelation Function] [WS9] [2009-12-04 10:32:15] [9a1fef436e1d399a5ecd6808bfbd8489] [Current]
-   P         [(Partial) Autocorrelation Function] [ws9] [2009-12-11 13:17:00] [74be16979710d4c4e7c6647856088456]
Feedback Forum
2009-12-11 13:31:35 [Dorien Peeters] [reply
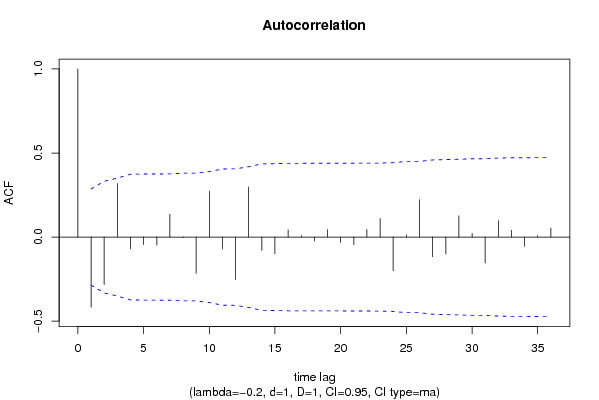
Hier heb je 1x niet-seizoenaal gedifferentieerd. De ACF ziet er al veel beter uit.

Post a new message
Dataseries X:
3922
3759
4138
4634
3995
4308
4143
4429
5219
4929
5755
5592
4163
4962
5208
4755
4491
5732
5731
5040
6102
4904
5369
5578
4619
4731
5011
5299
4146
4625
4736
4219
5116
4205
4121
5103
4300
4578
3809
5526
4247
3830
4394
4826
4409
4569
4106
4794
3914
3793
4405
4022
4100
4788
3163
3585
3903
4178
3863
4187


Summary of computational transaction
Raw Inputview raw input (R code)
Raw Outputview raw output of R engine
Computing time1 seconds
R Server'Gwilym Jenkins' @ 72.249.127.135

\begin{tabular}{lllllllll}
\hline
Summary of computational transaction \tabularnewline
Raw Input & view raw input (R code)  \tabularnewline
Raw Output & view raw output of R engine  \tabularnewline
Computing time & 1 seconds \tabularnewline
R Server & 'Gwilym Jenkins' @ 72.249.127.135 \tabularnewline
\hline
\end{tabular}
%Source: https://freestatistics.org/blog/index.php?pk=63256&T=0

[TABLE]
[ROW][C]Summary of computational transaction[/C][/ROW]
[ROW][C]Raw Input[/C][C]view raw input (R code) [/C][/ROW]
[ROW][C]Raw Output[/C][C]view raw output of R engine [/C][/ROW]
[ROW][C]Computing time[/C][C]1 seconds[/C][/ROW]
[ROW][C]R Server[/C][C]'Gwilym Jenkins' @ 72.249.127.135[/C][/ROW]
[/TABLE]
Source: https://freestatistics.org/blog/index.php?pk=63256&T=0

Globally Unique Identifier (entire table): ba.freestatistics.org/blog/index.php?pk=63256&T=0

As an alternative you can also use a QR Code:  

The GUIDs for individual cells are displayed in the table below:

Summary of computational transaction
Raw Inputview raw input (R code)
Raw Outputview raw output of R engine
Computing time1 seconds
R Server'Gwilym Jenkins' @ 72.249.127.135


Autocorrelation Function
Time lag kACF(k)T-STATP-value
1-0.417071-2.85930.003156
2-0.282712-1.93820.029311
30.3181512.18110.017105
4-0.069903-0.47920.316999
5-0.044737-0.30670.380213
6-0.047351-0.32460.373453
70.1353780.92810.179048
8-0.003405-0.02330.490737
9-0.2156-1.47810.073028
100.2736791.87620.033419
11-0.070733-0.48490.314993
12-0.2524-1.73040.045063
130.297392.03880.023558
14-0.079379-0.54420.29444
15-0.099158-0.67980.249986
160.0430480.29510.384601
170.0087550.060.476196
18-0.022907-0.1570.437941
190.0449520.30820.379656
20-0.032391-0.22210.412614
21-0.045254-0.31020.378872
220.0451870.30980.379047
230.1101470.75510.22697
24-0.200027-1.37130.088394
250.0138060.09470.462498
260.2229321.52830.066565
27-0.116352-0.79770.214537
28-0.101021-0.69260.245996
290.1268450.86960.194467
300.0214610.14710.44183
31-0.154281-1.05770.1478
320.0981820.67310.25209
330.0405670.27810.391074
34-0.054675-0.37480.354735
350.0091440.06270.47514
360.0536290.36770.357388

\begin{tabular}{lllllllll}
\hline
Autocorrelation Function \tabularnewline
Time lag k & ACF(k) & T-STAT & P-value \tabularnewline
1 & -0.417071 & -2.8593 & 0.003156 \tabularnewline
2 & -0.282712 & -1.9382 & 0.029311 \tabularnewline
3 & 0.318151 & 2.1811 & 0.017105 \tabularnewline
4 & -0.069903 & -0.4792 & 0.316999 \tabularnewline
5 & -0.044737 & -0.3067 & 0.380213 \tabularnewline
6 & -0.047351 & -0.3246 & 0.373453 \tabularnewline
7 & 0.135378 & 0.9281 & 0.179048 \tabularnewline
8 & -0.003405 & -0.0233 & 0.490737 \tabularnewline
9 & -0.2156 & -1.4781 & 0.073028 \tabularnewline
10 & 0.273679 & 1.8762 & 0.033419 \tabularnewline
11 & -0.070733 & -0.4849 & 0.314993 \tabularnewline
12 & -0.2524 & -1.7304 & 0.045063 \tabularnewline
13 & 0.29739 & 2.0388 & 0.023558 \tabularnewline
14 & -0.079379 & -0.5442 & 0.29444 \tabularnewline
15 & -0.099158 & -0.6798 & 0.249986 \tabularnewline
16 & 0.043048 & 0.2951 & 0.384601 \tabularnewline
17 & 0.008755 & 0.06 & 0.476196 \tabularnewline
18 & -0.022907 & -0.157 & 0.437941 \tabularnewline
19 & 0.044952 & 0.3082 & 0.379656 \tabularnewline
20 & -0.032391 & -0.2221 & 0.412614 \tabularnewline
21 & -0.045254 & -0.3102 & 0.378872 \tabularnewline
22 & 0.045187 & 0.3098 & 0.379047 \tabularnewline
23 & 0.110147 & 0.7551 & 0.22697 \tabularnewline
24 & -0.200027 & -1.3713 & 0.088394 \tabularnewline
25 & 0.013806 & 0.0947 & 0.462498 \tabularnewline
26 & 0.222932 & 1.5283 & 0.066565 \tabularnewline
27 & -0.116352 & -0.7977 & 0.214537 \tabularnewline
28 & -0.101021 & -0.6926 & 0.245996 \tabularnewline
29 & 0.126845 & 0.8696 & 0.194467 \tabularnewline
30 & 0.021461 & 0.1471 & 0.44183 \tabularnewline
31 & -0.154281 & -1.0577 & 0.1478 \tabularnewline
32 & 0.098182 & 0.6731 & 0.25209 \tabularnewline
33 & 0.040567 & 0.2781 & 0.391074 \tabularnewline
34 & -0.054675 & -0.3748 & 0.354735 \tabularnewline
35 & 0.009144 & 0.0627 & 0.47514 \tabularnewline
36 & 0.053629 & 0.3677 & 0.357388 \tabularnewline
\hline
\end{tabular}
%Source: https://freestatistics.org/blog/index.php?pk=63256&T=1

[TABLE]
[ROW][C]Autocorrelation Function[/C][/ROW]
[ROW][C]Time lag k[/C][C]ACF(k)[/C][C]T-STAT[/C][C]P-value[/C][/ROW]
[ROW][C]1[/C][C]-0.417071[/C][C]-2.8593[/C][C]0.003156[/C][/ROW]
[ROW][C]2[/C][C]-0.282712[/C][C]-1.9382[/C][C]0.029311[/C][/ROW]
[ROW][C]3[/C][C]0.318151[/C][C]2.1811[/C][C]0.017105[/C][/ROW]
[ROW][C]4[/C][C]-0.069903[/C][C]-0.4792[/C][C]0.316999[/C][/ROW]
[ROW][C]5[/C][C]-0.044737[/C][C]-0.3067[/C][C]0.380213[/C][/ROW]
[ROW][C]6[/C][C]-0.047351[/C][C]-0.3246[/C][C]0.373453[/C][/ROW]
[ROW][C]7[/C][C]0.135378[/C][C]0.9281[/C][C]0.179048[/C][/ROW]
[ROW][C]8[/C][C]-0.003405[/C][C]-0.0233[/C][C]0.490737[/C][/ROW]
[ROW][C]9[/C][C]-0.2156[/C][C]-1.4781[/C][C]0.073028[/C][/ROW]
[ROW][C]10[/C][C]0.273679[/C][C]1.8762[/C][C]0.033419[/C][/ROW]
[ROW][C]11[/C][C]-0.070733[/C][C]-0.4849[/C][C]0.314993[/C][/ROW]
[ROW][C]12[/C][C]-0.2524[/C][C]-1.7304[/C][C]0.045063[/C][/ROW]
[ROW][C]13[/C][C]0.29739[/C][C]2.0388[/C][C]0.023558[/C][/ROW]
[ROW][C]14[/C][C]-0.079379[/C][C]-0.5442[/C][C]0.29444[/C][/ROW]
[ROW][C]15[/C][C]-0.099158[/C][C]-0.6798[/C][C]0.249986[/C][/ROW]
[ROW][C]16[/C][C]0.043048[/C][C]0.2951[/C][C]0.384601[/C][/ROW]
[ROW][C]17[/C][C]0.008755[/C][C]0.06[/C][C]0.476196[/C][/ROW]
[ROW][C]18[/C][C]-0.022907[/C][C]-0.157[/C][C]0.437941[/C][/ROW]
[ROW][C]19[/C][C]0.044952[/C][C]0.3082[/C][C]0.379656[/C][/ROW]
[ROW][C]20[/C][C]-0.032391[/C][C]-0.2221[/C][C]0.412614[/C][/ROW]
[ROW][C]21[/C][C]-0.045254[/C][C]-0.3102[/C][C]0.378872[/C][/ROW]
[ROW][C]22[/C][C]0.045187[/C][C]0.3098[/C][C]0.379047[/C][/ROW]
[ROW][C]23[/C][C]0.110147[/C][C]0.7551[/C][C]0.22697[/C][/ROW]
[ROW][C]24[/C][C]-0.200027[/C][C]-1.3713[/C][C]0.088394[/C][/ROW]
[ROW][C]25[/C][C]0.013806[/C][C]0.0947[/C][C]0.462498[/C][/ROW]
[ROW][C]26[/C][C]0.222932[/C][C]1.5283[/C][C]0.066565[/C][/ROW]
[ROW][C]27[/C][C]-0.116352[/C][C]-0.7977[/C][C]0.214537[/C][/ROW]
[ROW][C]28[/C][C]-0.101021[/C][C]-0.6926[/C][C]0.245996[/C][/ROW]
[ROW][C]29[/C][C]0.126845[/C][C]0.8696[/C][C]0.194467[/C][/ROW]
[ROW][C]30[/C][C]0.021461[/C][C]0.1471[/C][C]0.44183[/C][/ROW]
[ROW][C]31[/C][C]-0.154281[/C][C]-1.0577[/C][C]0.1478[/C][/ROW]
[ROW][C]32[/C][C]0.098182[/C][C]0.6731[/C][C]0.25209[/C][/ROW]
[ROW][C]33[/C][C]0.040567[/C][C]0.2781[/C][C]0.391074[/C][/ROW]
[ROW][C]34[/C][C]-0.054675[/C][C]-0.3748[/C][C]0.354735[/C][/ROW]
[ROW][C]35[/C][C]0.009144[/C][C]0.0627[/C][C]0.47514[/C][/ROW]
[ROW][C]36[/C][C]0.053629[/C][C]0.3677[/C][C]0.357388[/C][/ROW]
[/TABLE]
Source: https://freestatistics.org/blog/index.php?pk=63256&T=1

Globally Unique Identifier (entire table): ba.freestatistics.org/blog/index.php?pk=63256&T=1

As an alternative you can also use a QR Code:  

The GUIDs for individual cells are displayed in the table below:

Autocorrelation Function
Time lag kACF(k)T-STATP-value
1-0.417071-2.85930.003156
2-0.282712-1.93820.029311
30.3181512.18110.017105
4-0.069903-0.47920.316999
5-0.044737-0.30670.380213
6-0.047351-0.32460.373453
70.1353780.92810.179048
8-0.003405-0.02330.490737
9-0.2156-1.47810.073028
100.2736791.87620.033419
11-0.070733-0.48490.314993
12-0.2524-1.73040.045063
130.297392.03880.023558
14-0.079379-0.54420.29444
15-0.099158-0.67980.249986
160.0430480.29510.384601
170.0087550.060.476196
18-0.022907-0.1570.437941
190.0449520.30820.379656
20-0.032391-0.22210.412614
21-0.045254-0.31020.378872
220.0451870.30980.379047
230.1101470.75510.22697
24-0.200027-1.37130.088394
250.0138060.09470.462498
260.2229321.52830.066565
27-0.116352-0.79770.214537
28-0.101021-0.69260.245996
290.1268450.86960.194467
300.0214610.14710.44183
31-0.154281-1.05770.1478
320.0981820.67310.25209
330.0405670.27810.391074
34-0.054675-0.37480.354735
350.0091440.06270.47514
360.0536290.36770.357388


Partial Autocorrelation Function
Time lag kPACF(k)T-STATP-value
1-0.417071-2.85930.003156
2-0.552824-3.790.000214
3-0.166511-1.14150.129713
4-0.162803-1.11610.135023
5-0.00543-0.03720.485232
6-0.170118-1.16630.124694
70.0471180.3230.374054
80.0776850.53260.298416
9-0.11247-0.77110.222267
100.1405030.96320.170178
110.0423310.29020.386469
12-0.178732-1.22530.113279
130.0020760.01420.494352
14-0.092708-0.63560.264069
15-0.056542-0.38760.35002
16-0.126539-0.86750.195036
17-0.139586-0.9570.171744
18-0.239982-1.64520.053297
190.0340910.23370.40811
20-0.095747-0.65640.257381
21-0.166089-1.13870.13031
22-0.045075-0.3090.379336
230.1056490.72430.236239
24-0.143831-0.98610.164577
25-0.100125-0.68640.24791
260.0219590.15050.440489
270.0638970.43810.331676
280.0081070.05560.477958
290.0013450.00920.49634
30-0.011723-0.08040.468143
31-0.074429-0.51030.306128
32-0.085945-0.58920.279272
33-0.215149-1.4750.073442
34-0.052474-0.35970.360324
350.0355560.24380.404238
36-0.065381-0.44820.328022

\begin{tabular}{lllllllll}
\hline
Partial Autocorrelation Function \tabularnewline
Time lag k & PACF(k) & T-STAT & P-value \tabularnewline
1 & -0.417071 & -2.8593 & 0.003156 \tabularnewline
2 & -0.552824 & -3.79 & 0.000214 \tabularnewline
3 & -0.166511 & -1.1415 & 0.129713 \tabularnewline
4 & -0.162803 & -1.1161 & 0.135023 \tabularnewline
5 & -0.00543 & -0.0372 & 0.485232 \tabularnewline
6 & -0.170118 & -1.1663 & 0.124694 \tabularnewline
7 & 0.047118 & 0.323 & 0.374054 \tabularnewline
8 & 0.077685 & 0.5326 & 0.298416 \tabularnewline
9 & -0.11247 & -0.7711 & 0.222267 \tabularnewline
10 & 0.140503 & 0.9632 & 0.170178 \tabularnewline
11 & 0.042331 & 0.2902 & 0.386469 \tabularnewline
12 & -0.178732 & -1.2253 & 0.113279 \tabularnewline
13 & 0.002076 & 0.0142 & 0.494352 \tabularnewline
14 & -0.092708 & -0.6356 & 0.264069 \tabularnewline
15 & -0.056542 & -0.3876 & 0.35002 \tabularnewline
16 & -0.126539 & -0.8675 & 0.195036 \tabularnewline
17 & -0.139586 & -0.957 & 0.171744 \tabularnewline
18 & -0.239982 & -1.6452 & 0.053297 \tabularnewline
19 & 0.034091 & 0.2337 & 0.40811 \tabularnewline
20 & -0.095747 & -0.6564 & 0.257381 \tabularnewline
21 & -0.166089 & -1.1387 & 0.13031 \tabularnewline
22 & -0.045075 & -0.309 & 0.379336 \tabularnewline
23 & 0.105649 & 0.7243 & 0.236239 \tabularnewline
24 & -0.143831 & -0.9861 & 0.164577 \tabularnewline
25 & -0.100125 & -0.6864 & 0.24791 \tabularnewline
26 & 0.021959 & 0.1505 & 0.440489 \tabularnewline
27 & 0.063897 & 0.4381 & 0.331676 \tabularnewline
28 & 0.008107 & 0.0556 & 0.477958 \tabularnewline
29 & 0.001345 & 0.0092 & 0.49634 \tabularnewline
30 & -0.011723 & -0.0804 & 0.468143 \tabularnewline
31 & -0.074429 & -0.5103 & 0.306128 \tabularnewline
32 & -0.085945 & -0.5892 & 0.279272 \tabularnewline
33 & -0.215149 & -1.475 & 0.073442 \tabularnewline
34 & -0.052474 & -0.3597 & 0.360324 \tabularnewline
35 & 0.035556 & 0.2438 & 0.404238 \tabularnewline
36 & -0.065381 & -0.4482 & 0.328022 \tabularnewline
\hline
\end{tabular}
%Source: https://freestatistics.org/blog/index.php?pk=63256&T=2

[TABLE]
[ROW][C]Partial Autocorrelation Function[/C][/ROW]
[ROW][C]Time lag k[/C][C]PACF(k)[/C][C]T-STAT[/C][C]P-value[/C][/ROW]
[ROW][C]1[/C][C]-0.417071[/C][C]-2.8593[/C][C]0.003156[/C][/ROW]
[ROW][C]2[/C][C]-0.552824[/C][C]-3.79[/C][C]0.000214[/C][/ROW]
[ROW][C]3[/C][C]-0.166511[/C][C]-1.1415[/C][C]0.129713[/C][/ROW]
[ROW][C]4[/C][C]-0.162803[/C][C]-1.1161[/C][C]0.135023[/C][/ROW]
[ROW][C]5[/C][C]-0.00543[/C][C]-0.0372[/C][C]0.485232[/C][/ROW]
[ROW][C]6[/C][C]-0.170118[/C][C]-1.1663[/C][C]0.124694[/C][/ROW]
[ROW][C]7[/C][C]0.047118[/C][C]0.323[/C][C]0.374054[/C][/ROW]
[ROW][C]8[/C][C]0.077685[/C][C]0.5326[/C][C]0.298416[/C][/ROW]
[ROW][C]9[/C][C]-0.11247[/C][C]-0.7711[/C][C]0.222267[/C][/ROW]
[ROW][C]10[/C][C]0.140503[/C][C]0.9632[/C][C]0.170178[/C][/ROW]
[ROW][C]11[/C][C]0.042331[/C][C]0.2902[/C][C]0.386469[/C][/ROW]
[ROW][C]12[/C][C]-0.178732[/C][C]-1.2253[/C][C]0.113279[/C][/ROW]
[ROW][C]13[/C][C]0.002076[/C][C]0.0142[/C][C]0.494352[/C][/ROW]
[ROW][C]14[/C][C]-0.092708[/C][C]-0.6356[/C][C]0.264069[/C][/ROW]
[ROW][C]15[/C][C]-0.056542[/C][C]-0.3876[/C][C]0.35002[/C][/ROW]
[ROW][C]16[/C][C]-0.126539[/C][C]-0.8675[/C][C]0.195036[/C][/ROW]
[ROW][C]17[/C][C]-0.139586[/C][C]-0.957[/C][C]0.171744[/C][/ROW]
[ROW][C]18[/C][C]-0.239982[/C][C]-1.6452[/C][C]0.053297[/C][/ROW]
[ROW][C]19[/C][C]0.034091[/C][C]0.2337[/C][C]0.40811[/C][/ROW]
[ROW][C]20[/C][C]-0.095747[/C][C]-0.6564[/C][C]0.257381[/C][/ROW]
[ROW][C]21[/C][C]-0.166089[/C][C]-1.1387[/C][C]0.13031[/C][/ROW]
[ROW][C]22[/C][C]-0.045075[/C][C]-0.309[/C][C]0.379336[/C][/ROW]
[ROW][C]23[/C][C]0.105649[/C][C]0.7243[/C][C]0.236239[/C][/ROW]
[ROW][C]24[/C][C]-0.143831[/C][C]-0.9861[/C][C]0.164577[/C][/ROW]
[ROW][C]25[/C][C]-0.100125[/C][C]-0.6864[/C][C]0.24791[/C][/ROW]
[ROW][C]26[/C][C]0.021959[/C][C]0.1505[/C][C]0.440489[/C][/ROW]
[ROW][C]27[/C][C]0.063897[/C][C]0.4381[/C][C]0.331676[/C][/ROW]
[ROW][C]28[/C][C]0.008107[/C][C]0.0556[/C][C]0.477958[/C][/ROW]
[ROW][C]29[/C][C]0.001345[/C][C]0.0092[/C][C]0.49634[/C][/ROW]
[ROW][C]30[/C][C]-0.011723[/C][C]-0.0804[/C][C]0.468143[/C][/ROW]
[ROW][C]31[/C][C]-0.074429[/C][C]-0.5103[/C][C]0.306128[/C][/ROW]
[ROW][C]32[/C][C]-0.085945[/C][C]-0.5892[/C][C]0.279272[/C][/ROW]
[ROW][C]33[/C][C]-0.215149[/C][C]-1.475[/C][C]0.073442[/C][/ROW]
[ROW][C]34[/C][C]-0.052474[/C][C]-0.3597[/C][C]0.360324[/C][/ROW]
[ROW][C]35[/C][C]0.035556[/C][C]0.2438[/C][C]0.404238[/C][/ROW]
[ROW][C]36[/C][C]-0.065381[/C][C]-0.4482[/C][C]0.328022[/C][/ROW]
[/TABLE]
Source: https://freestatistics.org/blog/index.php?pk=63256&T=2

Globally Unique Identifier (entire table): ba.freestatistics.org/blog/index.php?pk=63256&T=2

As an alternative you can also use a QR Code:  

The GUIDs for individual cells are displayed in the table below:

Partial Autocorrelation Function
Time lag kPACF(k)T-STATP-value
1-0.417071-2.85930.003156
2-0.552824-3.790.000214
3-0.166511-1.14150.129713
4-0.162803-1.11610.135023
5-0.00543-0.03720.485232
6-0.170118-1.16630.124694
70.0471180.3230.374054
80.0776850.53260.298416
9-0.11247-0.77110.222267
100.1405030.96320.170178
110.0423310.29020.386469
12-0.178732-1.22530.113279
130.0020760.01420.494352
14-0.092708-0.63560.264069
15-0.056542-0.38760.35002
16-0.126539-0.86750.195036
17-0.139586-0.9570.171744
18-0.239982-1.64520.053297
190.0340910.23370.40811
20-0.095747-0.65640.257381
21-0.166089-1.13870.13031
22-0.045075-0.3090.379336
230.1056490.72430.236239
24-0.143831-0.98610.164577
25-0.100125-0.68640.24791
260.0219590.15050.440489
270.0638970.43810.331676
280.0081070.05560.477958
290.0013450.00920.49634
30-0.011723-0.08040.468143
31-0.074429-0.51030.306128
32-0.085945-0.58920.279272
33-0.215149-1.4750.073442
34-0.052474-0.35970.360324
350.0355560.24380.404238
36-0.065381-0.44820.328022


Parameters (Session):
par1 = 36 ; par2 = -0.2 ; par3 = 1 ; par4 = 1 ; par5 = 12 ; par6 = MA ; par7 = 0.95 ;
Parameters (R input):
par1 = 36 ; par2 = -0.2 ; par3 = 1 ; par4 = 1 ; par5 = 12 ; par6 = MA ; par7 = 0.95 ;
R code (references can be found in the software module):
if (par1 == 'Default') {
par1 = 10*log10(length(x))
} else {
par1 <- as.numeric(par1)
}
par2 <- as.numeric(par2)
par3 <- as.numeric(par3)
par4 <- as.numeric(par4)
par5 <- as.numeric(par5)
if (par6 == 'White Noise') par6 <- 'white' else par6 <- 'ma'
par7 <- as.numeric(par7)
if (par2 == 0) {
x <- log(x)
} else {
x <- (x ^ par2 - 1) / par2
}
if (par3 > 0) x <- diff(x,lag=1,difference=par3)
if (par4 > 0) x <- diff(x,lag=par5,difference=par4)
bitmap(file='pic1.png')
racf <- acf(x, par1, main='Autocorrelation', xlab='time lag', ylab='ACF', ci.type=par6, ci=par7, sub=paste('(lambda=',par2,', d=',par3,', D=',par4,', CI=', par7, ', CI type=',par6,')',sep=''))
dev.off()
bitmap(file='pic2.png')
rpacf <- pacf(x,par1,main='Partial Autocorrelation',xlab='lags',ylab='PACF')
dev.off()
(myacf <- c(racf$acf))
(mypacf <- c(rpacf$acf))
lengthx <- length(x)
sqrtn <- sqrt(lengthx)
load(file='createtable')
a<-table.start()
a<-table.row.start(a)
a<-table.element(a,'Autocorrelation Function',4,TRUE)
a<-table.row.end(a)
a<-table.row.start(a)
a<-table.element(a,'Time lag k',header=TRUE)
a<-table.element(a,hyperlink('basics.htm','ACF(k)','click here for more information about the Autocorrelation Function'),header=TRUE)
a<-table.element(a,'T-STAT',header=TRUE)
a<-table.element(a,'P-value',header=TRUE)
a<-table.row.end(a)
for (i in 2:(par1+1)) {
a<-table.row.start(a)
a<-table.element(a,i-1,header=TRUE)
a<-table.element(a,round(myacf[i],6))
mytstat <- myacf[i]*sqrtn
a<-table.element(a,round(mytstat,4))
a<-table.element(a,round(1-pt(abs(mytstat),lengthx),6))
a<-table.row.end(a)
}
a<-table.end(a)
table.save(a,file='mytable.tab')
a<-table.start()
a<-table.row.start(a)
a<-table.element(a,'Partial Autocorrelation Function',4,TRUE)
a<-table.row.end(a)
a<-table.row.start(a)
a<-table.element(a,'Time lag k',header=TRUE)
a<-table.element(a,hyperlink('basics.htm','PACF(k)','click here for more information about the Partial Autocorrelation Function'),header=TRUE)
a<-table.element(a,'T-STAT',header=TRUE)
a<-table.element(a,'P-value',header=TRUE)
a<-table.row.end(a)
for (i in 1:par1) {
a<-table.row.start(a)
a<-table.element(a,i,header=TRUE)
a<-table.element(a,round(mypacf[i],6))
mytstat <- mypacf[i]*sqrtn
a<-table.element(a,round(mytstat,4))
a<-table.element(a,round(1-pt(abs(mytstat),lengthx),6))
a<-table.row.end(a)
}
a<-table.end(a)
table.save(a,file='mytable1.tab')