Free Statistics

of Irreproducible Research!

Author's title

Author*The author of this computation has been verified*
R Software Modulerwasp_exponentialsmoothing.wasp
Title produced by softwareExponential Smoothing
Date of computationFri, 04 Dec 2009 03:37:14 -0700
Cite this page as followsStatistical Computations at FreeStatistics.org, Office for Research Development and Education, URL https://freestatistics.org/blog/index.php?v=date/2009/Dec/04/t1259923076fp0cna71ygw5du1.htm/, Retrieved Sat, 27 Apr 2024 14:15:27 +0000
Statistical Computations at FreeStatistics.org, Office for Research Development and Education, URL https://freestatistics.org/blog/index.php?pk=63262, Retrieved Sat, 27 Apr 2024 14:15:27 +0000
QR Codes:

Original text written by user:
IsPrivate?No (this computation is public)
User-defined keywords
Estimated Impact137
Family? (F = Feedback message, R = changed R code, M = changed R Module, P = changed Parameters, D = changed Data)
-     [Univariate Data Series] [data set] [2008-12-01 19:54:57] [b98453cac15ba1066b407e146608df68]
- RMP   [Exponential Smoothing] [] [2009-11-27 15:04:36] [b98453cac15ba1066b407e146608df68]
-   PD    [Exponential Smoothing] [workshop 9 bereke...] [2009-12-03 18:00:28] [eaf42bcf5162b5692bb3c7f9d4636222]
-   PD        [Exponential Smoothing] [review workshop 9] [2009-12-04 10:37:14] [78d370e6d5f4594e9982a5085e7604c6] [Current]
-    D          [Exponential Smoothing] [review workshop 9] [2009-12-06 10:46:29] [eaf42bcf5162b5692bb3c7f9d4636222]
Feedback Forum

Post a new message
Dataseries X:
12.610
10.862
52.929
56.902
81.776
87.876
82.103
72.846
60.632
33.521
15.342
7.758
8.668
13.082
38.157
58.263
81.153
88.476
72.329
75.845
61.108
37.665
12.755
2.793
12.935
19.533
33.404
52.074
70.735
69.702
61.656
82.993
53.990
32.283
15.686
2.713
12.842
19.244
48.488
54.464
84.192
84.458
85.793
75.163
68.212
49.233
24.302
5.402
15.058
33.559
70.358
85.934
94.452
129.305
113.882
107.256
94.274
57.842
26.611
14.521


Summary of computational transaction
Raw Inputview raw input (R code)
Raw Outputview raw output of R engine
Computing time2 seconds
R Server'Gwilym Jenkins' @ 72.249.127.135

\begin{tabular}{lllllllll}
\hline
Summary of computational transaction \tabularnewline
Raw Input & view raw input (R code)  \tabularnewline
Raw Output & view raw output of R engine  \tabularnewline
Computing time & 2 seconds \tabularnewline
R Server & 'Gwilym Jenkins' @ 72.249.127.135 \tabularnewline
\hline
\end{tabular}
%Source: https://freestatistics.org/blog/index.php?pk=63262&T=0

[TABLE]
[ROW][C]Summary of computational transaction[/C][/ROW]
[ROW][C]Raw Input[/C][C]view raw input (R code) [/C][/ROW]
[ROW][C]Raw Output[/C][C]view raw output of R engine [/C][/ROW]
[ROW][C]Computing time[/C][C]2 seconds[/C][/ROW]
[ROW][C]R Server[/C][C]'Gwilym Jenkins' @ 72.249.127.135[/C][/ROW]
[/TABLE]
Source: https://freestatistics.org/blog/index.php?pk=63262&T=0

Globally Unique Identifier (entire table): ba.freestatistics.org/blog/index.php?pk=63262&T=0

As an alternative you can also use a QR Code:  

The GUIDs for individual cells are displayed in the table below:

Summary of computational transaction
Raw Inputview raw input (R code)
Raw Outputview raw output of R engine
Computing time2 seconds
R Server'Gwilym Jenkins' @ 72.249.127.135


Estimated Parameters of Exponential Smoothing
ParameterValue
alpha0.0856933077970092
beta0.133966475305803
gamma0.210070820415668

\begin{tabular}{lllllllll}
\hline
Estimated Parameters of Exponential Smoothing \tabularnewline
Parameter & Value \tabularnewline
alpha & 0.0856933077970092 \tabularnewline
beta & 0.133966475305803 \tabularnewline
gamma & 0.210070820415668 \tabularnewline
\hline
\end{tabular}
%Source: https://freestatistics.org/blog/index.php?pk=63262&T=1

[TABLE]
[ROW][C]Estimated Parameters of Exponential Smoothing[/C][/ROW]
[ROW][C]Parameter[/C][C]Value[/C][/ROW]
[ROW][C]alpha[/C][C]0.0856933077970092[/C][/ROW]
[ROW][C]beta[/C][C]0.133966475305803[/C][/ROW]
[ROW][C]gamma[/C][C]0.210070820415668[/C][/ROW]
[/TABLE]
Source: https://freestatistics.org/blog/index.php?pk=63262&T=1

Globally Unique Identifier (entire table): ba.freestatistics.org/blog/index.php?pk=63262&T=1

As an alternative you can also use a QR Code:  

The GUIDs for individual cells are displayed in the table below:

Estimated Parameters of Exponential Smoothing
ParameterValue
alpha0.0856933077970092
beta0.133966475305803
gamma0.210070820415668


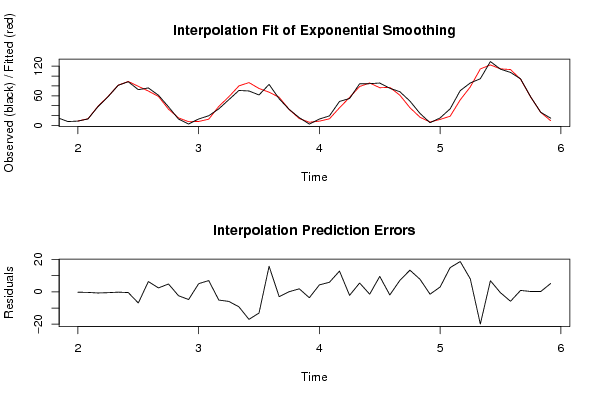
Interpolation Forecasts of Exponential Smoothing
tObservedFittedResiduals
138.6688.90730328460187-0.239303284601871
1413.08213.4491526080878-0.367152608087789
1538.15738.8689753281552-0.711975328155155
1658.26358.7788482637078-0.515848263707817
1781.15381.3648054271869-0.211805427186917
1888.47688.927276416743-0.451276416742985
1972.32979.2169136883903-6.88791368839036
2075.84569.50139269706776.34360730293231
2161.10858.70101054810812.40698945189192
2237.66532.83570178598564.82929821401444
2312.75515.1771948283939-2.42219482839394
242.7937.54035851209682-4.74735851209682
2512.9357.900451592575585.03454840742442
2619.53312.59567824931816.9373217506819
2733.40438.4897169640234-5.08571696402337
2852.07457.9903263769801-5.91632637698005
2970.73579.9827780515775-9.24777805157747
3069.70286.694324305443-16.9923243054429
3161.65674.7322227784386-13.0762227784386
3282.99367.236855635970415.7561443640296
3353.9956.9540077741217-2.96400777412166
3432.28332.20650788191770.076492118082264
3515.68613.82510626006361.86089373993636
362.7136.34659467776843-3.63359467776843
3712.8428.567829006388494.27417099361151
3819.24413.32541240009355.91858759990655
3948.48835.681922463767912.8060775362321
4054.46456.6368096885508-2.17280968855079
4184.19278.73664570308565.45535429691436
4284.45885.9225951108235-1.46459511082354
4385.79376.25933569664189.53366430335817
4475.16377.0882215200617-1.92522152006171
4568.21261.15890327142387.05309672857624
4649.23335.869733532178813.3632664678212
4724.30216.53852749538427.7634725046158
485.4026.85831393575046-1.45631393575046
4915.05812.07949107129332.97850892870668
5033.55918.596043912744914.9629560872551
5170.35851.670217885329918.6877821146701
5285.93477.9185619173658.01543808263507
5394.452114.34047554971-19.8884755497099
54129.305122.437032486426.86796751358001
55113.882114.427829459730-0.545829459730129
56107.256113.081087749935-5.82508774993509
5794.27493.40007808416750.873921915832483
5857.84257.63102823219550.210971767804516
5926.61126.44328449916220.167715500837801
6014.5219.351595898711445.16940410128856

\begin{tabular}{lllllllll}
\hline
Interpolation Forecasts of Exponential Smoothing \tabularnewline
t & Observed & Fitted & Residuals \tabularnewline
13 & 8.668 & 8.90730328460187 & -0.239303284601871 \tabularnewline
14 & 13.082 & 13.4491526080878 & -0.367152608087789 \tabularnewline
15 & 38.157 & 38.8689753281552 & -0.711975328155155 \tabularnewline
16 & 58.263 & 58.7788482637078 & -0.515848263707817 \tabularnewline
17 & 81.153 & 81.3648054271869 & -0.211805427186917 \tabularnewline
18 & 88.476 & 88.927276416743 & -0.451276416742985 \tabularnewline
19 & 72.329 & 79.2169136883903 & -6.88791368839036 \tabularnewline
20 & 75.845 & 69.5013926970677 & 6.34360730293231 \tabularnewline
21 & 61.108 & 58.7010105481081 & 2.40698945189192 \tabularnewline
22 & 37.665 & 32.8357017859856 & 4.82929821401444 \tabularnewline
23 & 12.755 & 15.1771948283939 & -2.42219482839394 \tabularnewline
24 & 2.793 & 7.54035851209682 & -4.74735851209682 \tabularnewline
25 & 12.935 & 7.90045159257558 & 5.03454840742442 \tabularnewline
26 & 19.533 & 12.5956782493181 & 6.9373217506819 \tabularnewline
27 & 33.404 & 38.4897169640234 & -5.08571696402337 \tabularnewline
28 & 52.074 & 57.9903263769801 & -5.91632637698005 \tabularnewline
29 & 70.735 & 79.9827780515775 & -9.24777805157747 \tabularnewline
30 & 69.702 & 86.694324305443 & -16.9923243054429 \tabularnewline
31 & 61.656 & 74.7322227784386 & -13.0762227784386 \tabularnewline
32 & 82.993 & 67.2368556359704 & 15.7561443640296 \tabularnewline
33 & 53.99 & 56.9540077741217 & -2.96400777412166 \tabularnewline
34 & 32.283 & 32.2065078819177 & 0.076492118082264 \tabularnewline
35 & 15.686 & 13.8251062600636 & 1.86089373993636 \tabularnewline
36 & 2.713 & 6.34659467776843 & -3.63359467776843 \tabularnewline
37 & 12.842 & 8.56782900638849 & 4.27417099361151 \tabularnewline
38 & 19.244 & 13.3254124000935 & 5.91858759990655 \tabularnewline
39 & 48.488 & 35.6819224637679 & 12.8060775362321 \tabularnewline
40 & 54.464 & 56.6368096885508 & -2.17280968855079 \tabularnewline
41 & 84.192 & 78.7366457030856 & 5.45535429691436 \tabularnewline
42 & 84.458 & 85.9225951108235 & -1.46459511082354 \tabularnewline
43 & 85.793 & 76.2593356966418 & 9.53366430335817 \tabularnewline
44 & 75.163 & 77.0882215200617 & -1.92522152006171 \tabularnewline
45 & 68.212 & 61.1589032714238 & 7.05309672857624 \tabularnewline
46 & 49.233 & 35.8697335321788 & 13.3632664678212 \tabularnewline
47 & 24.302 & 16.5385274953842 & 7.7634725046158 \tabularnewline
48 & 5.402 & 6.85831393575046 & -1.45631393575046 \tabularnewline
49 & 15.058 & 12.0794910712933 & 2.97850892870668 \tabularnewline
50 & 33.559 & 18.5960439127449 & 14.9629560872551 \tabularnewline
51 & 70.358 & 51.6702178853299 & 18.6877821146701 \tabularnewline
52 & 85.934 & 77.918561917365 & 8.01543808263507 \tabularnewline
53 & 94.452 & 114.34047554971 & -19.8884755497099 \tabularnewline
54 & 129.305 & 122.43703248642 & 6.86796751358001 \tabularnewline
55 & 113.882 & 114.427829459730 & -0.545829459730129 \tabularnewline
56 & 107.256 & 113.081087749935 & -5.82508774993509 \tabularnewline
57 & 94.274 & 93.4000780841675 & 0.873921915832483 \tabularnewline
58 & 57.842 & 57.6310282321955 & 0.210971767804516 \tabularnewline
59 & 26.611 & 26.4432844991622 & 0.167715500837801 \tabularnewline
60 & 14.521 & 9.35159589871144 & 5.16940410128856 \tabularnewline
\hline
\end{tabular}
%Source: https://freestatistics.org/blog/index.php?pk=63262&T=2

[TABLE]
[ROW][C]Interpolation Forecasts of Exponential Smoothing[/C][/ROW]
[ROW][C]t[/C][C]Observed[/C][C]Fitted[/C][C]Residuals[/C][/ROW]
[ROW][C]13[/C][C]8.668[/C][C]8.90730328460187[/C][C]-0.239303284601871[/C][/ROW]
[ROW][C]14[/C][C]13.082[/C][C]13.4491526080878[/C][C]-0.367152608087789[/C][/ROW]
[ROW][C]15[/C][C]38.157[/C][C]38.8689753281552[/C][C]-0.711975328155155[/C][/ROW]
[ROW][C]16[/C][C]58.263[/C][C]58.7788482637078[/C][C]-0.515848263707817[/C][/ROW]
[ROW][C]17[/C][C]81.153[/C][C]81.3648054271869[/C][C]-0.211805427186917[/C][/ROW]
[ROW][C]18[/C][C]88.476[/C][C]88.927276416743[/C][C]-0.451276416742985[/C][/ROW]
[ROW][C]19[/C][C]72.329[/C][C]79.2169136883903[/C][C]-6.88791368839036[/C][/ROW]
[ROW][C]20[/C][C]75.845[/C][C]69.5013926970677[/C][C]6.34360730293231[/C][/ROW]
[ROW][C]21[/C][C]61.108[/C][C]58.7010105481081[/C][C]2.40698945189192[/C][/ROW]
[ROW][C]22[/C][C]37.665[/C][C]32.8357017859856[/C][C]4.82929821401444[/C][/ROW]
[ROW][C]23[/C][C]12.755[/C][C]15.1771948283939[/C][C]-2.42219482839394[/C][/ROW]
[ROW][C]24[/C][C]2.793[/C][C]7.54035851209682[/C][C]-4.74735851209682[/C][/ROW]
[ROW][C]25[/C][C]12.935[/C][C]7.90045159257558[/C][C]5.03454840742442[/C][/ROW]
[ROW][C]26[/C][C]19.533[/C][C]12.5956782493181[/C][C]6.9373217506819[/C][/ROW]
[ROW][C]27[/C][C]33.404[/C][C]38.4897169640234[/C][C]-5.08571696402337[/C][/ROW]
[ROW][C]28[/C][C]52.074[/C][C]57.9903263769801[/C][C]-5.91632637698005[/C][/ROW]
[ROW][C]29[/C][C]70.735[/C][C]79.9827780515775[/C][C]-9.24777805157747[/C][/ROW]
[ROW][C]30[/C][C]69.702[/C][C]86.694324305443[/C][C]-16.9923243054429[/C][/ROW]
[ROW][C]31[/C][C]61.656[/C][C]74.7322227784386[/C][C]-13.0762227784386[/C][/ROW]
[ROW][C]32[/C][C]82.993[/C][C]67.2368556359704[/C][C]15.7561443640296[/C][/ROW]
[ROW][C]33[/C][C]53.99[/C][C]56.9540077741217[/C][C]-2.96400777412166[/C][/ROW]
[ROW][C]34[/C][C]32.283[/C][C]32.2065078819177[/C][C]0.076492118082264[/C][/ROW]
[ROW][C]35[/C][C]15.686[/C][C]13.8251062600636[/C][C]1.86089373993636[/C][/ROW]
[ROW][C]36[/C][C]2.713[/C][C]6.34659467776843[/C][C]-3.63359467776843[/C][/ROW]
[ROW][C]37[/C][C]12.842[/C][C]8.56782900638849[/C][C]4.27417099361151[/C][/ROW]
[ROW][C]38[/C][C]19.244[/C][C]13.3254124000935[/C][C]5.91858759990655[/C][/ROW]
[ROW][C]39[/C][C]48.488[/C][C]35.6819224637679[/C][C]12.8060775362321[/C][/ROW]
[ROW][C]40[/C][C]54.464[/C][C]56.6368096885508[/C][C]-2.17280968855079[/C][/ROW]
[ROW][C]41[/C][C]84.192[/C][C]78.7366457030856[/C][C]5.45535429691436[/C][/ROW]
[ROW][C]42[/C][C]84.458[/C][C]85.9225951108235[/C][C]-1.46459511082354[/C][/ROW]
[ROW][C]43[/C][C]85.793[/C][C]76.2593356966418[/C][C]9.53366430335817[/C][/ROW]
[ROW][C]44[/C][C]75.163[/C][C]77.0882215200617[/C][C]-1.92522152006171[/C][/ROW]
[ROW][C]45[/C][C]68.212[/C][C]61.1589032714238[/C][C]7.05309672857624[/C][/ROW]
[ROW][C]46[/C][C]49.233[/C][C]35.8697335321788[/C][C]13.3632664678212[/C][/ROW]
[ROW][C]47[/C][C]24.302[/C][C]16.5385274953842[/C][C]7.7634725046158[/C][/ROW]
[ROW][C]48[/C][C]5.402[/C][C]6.85831393575046[/C][C]-1.45631393575046[/C][/ROW]
[ROW][C]49[/C][C]15.058[/C][C]12.0794910712933[/C][C]2.97850892870668[/C][/ROW]
[ROW][C]50[/C][C]33.559[/C][C]18.5960439127449[/C][C]14.9629560872551[/C][/ROW]
[ROW][C]51[/C][C]70.358[/C][C]51.6702178853299[/C][C]18.6877821146701[/C][/ROW]
[ROW][C]52[/C][C]85.934[/C][C]77.918561917365[/C][C]8.01543808263507[/C][/ROW]
[ROW][C]53[/C][C]94.452[/C][C]114.34047554971[/C][C]-19.8884755497099[/C][/ROW]
[ROW][C]54[/C][C]129.305[/C][C]122.43703248642[/C][C]6.86796751358001[/C][/ROW]
[ROW][C]55[/C][C]113.882[/C][C]114.427829459730[/C][C]-0.545829459730129[/C][/ROW]
[ROW][C]56[/C][C]107.256[/C][C]113.081087749935[/C][C]-5.82508774993509[/C][/ROW]
[ROW][C]57[/C][C]94.274[/C][C]93.4000780841675[/C][C]0.873921915832483[/C][/ROW]
[ROW][C]58[/C][C]57.842[/C][C]57.6310282321955[/C][C]0.210971767804516[/C][/ROW]
[ROW][C]59[/C][C]26.611[/C][C]26.4432844991622[/C][C]0.167715500837801[/C][/ROW]
[ROW][C]60[/C][C]14.521[/C][C]9.35159589871144[/C][C]5.16940410128856[/C][/ROW]
[/TABLE]
Source: https://freestatistics.org/blog/index.php?pk=63262&T=2

Globally Unique Identifier (entire table): ba.freestatistics.org/blog/index.php?pk=63262&T=2

As an alternative you can also use a QR Code:  

The GUIDs for individual cells are displayed in the table below:

Interpolation Forecasts of Exponential Smoothing
tObservedFittedResiduals
138.6688.90730328460187-0.239303284601871
1413.08213.4491526080878-0.367152608087789
1538.15738.8689753281552-0.711975328155155
1658.26358.7788482637078-0.515848263707817
1781.15381.3648054271869-0.211805427186917
1888.47688.927276416743-0.451276416742985
1972.32979.2169136883903-6.88791368839036
2075.84569.50139269706776.34360730293231
2161.10858.70101054810812.40698945189192
2237.66532.83570178598564.82929821401444
2312.75515.1771948283939-2.42219482839394
242.7937.54035851209682-4.74735851209682
2512.9357.900451592575585.03454840742442
2619.53312.59567824931816.9373217506819
2733.40438.4897169640234-5.08571696402337
2852.07457.9903263769801-5.91632637698005
2970.73579.9827780515775-9.24777805157747
3069.70286.694324305443-16.9923243054429
3161.65674.7322227784386-13.0762227784386
3282.99367.236855635970415.7561443640296
3353.9956.9540077741217-2.96400777412166
3432.28332.20650788191770.076492118082264
3515.68613.82510626006361.86089373993636
362.7136.34659467776843-3.63359467776843
3712.8428.567829006388494.27417099361151
3819.24413.32541240009355.91858759990655
3948.48835.681922463767912.8060775362321
4054.46456.6368096885508-2.17280968855079
4184.19278.73664570308565.45535429691436
4284.45885.9225951108235-1.46459511082354
4385.79376.25933569664189.53366430335817
4475.16377.0882215200617-1.92522152006171
4568.21261.15890327142387.05309672857624
4649.23335.869733532178813.3632664678212
4724.30216.53852749538427.7634725046158
485.4026.85831393575046-1.45631393575046
4915.05812.07949107129332.97850892870668
5033.55918.596043912744914.9629560872551
5170.35851.670217885329918.6877821146701
5285.93477.9185619173658.01543808263507
5394.452114.34047554971-19.8884755497099
54129.305122.437032486426.86796751358001
55113.882114.427829459730-0.545829459730129
56107.256113.081087749935-5.82508774993509
5794.27493.40007808416750.873921915832483
5857.84257.63102823219550.210971767804516
5926.61126.44328449916220.167715500837801
6014.5219.351595898711445.16940410128856


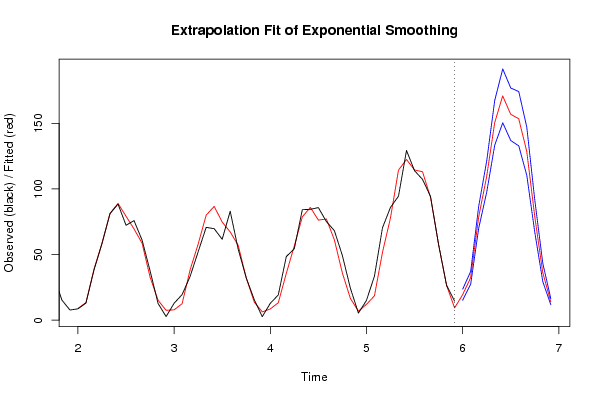
Extrapolation Forecasts of Exponential Smoothing
tForecast95% Lower Bound95% Upper Bound
6119.418445646790615.206593500623823.6302977929575
6232.321965269489327.477870791493837.1660597474849
6378.460375948431570.086117951440786.8346339454222
64109.41272297222797.5294342771035121.296011667351
65150.387317610432133.341551005239167.433084215626
66170.851430593446150.344425896385191.358435290508
67156.846912860106136.833576216481176.860249503732
68153.451626386386132.794137037388174.109115735384
69128.706729261245110.376448001314147.037010521176
7079.195354419452966.939799757236791.450909081669
7136.312660114152229.354629568333943.2706906599705
7214.105845889762111.782879833976116.4288119455482

\begin{tabular}{lllllllll}
\hline
Extrapolation Forecasts of Exponential Smoothing \tabularnewline
t & Forecast & 95% Lower Bound & 95% Upper Bound \tabularnewline
61 & 19.4184456467906 & 15.2065935006238 & 23.6302977929575 \tabularnewline
62 & 32.3219652694893 & 27.4778707914938 & 37.1660597474849 \tabularnewline
63 & 78.4603759484315 & 70.0861179514407 & 86.8346339454222 \tabularnewline
64 & 109.412722972227 & 97.5294342771035 & 121.296011667351 \tabularnewline
65 & 150.387317610432 & 133.341551005239 & 167.433084215626 \tabularnewline
66 & 170.851430593446 & 150.344425896385 & 191.358435290508 \tabularnewline
67 & 156.846912860106 & 136.833576216481 & 176.860249503732 \tabularnewline
68 & 153.451626386386 & 132.794137037388 & 174.109115735384 \tabularnewline
69 & 128.706729261245 & 110.376448001314 & 147.037010521176 \tabularnewline
70 & 79.1953544194529 & 66.9397997572367 & 91.450909081669 \tabularnewline
71 & 36.3126601141522 & 29.3546295683339 & 43.2706906599705 \tabularnewline
72 & 14.1058458897621 & 11.7828798339761 & 16.4288119455482 \tabularnewline
\hline
\end{tabular}
%Source: https://freestatistics.org/blog/index.php?pk=63262&T=3

[TABLE]
[ROW][C]Extrapolation Forecasts of Exponential Smoothing[/C][/ROW]
[ROW][C]t[/C][C]Forecast[/C][C]95% Lower Bound[/C][C]95% Upper Bound[/C][/ROW]
[ROW][C]61[/C][C]19.4184456467906[/C][C]15.2065935006238[/C][C]23.6302977929575[/C][/ROW]
[ROW][C]62[/C][C]32.3219652694893[/C][C]27.4778707914938[/C][C]37.1660597474849[/C][/ROW]
[ROW][C]63[/C][C]78.4603759484315[/C][C]70.0861179514407[/C][C]86.8346339454222[/C][/ROW]
[ROW][C]64[/C][C]109.412722972227[/C][C]97.5294342771035[/C][C]121.296011667351[/C][/ROW]
[ROW][C]65[/C][C]150.387317610432[/C][C]133.341551005239[/C][C]167.433084215626[/C][/ROW]
[ROW][C]66[/C][C]170.851430593446[/C][C]150.344425896385[/C][C]191.358435290508[/C][/ROW]
[ROW][C]67[/C][C]156.846912860106[/C][C]136.833576216481[/C][C]176.860249503732[/C][/ROW]
[ROW][C]68[/C][C]153.451626386386[/C][C]132.794137037388[/C][C]174.109115735384[/C][/ROW]
[ROW][C]69[/C][C]128.706729261245[/C][C]110.376448001314[/C][C]147.037010521176[/C][/ROW]
[ROW][C]70[/C][C]79.1953544194529[/C][C]66.9397997572367[/C][C]91.450909081669[/C][/ROW]
[ROW][C]71[/C][C]36.3126601141522[/C][C]29.3546295683339[/C][C]43.2706906599705[/C][/ROW]
[ROW][C]72[/C][C]14.1058458897621[/C][C]11.7828798339761[/C][C]16.4288119455482[/C][/ROW]
[/TABLE]
Source: https://freestatistics.org/blog/index.php?pk=63262&T=3

Globally Unique Identifier (entire table): ba.freestatistics.org/blog/index.php?pk=63262&T=3

As an alternative you can also use a QR Code:  

The GUIDs for individual cells are displayed in the table below:

Extrapolation Forecasts of Exponential Smoothing
tForecast95% Lower Bound95% Upper Bound
6119.418445646790615.206593500623823.6302977929575
6232.321965269489327.477870791493837.1660597474849
6378.460375948431570.086117951440786.8346339454222
64109.41272297222797.5294342771035121.296011667351
65150.387317610432133.341551005239167.433084215626
66170.851430593446150.344425896385191.358435290508
67156.846912860106136.833576216481176.860249503732
68153.451626386386132.794137037388174.109115735384
69128.706729261245110.376448001314147.037010521176
7079.195354419452966.939799757236791.450909081669
7136.312660114152229.354629568333943.2706906599705
7214.105845889762111.782879833976116.4288119455482


Parameters (Session):
par1 = 12 ; par2 = Triple ; par3 = multiplicative ;
Parameters (R input):
par1 = 12 ; par2 = Triple ; par3 = multiplicative ;
R code (references can be found in the software module):
par1 <- as.numeric(par1)
if (par2 == 'Single') K <- 1
if (par2 == 'Double') K <- 2
if (par2 == 'Triple') K <- par1
nx <- length(x)
nxmK <- nx - K
x <- ts(x, frequency = par1)
if (par2 == 'Single') fit <- HoltWinters(x, gamma=0, beta=0)
if (par2 == 'Double') fit <- HoltWinters(x, gamma=0)
if (par2 == 'Triple') fit <- HoltWinters(x, seasonal=par3)
fit
myresid <- x - fit$fitted[,'xhat']
bitmap(file='test1.png')
op <- par(mfrow=c(2,1))
plot(fit,ylab='Observed (black) / Fitted (red)',main='Interpolation Fit of Exponential Smoothing')
plot(myresid,ylab='Residuals',main='Interpolation Prediction Errors')
par(op)
dev.off()
bitmap(file='test2.png')
p <- predict(fit, par1, prediction.interval=TRUE)
np <- length(p[,1])
plot(fit,p,ylab='Observed (black) / Fitted (red)',main='Extrapolation Fit of Exponential Smoothing')
dev.off()
bitmap(file='test3.png')
op <- par(mfrow = c(2,2))
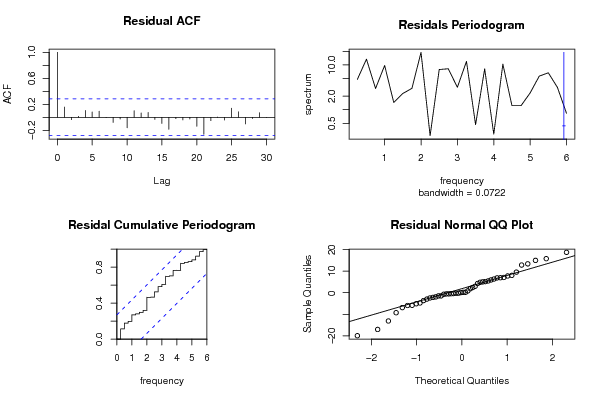
acf(as.numeric(myresid),lag.max = nx/2,main='Residual ACF')
spectrum(myresid,main='Residals Periodogram')
cpgram(myresid,main='Residal Cumulative Periodogram')
qqnorm(myresid,main='Residual Normal QQ Plot')
qqline(myresid)
par(op)
dev.off()
load(file='createtable')
a<-table.start()
a<-table.row.start(a)
a<-table.element(a,'Estimated Parameters of Exponential Smoothing',2,TRUE)
a<-table.row.end(a)
a<-table.row.start(a)
a<-table.element(a,'Parameter',header=TRUE)
a<-table.element(a,'Value',header=TRUE)
a<-table.row.end(a)
a<-table.row.start(a)
a<-table.element(a,'alpha',header=TRUE)
a<-table.element(a,fit$alpha)
a<-table.row.end(a)
a<-table.row.start(a)
a<-table.element(a,'beta',header=TRUE)
a<-table.element(a,fit$beta)
a<-table.row.end(a)
a<-table.row.start(a)
a<-table.element(a,'gamma',header=TRUE)
a<-table.element(a,fit$gamma)
a<-table.row.end(a)
a<-table.end(a)
table.save(a,file='mytable.tab')
a<-table.start()
a<-table.row.start(a)
a<-table.element(a,'Interpolation Forecasts of Exponential Smoothing',4,TRUE)
a<-table.row.end(a)
a<-table.row.start(a)
a<-table.element(a,'t',header=TRUE)
a<-table.element(a,'Observed',header=TRUE)
a<-table.element(a,'Fitted',header=TRUE)
a<-table.element(a,'Residuals',header=TRUE)
a<-table.row.end(a)
for (i in 1:nxmK) {
a<-table.row.start(a)
a<-table.element(a,i+K,header=TRUE)
a<-table.element(a,x[i+K])
a<-table.element(a,fit$fitted[i,'xhat'])
a<-table.element(a,myresid[i])
a<-table.row.end(a)
}
a<-table.end(a)
table.save(a,file='mytable1.tab')
a<-table.start()
a<-table.row.start(a)
a<-table.element(a,'Extrapolation Forecasts of Exponential Smoothing',4,TRUE)
a<-table.row.end(a)
a<-table.row.start(a)
a<-table.element(a,'t',header=TRUE)
a<-table.element(a,'Forecast',header=TRUE)
a<-table.element(a,'95% Lower Bound',header=TRUE)
a<-table.element(a,'95% Upper Bound',header=TRUE)
a<-table.row.end(a)
for (i in 1:np) {
a<-table.row.start(a)
a<-table.element(a,nx+i,header=TRUE)
a<-table.element(a,p[i,'fit'])
a<-table.element(a,p[i,'lwr'])
a<-table.element(a,p[i,'upr'])
a<-table.row.end(a)
}
a<-table.end(a)
table.save(a,file='mytable2.tab')