Free Statistics
of Irreproducible Research!
Description of Statistical Computation | |||||||||||||||||||||||||||||||||||||||||
|---|---|---|---|---|---|---|---|---|---|---|---|---|---|---|---|---|---|---|---|---|---|---|---|---|---|---|---|---|---|---|---|---|---|---|---|---|---|---|---|---|---|
| Author's title | |||||||||||||||||||||||||||||||||||||||||
| Author | *The author of this computation has been verified* | ||||||||||||||||||||||||||||||||||||||||
| R Software Module | rwasp_univariatedataseries.wasp | ||||||||||||||||||||||||||||||||||||||||
| Title produced by software | Univariate Data Series | ||||||||||||||||||||||||||||||||||||||||
| Date of computation | Fri, 04 Dec 2009 02:59:33 -0700 | ||||||||||||||||||||||||||||||||||||||||
| Cite this page as follows | Statistical Computations at FreeStatistics.org, Office for Research Development and Education, URL https://freestatistics.org/blog/index.php?v=date/2009/Dec/04/t1259924172d7qynjg0bbqju2u.htm/, Retrieved Sat, 27 Apr 2024 22:47:08 +0000 | ||||||||||||||||||||||||||||||||||||||||
| Statistical Computations at FreeStatistics.org, Office for Research Development and Education, URL https://freestatistics.org/blog/index.php?pk=63273, Retrieved Sat, 27 Apr 2024 22:47:08 +0000 | |||||||||||||||||||||||||||||||||||||||||
| QR Codes: | |||||||||||||||||||||||||||||||||||||||||
|
| |||||||||||||||||||||||||||||||||||||||||
| Original text written by user: | kleiner is dan de alpha-fout (5%). Dus niet te wijten aan het toeval. Hierdoor mogen we wel kijken naar lambda. Lambda is 1.24 dus valt het binnen het interval van [-2.2] als gevolg mogen we lamba gebruiken. | ||||||||||||||||||||||||||||||||||||||||
| IsPrivate? | No (this computation is public) | ||||||||||||||||||||||||||||||||||||||||
| User-defined keywords | Werkloosheid , niet-werkzoekende, in duizend tallen | ||||||||||||||||||||||||||||||||||||||||
| Estimated Impact | 106 | ||||||||||||||||||||||||||||||||||||||||
Tree of Dependent Computations | |||||||||||||||||||||||||||||||||||||||||
| Family? (F = Feedback message, R = changed R code, M = changed R Module, P = changed Parameters, D = changed Data) | |||||||||||||||||||||||||||||||||||||||||
| - [Standard Deviation-Mean Plot] [WS4 : Q1 werkloos...] [2007-12-06 13:13:51] [facee4845e9b5ee3907d580f68f35c44] - RMPD [Univariate Data Series] [Werkloosheid] [2009-12-04 09:59:33] [8cd69d0f4298074aa572ca2f9b39b6ae] [Current] | |||||||||||||||||||||||||||||||||||||||||
| Feedback Forum | |||||||||||||||||||||||||||||||||||||||||
Post a new message | |||||||||||||||||||||||||||||||||||||||||
Dataset | |||||||||||||||||||||||||||||||||||||||||
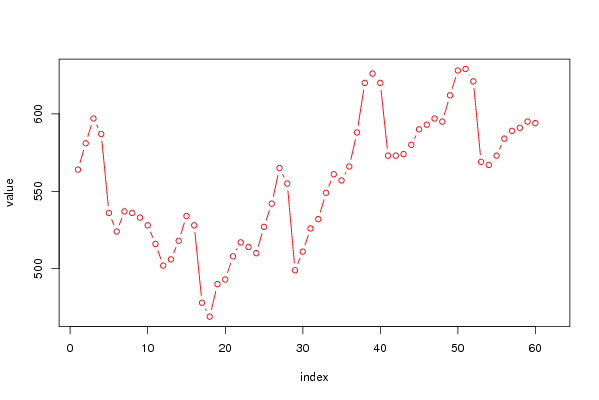
| Dataseries X: | |||||||||||||||||||||||||||||||||||||||||
564 581 597 587 536 524 537 536 533 528 516 502 506 518 534 528 478 469 490 493 508 517 514 510 527 542 565 555 499 511 526 532 549 561 557 566 588 620 626 620 573 573 574 580 590 593 597 595 612 628 629 621 569 567 573 584 589 591 595 594 NA NA | |||||||||||||||||||||||||||||||||||||||||
Tables (Output of Computation) | |||||||||||||||||||||||||||||||||||||||||
| |||||||||||||||||||||||||||||||||||||||||
Figures (Output of Computation) | |||||||||||||||||||||||||||||||||||||||||
Input Parameters & R Code | |||||||||||||||||||||||||||||||||||||||||
| Parameters (Session): | |||||||||||||||||||||||||||||||||||||||||
| par1 = Werkloosheid ; par2 = http://www.nbb.be/app/cal/N/BelgoHome.htm ; par3 = maandelijkse werkloosheid ; | |||||||||||||||||||||||||||||||||||||||||
| Parameters (R input): | |||||||||||||||||||||||||||||||||||||||||
| par1 = Werkloosheid ; par2 = http://www.nbb.be/app/cal/N/BelgoHome.htm ; par3 = maandelijkse werkloosheid ; | |||||||||||||||||||||||||||||||||||||||||
| R code (references can be found in the software module): | |||||||||||||||||||||||||||||||||||||||||
bitmap(file='test1.png') | |||||||||||||||||||||||||||||||||||||||||