Free Statistics

of Irreproducible Research!

Author's title

Author*The author of this computation has been verified*
R Software Modulerwasp_multipleregression.wasp
Title produced by softwareMultiple Regression
Date of computationFri, 04 Dec 2009 03:59:15 -0700
Cite this page as followsStatistical Computations at FreeStatistics.org, Office for Research Development and Education, URL https://freestatistics.org/blog/index.php?v=date/2009/Dec/04/t1259924447cpp12f66q707nuz.htm/, Retrieved Sun, 28 Apr 2024 05:33:58 +0000
Statistical Computations at FreeStatistics.org, Office for Research Development and Education, URL https://freestatistics.org/blog/index.php?pk=63275, Retrieved Sun, 28 Apr 2024 05:33:58 +0000
QR Codes:

Original text written by user:
IsPrivate?No (this computation is public)
User-defined keywords
Estimated Impact143
Family? (F = Feedback message, R = changed R code, M = changed R Module, P = changed Parameters, D = changed Data)
-     [Multiple Regression] [Q1 The Seatbeltlaw] [2007-11-14 19:27:43] [8cd6641b921d30ebe00b648d1481bba0]
- RMPD  [Multiple Regression] [Seatbelt] [2009-11-12 13:54:52] [b98453cac15ba1066b407e146608df68]
-    D    [Multiple Regression] [WS7] [2009-11-18 15:22:11] [cd6314e7e707a6546bd4604c9d1f2b69]
-   PD        [Multiple Regression] [Paper - multiple ...] [2009-12-04 10:59:15] [ea241b681aafed79da4b5b99fad98471] [Current]
-   P           [Multiple Regression] [Paper - multiple ...] [2009-12-04 11:01:55] [cd6314e7e707a6546bd4604c9d1f2b69]
Feedback Forum

Post a new message
Dataseries X:
216234
213587
209465
204045
200237
203666
241476
260307
243324
244460
233575
237217
235243
230354
227184
221678
217142
219452
256446
265845
248624
241114
229245
231805
219277
219313
212610
214771
211142
211457
240048
240636
230580
208795
197922
194596
194581
185686
178106
172608
167302
168053
202300
202388
182516
173476
166444
171297
169701
164182
161914
159612
151001
158114
186530
187069
174330
169362
166827
178037
186412
189226
191563
188906
186005
195309
223532
226899
214126


Summary of computational transaction
Raw Inputview raw input (R code)
Raw Outputview raw output of R engine
Computing time3 seconds
R Server'Gwilym Jenkins' @ 72.249.127.135

\begin{tabular}{lllllllll}
\hline
Summary of computational transaction \tabularnewline
Raw Input & view raw input (R code)  \tabularnewline
Raw Output & view raw output of R engine  \tabularnewline
Computing time & 3 seconds \tabularnewline
R Server & 'Gwilym Jenkins' @ 72.249.127.135 \tabularnewline
\hline
\end{tabular}
%Source: https://freestatistics.org/blog/index.php?pk=63275&T=0

[TABLE]
[ROW][C]Summary of computational transaction[/C][/ROW]
[ROW][C]Raw Input[/C][C]view raw input (R code) [/C][/ROW]
[ROW][C]Raw Output[/C][C]view raw output of R engine [/C][/ROW]
[ROW][C]Computing time[/C][C]3 seconds[/C][/ROW]
[ROW][C]R Server[/C][C]'Gwilym Jenkins' @ 72.249.127.135[/C][/ROW]
[/TABLE]
Source: https://freestatistics.org/blog/index.php?pk=63275&T=0

Globally Unique Identifier (entire table): ba.freestatistics.org/blog/index.php?pk=63275&T=0

As an alternative you can also use a QR Code:  

The GUIDs for individual cells are displayed in the table below:

Summary of computational transaction
Raw Inputview raw input (R code)
Raw Outputview raw output of R engine
Computing time3 seconds
R Server'Gwilym Jenkins' @ 72.249.127.135


Multiple Linear Regression - Estimated Regression Equation
Werkl[t] = + 202590.4 + 984.266666666718M1[t] -2199.06666666668M2[t] -5783.40000000002M3[t] -8987.06666666668M4[t] -13785.5666666667M5[t] -9915.23333333333M6[t] + 22464.9333333333M7[t] + 27933.6M8[t] + 12992.9333333333M9[t] + 4850.99999999998M10[t] -3787.80000000001M11[t] + e[t]

\begin{tabular}{lllllllll}
\hline
Multiple Linear Regression - Estimated Regression Equation \tabularnewline
Werkl[t] =  +  202590.4 +  984.266666666718M1[t] -2199.06666666668M2[t] -5783.40000000002M3[t] -8987.06666666668M4[t] -13785.5666666667M5[t] -9915.23333333333M6[t] +  22464.9333333333M7[t] +  27933.6M8[t] +  12992.9333333333M9[t] +  4850.99999999998M10[t] -3787.80000000001M11[t]  + e[t] \tabularnewline
\hline
\end{tabular}
%Source: https://freestatistics.org/blog/index.php?pk=63275&T=1

[TABLE]
[ROW][C]Multiple Linear Regression - Estimated Regression Equation[/C][/ROW]
[ROW][C]Werkl[t] =  +  202590.4 +  984.266666666718M1[t] -2199.06666666668M2[t] -5783.40000000002M3[t] -8987.06666666668M4[t] -13785.5666666667M5[t] -9915.23333333333M6[t] +  22464.9333333333M7[t] +  27933.6M8[t] +  12992.9333333333M9[t] +  4850.99999999998M10[t] -3787.80000000001M11[t]  + e[t][/C][/ROW]
[/TABLE]
Source: https://freestatistics.org/blog/index.php?pk=63275&T=1

Globally Unique Identifier (entire table): ba.freestatistics.org/blog/index.php?pk=63275&T=1

As an alternative you can also use a QR Code:  

The GUIDs for individual cells are displayed in the table below:

Multiple Linear Regression - Estimated Regression Equation
Werkl[t] = + 202590.4 + 984.266666666718M1[t] -2199.06666666668M2[t] -5783.40000000002M3[t] -8987.06666666668M4[t] -13785.5666666667M5[t] -9915.23333333333M6[t] + 22464.9333333333M7[t] + 27933.6M8[t] + 12992.9333333333M9[t] + 4850.99999999998M10[t] -3787.80000000001M11[t] + e[t]


Multiple Linear Regression - Ordinary Least Squares
VariableParameterS.D.T-STATH0: parameter = 02-tail p-value1-tail p-value
(Intercept)202590.412502.32532116.204200
M1984.26666666671816928.228510.05810.9538380.476919
M2-2199.0666666666816928.22851-0.12990.8970990.448549
M3-5783.4000000000216928.22851-0.34160.7338760.366938
M4-8987.0666666666816928.22851-0.53090.5975560.298778
M5-13785.566666666716928.22851-0.81440.4188320.209416
M6-9915.2333333333316928.22851-0.58570.5603750.280187
M722464.933333333316928.228511.32710.1897770.094889
M827933.616928.228511.65010.1044190.052209
M912992.933333333316928.228510.76750.4459340.222967
M104850.9999999999817680.9580310.27440.7847980.392399
M11-3787.8000000000117680.958031-0.21420.8311320.415566

\begin{tabular}{lllllllll}
\hline
Multiple Linear Regression - Ordinary Least Squares \tabularnewline
Variable & Parameter & S.D. & T-STATH0: parameter = 0 & 2-tail p-value & 1-tail p-value \tabularnewline
(Intercept) & 202590.4 & 12502.325321 & 16.2042 & 0 & 0 \tabularnewline
M1 & 984.266666666718 & 16928.22851 & 0.0581 & 0.953838 & 0.476919 \tabularnewline
M2 & -2199.06666666668 & 16928.22851 & -0.1299 & 0.897099 & 0.448549 \tabularnewline
M3 & -5783.40000000002 & 16928.22851 & -0.3416 & 0.733876 & 0.366938 \tabularnewline
M4 & -8987.06666666668 & 16928.22851 & -0.5309 & 0.597556 & 0.298778 \tabularnewline
M5 & -13785.5666666667 & 16928.22851 & -0.8144 & 0.418832 & 0.209416 \tabularnewline
M6 & -9915.23333333333 & 16928.22851 & -0.5857 & 0.560375 & 0.280187 \tabularnewline
M7 & 22464.9333333333 & 16928.22851 & 1.3271 & 0.189777 & 0.094889 \tabularnewline
M8 & 27933.6 & 16928.22851 & 1.6501 & 0.104419 & 0.052209 \tabularnewline
M9 & 12992.9333333333 & 16928.22851 & 0.7675 & 0.445934 & 0.222967 \tabularnewline
M10 & 4850.99999999998 & 17680.958031 & 0.2744 & 0.784798 & 0.392399 \tabularnewline
M11 & -3787.80000000001 & 17680.958031 & -0.2142 & 0.831132 & 0.415566 \tabularnewline
\hline
\end{tabular}
%Source: https://freestatistics.org/blog/index.php?pk=63275&T=2

[TABLE]
[ROW][C]Multiple Linear Regression - Ordinary Least Squares[/C][/ROW]
[ROW][C]Variable[/C][C]Parameter[/C][C]S.D.[/C][C]T-STATH0: parameter = 0[/C][C]2-tail p-value[/C][C]1-tail p-value[/C][/ROW]
[ROW][C](Intercept)[/C][C]202590.4[/C][C]12502.325321[/C][C]16.2042[/C][C]0[/C][C]0[/C][/ROW]
[ROW][C]M1[/C][C]984.266666666718[/C][C]16928.22851[/C][C]0.0581[/C][C]0.953838[/C][C]0.476919[/C][/ROW]
[ROW][C]M2[/C][C]-2199.06666666668[/C][C]16928.22851[/C][C]-0.1299[/C][C]0.897099[/C][C]0.448549[/C][/ROW]
[ROW][C]M3[/C][C]-5783.40000000002[/C][C]16928.22851[/C][C]-0.3416[/C][C]0.733876[/C][C]0.366938[/C][/ROW]
[ROW][C]M4[/C][C]-8987.06666666668[/C][C]16928.22851[/C][C]-0.5309[/C][C]0.597556[/C][C]0.298778[/C][/ROW]
[ROW][C]M5[/C][C]-13785.5666666667[/C][C]16928.22851[/C][C]-0.8144[/C][C]0.418832[/C][C]0.209416[/C][/ROW]
[ROW][C]M6[/C][C]-9915.23333333333[/C][C]16928.22851[/C][C]-0.5857[/C][C]0.560375[/C][C]0.280187[/C][/ROW]
[ROW][C]M7[/C][C]22464.9333333333[/C][C]16928.22851[/C][C]1.3271[/C][C]0.189777[/C][C]0.094889[/C][/ROW]
[ROW][C]M8[/C][C]27933.6[/C][C]16928.22851[/C][C]1.6501[/C][C]0.104419[/C][C]0.052209[/C][/ROW]
[ROW][C]M9[/C][C]12992.9333333333[/C][C]16928.22851[/C][C]0.7675[/C][C]0.445934[/C][C]0.222967[/C][/ROW]
[ROW][C]M10[/C][C]4850.99999999998[/C][C]17680.958031[/C][C]0.2744[/C][C]0.784798[/C][C]0.392399[/C][/ROW]
[ROW][C]M11[/C][C]-3787.80000000001[/C][C]17680.958031[/C][C]-0.2142[/C][C]0.831132[/C][C]0.415566[/C][/ROW]
[/TABLE]
Source: https://freestatistics.org/blog/index.php?pk=63275&T=2

Globally Unique Identifier (entire table): ba.freestatistics.org/blog/index.php?pk=63275&T=2

As an alternative you can also use a QR Code:  

The GUIDs for individual cells are displayed in the table below:

Multiple Linear Regression - Ordinary Least Squares
VariableParameterS.D.T-STATH0: parameter = 02-tail p-value1-tail p-value
(Intercept)202590.412502.32532116.204200
M1984.26666666671816928.228510.05810.9538380.476919
M2-2199.0666666666816928.22851-0.12990.8970990.448549
M3-5783.4000000000216928.22851-0.34160.7338760.366938
M4-8987.0666666666816928.22851-0.53090.5975560.298778
M5-13785.566666666716928.22851-0.81440.4188320.209416
M6-9915.2333333333316928.22851-0.58570.5603750.280187
M722464.933333333316928.228511.32710.1897770.094889
M827933.616928.228511.65010.1044190.052209
M912992.933333333316928.228510.76750.4459340.222967
M104850.9999999999817680.9580310.27440.7847980.392399
M11-3787.8000000000117680.958031-0.21420.8311320.415566


Multiple Linear Regression - Regression Statistics
Multiple R0.445760423272586
R-squared0.198702354956155
Adjusted R-squared0.0440659673161151
F-TEST (value)1.28496505892708
F-TEST (DF numerator)11
F-TEST (DF denominator)57
p-value0.256654159789030
Multiple Linear Regression - Residual Statistics
Residual Standard Deviation27956.0492954451
Sum Squared Residuals44547819455.9333

\begin{tabular}{lllllllll}
\hline
Multiple Linear Regression - Regression Statistics \tabularnewline
Multiple R & 0.445760423272586 \tabularnewline
R-squared & 0.198702354956155 \tabularnewline
Adjusted R-squared & 0.0440659673161151 \tabularnewline
F-TEST (value) & 1.28496505892708 \tabularnewline
F-TEST (DF numerator) & 11 \tabularnewline
F-TEST (DF denominator) & 57 \tabularnewline
p-value & 0.256654159789030 \tabularnewline
Multiple Linear Regression - Residual Statistics \tabularnewline
Residual Standard Deviation & 27956.0492954451 \tabularnewline
Sum Squared Residuals & 44547819455.9333 \tabularnewline
\hline
\end{tabular}
%Source: https://freestatistics.org/blog/index.php?pk=63275&T=3

[TABLE]
[ROW][C]Multiple Linear Regression - Regression Statistics[/C][/ROW]
[ROW][C]Multiple R[/C][C]0.445760423272586[/C][/ROW]
[ROW][C]R-squared[/C][C]0.198702354956155[/C][/ROW]
[ROW][C]Adjusted R-squared[/C][C]0.0440659673161151[/C][/ROW]
[ROW][C]F-TEST (value)[/C][C]1.28496505892708[/C][/ROW]
[ROW][C]F-TEST (DF numerator)[/C][C]11[/C][/ROW]
[ROW][C]F-TEST (DF denominator)[/C][C]57[/C][/ROW]
[ROW][C]p-value[/C][C]0.256654159789030[/C][/ROW]
[ROW][C]Multiple Linear Regression - Residual Statistics[/C][/ROW]
[ROW][C]Residual Standard Deviation[/C][C]27956.0492954451[/C][/ROW]
[ROW][C]Sum Squared Residuals[/C][C]44547819455.9333[/C][/ROW]
[/TABLE]
Source: https://freestatistics.org/blog/index.php?pk=63275&T=3

Globally Unique Identifier (entire table): ba.freestatistics.org/blog/index.php?pk=63275&T=3

As an alternative you can also use a QR Code:  

The GUIDs for individual cells are displayed in the table below:

Multiple Linear Regression - Regression Statistics
Multiple R0.445760423272586
R-squared0.198702354956155
Adjusted R-squared0.0440659673161151
F-TEST (value)1.28496505892708
F-TEST (DF numerator)11
F-TEST (DF denominator)57
p-value0.256654159789030
Multiple Linear Regression - Residual Statistics
Residual Standard Deviation27956.0492954451
Sum Squared Residuals44547819455.9333


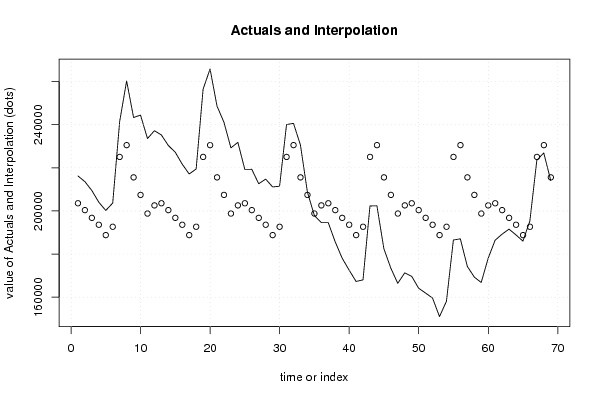
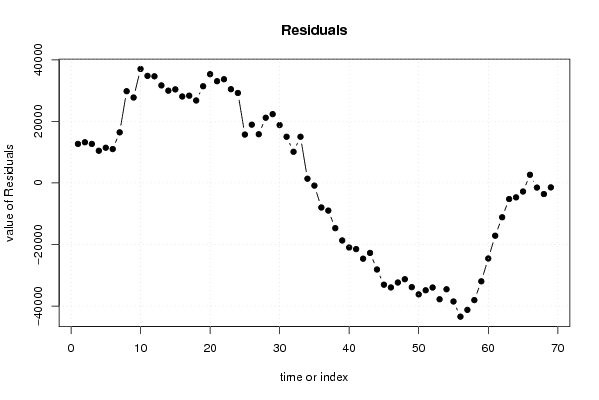
Multiple Linear Regression - Actuals, Interpolation, and Residuals
Time or IndexActualsInterpolationForecastResidualsPrediction Error
1216234203574.66666666612659.3333333337
2213587200391.33333333313195.6666666667
320946519680712658
4204045193603.33333333310441.6666666667
5200237188804.83333333311432.1666666667
6203666192675.16666666710990.8333333333
7241476225055.33333333316420.6666666666
826030723052429783.0000000001
9243324215583.33333333327740.6666666667
10244460207441.437018.6
11233575198802.634772.4
12237217202590.434626.6
13235243203574.66666666731668.3333333333
14230354200391.33333333329962.6666666667
1522718419680730377
16221678193603.33333333328074.6666666667
17217142188804.83333333328337.1666666667
18219452192675.16666666726776.8333333333
19256446225055.33333333331390.6666666667
2026584523052435321
21248624215583.33333333333040.6666666667
22241114207441.433672.6
23229245198802.630442.4
24231805202590.429214.6
25219277203574.66666666715702.3333333333
26219313200391.33333333318921.6666666667
2721261019680715803
28214771193603.33333333321167.6666666667
29211142188804.83333333322337.1666666667
30211457192675.16666666718781.8333333333
31240048225055.33333333314992.6666666667
3224063623052410112
33230580215583.33333333314996.6666666667
34208795207441.41353.60000000001
35197922198802.6-880.600000000004
36194596202590.4-7994.4
37194581203574.666666667-8993.66666666673
38185686200391.333333333-14705.3333333333
39178106196807-18701
40172608193603.333333333-20995.3333333333
41167302188804.833333333-21502.8333333333
42168053192675.166666667-24622.1666666667
43202300225055.333333333-22755.3333333333
44202388230524-28136
45182516215583.333333333-33067.3333333333
46173476207441.4-33965.4
47166444198802.6-32358.6
48171297202590.4-31293.4
49169701203574.666666667-33873.6666666667
50164182200391.333333333-36209.3333333333
51161914196807-34893
52159612193603.333333333-33991.3333333333
53151001188804.833333333-37803.8333333333
54158114192675.166666667-34561.1666666666
55186530225055.333333333-38525.3333333333
56187069230524-43455
57174330215583.333333333-41253.3333333333
58169362207441.4-38079.4
59166827198802.6-31975.6
60178037202590.4-24553.4
61186412203574.666666667-17162.6666666667
62189226200391.333333333-11165.3333333333
63191563196807-5244
64188906193603.333333333-4697.33333333334
65186005188804.833333333-2799.83333333334
66195309192675.1666666672633.83333333335
67223532225055.333333333-1523.33333333332
68226899230524-3625.00000000000
69214126215583.333333333-1457.33333333332

\begin{tabular}{lllllllll}
\hline
Multiple Linear Regression - Actuals, Interpolation, and Residuals \tabularnewline
Time or Index & Actuals & InterpolationForecast & ResidualsPrediction Error \tabularnewline
1 & 216234 & 203574.666666666 & 12659.3333333337 \tabularnewline
2 & 213587 & 200391.333333333 & 13195.6666666667 \tabularnewline
3 & 209465 & 196807 & 12658 \tabularnewline
4 & 204045 & 193603.333333333 & 10441.6666666667 \tabularnewline
5 & 200237 & 188804.833333333 & 11432.1666666667 \tabularnewline
6 & 203666 & 192675.166666667 & 10990.8333333333 \tabularnewline
7 & 241476 & 225055.333333333 & 16420.6666666666 \tabularnewline
8 & 260307 & 230524 & 29783.0000000001 \tabularnewline
9 & 243324 & 215583.333333333 & 27740.6666666667 \tabularnewline
10 & 244460 & 207441.4 & 37018.6 \tabularnewline
11 & 233575 & 198802.6 & 34772.4 \tabularnewline
12 & 237217 & 202590.4 & 34626.6 \tabularnewline
13 & 235243 & 203574.666666667 & 31668.3333333333 \tabularnewline
14 & 230354 & 200391.333333333 & 29962.6666666667 \tabularnewline
15 & 227184 & 196807 & 30377 \tabularnewline
16 & 221678 & 193603.333333333 & 28074.6666666667 \tabularnewline
17 & 217142 & 188804.833333333 & 28337.1666666667 \tabularnewline
18 & 219452 & 192675.166666667 & 26776.8333333333 \tabularnewline
19 & 256446 & 225055.333333333 & 31390.6666666667 \tabularnewline
20 & 265845 & 230524 & 35321 \tabularnewline
21 & 248624 & 215583.333333333 & 33040.6666666667 \tabularnewline
22 & 241114 & 207441.4 & 33672.6 \tabularnewline
23 & 229245 & 198802.6 & 30442.4 \tabularnewline
24 & 231805 & 202590.4 & 29214.6 \tabularnewline
25 & 219277 & 203574.666666667 & 15702.3333333333 \tabularnewline
26 & 219313 & 200391.333333333 & 18921.6666666667 \tabularnewline
27 & 212610 & 196807 & 15803 \tabularnewline
28 & 214771 & 193603.333333333 & 21167.6666666667 \tabularnewline
29 & 211142 & 188804.833333333 & 22337.1666666667 \tabularnewline
30 & 211457 & 192675.166666667 & 18781.8333333333 \tabularnewline
31 & 240048 & 225055.333333333 & 14992.6666666667 \tabularnewline
32 & 240636 & 230524 & 10112 \tabularnewline
33 & 230580 & 215583.333333333 & 14996.6666666667 \tabularnewline
34 & 208795 & 207441.4 & 1353.60000000001 \tabularnewline
35 & 197922 & 198802.6 & -880.600000000004 \tabularnewline
36 & 194596 & 202590.4 & -7994.4 \tabularnewline
37 & 194581 & 203574.666666667 & -8993.66666666673 \tabularnewline
38 & 185686 & 200391.333333333 & -14705.3333333333 \tabularnewline
39 & 178106 & 196807 & -18701 \tabularnewline
40 & 172608 & 193603.333333333 & -20995.3333333333 \tabularnewline
41 & 167302 & 188804.833333333 & -21502.8333333333 \tabularnewline
42 & 168053 & 192675.166666667 & -24622.1666666667 \tabularnewline
43 & 202300 & 225055.333333333 & -22755.3333333333 \tabularnewline
44 & 202388 & 230524 & -28136 \tabularnewline
45 & 182516 & 215583.333333333 & -33067.3333333333 \tabularnewline
46 & 173476 & 207441.4 & -33965.4 \tabularnewline
47 & 166444 & 198802.6 & -32358.6 \tabularnewline
48 & 171297 & 202590.4 & -31293.4 \tabularnewline
49 & 169701 & 203574.666666667 & -33873.6666666667 \tabularnewline
50 & 164182 & 200391.333333333 & -36209.3333333333 \tabularnewline
51 & 161914 & 196807 & -34893 \tabularnewline
52 & 159612 & 193603.333333333 & -33991.3333333333 \tabularnewline
53 & 151001 & 188804.833333333 & -37803.8333333333 \tabularnewline
54 & 158114 & 192675.166666667 & -34561.1666666666 \tabularnewline
55 & 186530 & 225055.333333333 & -38525.3333333333 \tabularnewline
56 & 187069 & 230524 & -43455 \tabularnewline
57 & 174330 & 215583.333333333 & -41253.3333333333 \tabularnewline
58 & 169362 & 207441.4 & -38079.4 \tabularnewline
59 & 166827 & 198802.6 & -31975.6 \tabularnewline
60 & 178037 & 202590.4 & -24553.4 \tabularnewline
61 & 186412 & 203574.666666667 & -17162.6666666667 \tabularnewline
62 & 189226 & 200391.333333333 & -11165.3333333333 \tabularnewline
63 & 191563 & 196807 & -5244 \tabularnewline
64 & 188906 & 193603.333333333 & -4697.33333333334 \tabularnewline
65 & 186005 & 188804.833333333 & -2799.83333333334 \tabularnewline
66 & 195309 & 192675.166666667 & 2633.83333333335 \tabularnewline
67 & 223532 & 225055.333333333 & -1523.33333333332 \tabularnewline
68 & 226899 & 230524 & -3625.00000000000 \tabularnewline
69 & 214126 & 215583.333333333 & -1457.33333333332 \tabularnewline
\hline
\end{tabular}
%Source: https://freestatistics.org/blog/index.php?pk=63275&T=4

[TABLE]
[ROW][C]Multiple Linear Regression - Actuals, Interpolation, and Residuals[/C][/ROW]
[ROW][C]Time or Index[/C][C]Actuals[/C][C]InterpolationForecast[/C][C]ResidualsPrediction Error[/C][/ROW]
[ROW][C]1[/C][C]216234[/C][C]203574.666666666[/C][C]12659.3333333337[/C][/ROW]
[ROW][C]2[/C][C]213587[/C][C]200391.333333333[/C][C]13195.6666666667[/C][/ROW]
[ROW][C]3[/C][C]209465[/C][C]196807[/C][C]12658[/C][/ROW]
[ROW][C]4[/C][C]204045[/C][C]193603.333333333[/C][C]10441.6666666667[/C][/ROW]
[ROW][C]5[/C][C]200237[/C][C]188804.833333333[/C][C]11432.1666666667[/C][/ROW]
[ROW][C]6[/C][C]203666[/C][C]192675.166666667[/C][C]10990.8333333333[/C][/ROW]
[ROW][C]7[/C][C]241476[/C][C]225055.333333333[/C][C]16420.6666666666[/C][/ROW]
[ROW][C]8[/C][C]260307[/C][C]230524[/C][C]29783.0000000001[/C][/ROW]
[ROW][C]9[/C][C]243324[/C][C]215583.333333333[/C][C]27740.6666666667[/C][/ROW]
[ROW][C]10[/C][C]244460[/C][C]207441.4[/C][C]37018.6[/C][/ROW]
[ROW][C]11[/C][C]233575[/C][C]198802.6[/C][C]34772.4[/C][/ROW]
[ROW][C]12[/C][C]237217[/C][C]202590.4[/C][C]34626.6[/C][/ROW]
[ROW][C]13[/C][C]235243[/C][C]203574.666666667[/C][C]31668.3333333333[/C][/ROW]
[ROW][C]14[/C][C]230354[/C][C]200391.333333333[/C][C]29962.6666666667[/C][/ROW]
[ROW][C]15[/C][C]227184[/C][C]196807[/C][C]30377[/C][/ROW]
[ROW][C]16[/C][C]221678[/C][C]193603.333333333[/C][C]28074.6666666667[/C][/ROW]
[ROW][C]17[/C][C]217142[/C][C]188804.833333333[/C][C]28337.1666666667[/C][/ROW]
[ROW][C]18[/C][C]219452[/C][C]192675.166666667[/C][C]26776.8333333333[/C][/ROW]
[ROW][C]19[/C][C]256446[/C][C]225055.333333333[/C][C]31390.6666666667[/C][/ROW]
[ROW][C]20[/C][C]265845[/C][C]230524[/C][C]35321[/C][/ROW]
[ROW][C]21[/C][C]248624[/C][C]215583.333333333[/C][C]33040.6666666667[/C][/ROW]
[ROW][C]22[/C][C]241114[/C][C]207441.4[/C][C]33672.6[/C][/ROW]
[ROW][C]23[/C][C]229245[/C][C]198802.6[/C][C]30442.4[/C][/ROW]
[ROW][C]24[/C][C]231805[/C][C]202590.4[/C][C]29214.6[/C][/ROW]
[ROW][C]25[/C][C]219277[/C][C]203574.666666667[/C][C]15702.3333333333[/C][/ROW]
[ROW][C]26[/C][C]219313[/C][C]200391.333333333[/C][C]18921.6666666667[/C][/ROW]
[ROW][C]27[/C][C]212610[/C][C]196807[/C][C]15803[/C][/ROW]
[ROW][C]28[/C][C]214771[/C][C]193603.333333333[/C][C]21167.6666666667[/C][/ROW]
[ROW][C]29[/C][C]211142[/C][C]188804.833333333[/C][C]22337.1666666667[/C][/ROW]
[ROW][C]30[/C][C]211457[/C][C]192675.166666667[/C][C]18781.8333333333[/C][/ROW]
[ROW][C]31[/C][C]240048[/C][C]225055.333333333[/C][C]14992.6666666667[/C][/ROW]
[ROW][C]32[/C][C]240636[/C][C]230524[/C][C]10112[/C][/ROW]
[ROW][C]33[/C][C]230580[/C][C]215583.333333333[/C][C]14996.6666666667[/C][/ROW]
[ROW][C]34[/C][C]208795[/C][C]207441.4[/C][C]1353.60000000001[/C][/ROW]
[ROW][C]35[/C][C]197922[/C][C]198802.6[/C][C]-880.600000000004[/C][/ROW]
[ROW][C]36[/C][C]194596[/C][C]202590.4[/C][C]-7994.4[/C][/ROW]
[ROW][C]37[/C][C]194581[/C][C]203574.666666667[/C][C]-8993.66666666673[/C][/ROW]
[ROW][C]38[/C][C]185686[/C][C]200391.333333333[/C][C]-14705.3333333333[/C][/ROW]
[ROW][C]39[/C][C]178106[/C][C]196807[/C][C]-18701[/C][/ROW]
[ROW][C]40[/C][C]172608[/C][C]193603.333333333[/C][C]-20995.3333333333[/C][/ROW]
[ROW][C]41[/C][C]167302[/C][C]188804.833333333[/C][C]-21502.8333333333[/C][/ROW]
[ROW][C]42[/C][C]168053[/C][C]192675.166666667[/C][C]-24622.1666666667[/C][/ROW]
[ROW][C]43[/C][C]202300[/C][C]225055.333333333[/C][C]-22755.3333333333[/C][/ROW]
[ROW][C]44[/C][C]202388[/C][C]230524[/C][C]-28136[/C][/ROW]
[ROW][C]45[/C][C]182516[/C][C]215583.333333333[/C][C]-33067.3333333333[/C][/ROW]
[ROW][C]46[/C][C]173476[/C][C]207441.4[/C][C]-33965.4[/C][/ROW]
[ROW][C]47[/C][C]166444[/C][C]198802.6[/C][C]-32358.6[/C][/ROW]
[ROW][C]48[/C][C]171297[/C][C]202590.4[/C][C]-31293.4[/C][/ROW]
[ROW][C]49[/C][C]169701[/C][C]203574.666666667[/C][C]-33873.6666666667[/C][/ROW]
[ROW][C]50[/C][C]164182[/C][C]200391.333333333[/C][C]-36209.3333333333[/C][/ROW]
[ROW][C]51[/C][C]161914[/C][C]196807[/C][C]-34893[/C][/ROW]
[ROW][C]52[/C][C]159612[/C][C]193603.333333333[/C][C]-33991.3333333333[/C][/ROW]
[ROW][C]53[/C][C]151001[/C][C]188804.833333333[/C][C]-37803.8333333333[/C][/ROW]
[ROW][C]54[/C][C]158114[/C][C]192675.166666667[/C][C]-34561.1666666666[/C][/ROW]
[ROW][C]55[/C][C]186530[/C][C]225055.333333333[/C][C]-38525.3333333333[/C][/ROW]
[ROW][C]56[/C][C]187069[/C][C]230524[/C][C]-43455[/C][/ROW]
[ROW][C]57[/C][C]174330[/C][C]215583.333333333[/C][C]-41253.3333333333[/C][/ROW]
[ROW][C]58[/C][C]169362[/C][C]207441.4[/C][C]-38079.4[/C][/ROW]
[ROW][C]59[/C][C]166827[/C][C]198802.6[/C][C]-31975.6[/C][/ROW]
[ROW][C]60[/C][C]178037[/C][C]202590.4[/C][C]-24553.4[/C][/ROW]
[ROW][C]61[/C][C]186412[/C][C]203574.666666667[/C][C]-17162.6666666667[/C][/ROW]
[ROW][C]62[/C][C]189226[/C][C]200391.333333333[/C][C]-11165.3333333333[/C][/ROW]
[ROW][C]63[/C][C]191563[/C][C]196807[/C][C]-5244[/C][/ROW]
[ROW][C]64[/C][C]188906[/C][C]193603.333333333[/C][C]-4697.33333333334[/C][/ROW]
[ROW][C]65[/C][C]186005[/C][C]188804.833333333[/C][C]-2799.83333333334[/C][/ROW]
[ROW][C]66[/C][C]195309[/C][C]192675.166666667[/C][C]2633.83333333335[/C][/ROW]
[ROW][C]67[/C][C]223532[/C][C]225055.333333333[/C][C]-1523.33333333332[/C][/ROW]
[ROW][C]68[/C][C]226899[/C][C]230524[/C][C]-3625.00000000000[/C][/ROW]
[ROW][C]69[/C][C]214126[/C][C]215583.333333333[/C][C]-1457.33333333332[/C][/ROW]
[/TABLE]
Source: https://freestatistics.org/blog/index.php?pk=63275&T=4

Globally Unique Identifier (entire table): ba.freestatistics.org/blog/index.php?pk=63275&T=4

As an alternative you can also use a QR Code:  

The GUIDs for individual cells are displayed in the table below:

Multiple Linear Regression - Actuals, Interpolation, and Residuals
Time or IndexActualsInterpolationForecastResidualsPrediction Error
1216234203574.66666666612659.3333333337
2213587200391.33333333313195.6666666667
320946519680712658
4204045193603.33333333310441.6666666667
5200237188804.83333333311432.1666666667
6203666192675.16666666710990.8333333333
7241476225055.33333333316420.6666666666
826030723052429783.0000000001
9243324215583.33333333327740.6666666667
10244460207441.437018.6
11233575198802.634772.4
12237217202590.434626.6
13235243203574.66666666731668.3333333333
14230354200391.33333333329962.6666666667
1522718419680730377
16221678193603.33333333328074.6666666667
17217142188804.83333333328337.1666666667
18219452192675.16666666726776.8333333333
19256446225055.33333333331390.6666666667
2026584523052435321
21248624215583.33333333333040.6666666667
22241114207441.433672.6
23229245198802.630442.4
24231805202590.429214.6
25219277203574.66666666715702.3333333333
26219313200391.33333333318921.6666666667
2721261019680715803
28214771193603.33333333321167.6666666667
29211142188804.83333333322337.1666666667
30211457192675.16666666718781.8333333333
31240048225055.33333333314992.6666666667
3224063623052410112
33230580215583.33333333314996.6666666667
34208795207441.41353.60000000001
35197922198802.6-880.600000000004
36194596202590.4-7994.4
37194581203574.666666667-8993.66666666673
38185686200391.333333333-14705.3333333333
39178106196807-18701
40172608193603.333333333-20995.3333333333
41167302188804.833333333-21502.8333333333
42168053192675.166666667-24622.1666666667
43202300225055.333333333-22755.3333333333
44202388230524-28136
45182516215583.333333333-33067.3333333333
46173476207441.4-33965.4
47166444198802.6-32358.6
48171297202590.4-31293.4
49169701203574.666666667-33873.6666666667
50164182200391.333333333-36209.3333333333
51161914196807-34893
52159612193603.333333333-33991.3333333333
53151001188804.833333333-37803.8333333333
54158114192675.166666667-34561.1666666666
55186530225055.333333333-38525.3333333333
56187069230524-43455
57174330215583.333333333-41253.3333333333
58169362207441.4-38079.4
59166827198802.6-31975.6
60178037202590.4-24553.4
61186412203574.666666667-17162.6666666667
62189226200391.333333333-11165.3333333333
63191563196807-5244
64188906193603.333333333-4697.33333333334
65186005188804.833333333-2799.83333333334
66195309192675.1666666672633.83333333335
67223532225055.333333333-1523.33333333332
68226899230524-3625.00000000000
69214126215583.333333333-1457.33333333332


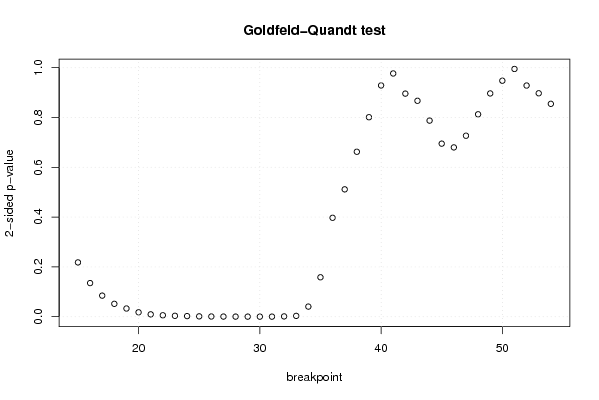
Goldfeld-Quandt test for Heteroskedasticity
p-valuesAlternative Hypothesis
breakpoint indexgreater2-sidedless
150.1090192616273830.2180385232547660.890980738372617
160.06755515236011920.1351103047202380.93244484763988
170.04231565322453870.08463130644907730.957684346775461
180.02587754376388760.05175508752777520.974122456236112
190.01648391161541300.03296782323082610.983516088384587
200.008850843315983560.01770168663196710.991149156684016
210.004745676885386910.009491353770773820.995254323114613
220.002890381807240940.005780763614481890.99710961819276
230.001799381587824290.003598763175648580.998200618412176
240.001219541240033220.002439082480066440.998780458759967
250.0007163081599367080.001432616319873420.999283691840063
260.0004228452860780600.0008456905721561190.999577154713922
270.0002620367991888520.0005240735983777040.999737963200811
280.0001802463271343370.0003604926542686750.999819753672866
290.0001490247348916830.0002980494697833660.999850975265108
300.0001117728352622970.0002235456705245950.999888227164738
310.0001214859690352390.0002429719380704780.999878514030965
320.0006275651182457350.001255130236491470.999372434881754
330.001657749914145390.003315499828290790.998342250085855
340.02030141035103980.04060282070207970.97969858964896
350.07914676892005170.1582935378401030.920853231079948
360.1986362084710090.3972724169420170.801363791528992
370.2557347325088730.5114694650177470.744265267491127
380.3311772735414670.6623545470829340.668822726458533
390.4005720303436420.8011440606872840.599427969656358
400.4643599641076480.9287199282152970.535640035892352
410.5115953618453670.9768092763092660.488404638154633
420.5520540695130390.8958918609739230.447945930486961
430.5664493559706860.8671012880586280.433550644029314
440.6062470146163370.7875059707673270.393752985383663
450.6525117157925750.6949765684148510.347488284207425
460.6600261007569050.679947798486190.339973899243095
470.6366220529580070.7267558940839870.363377947041993
480.5935927608499250.812814478300150.406407239150075
490.5516872784019170.8966254431961660.448312721598083
500.5261646659948160.9476706680103680.473835334005184
510.5025203899848240.9949592200303520.497479610015176
520.4641636878565520.9283273757131040.535836312143448
530.4486218161584230.8972436323168470.551378183841577
540.4274801956791600.8549603913583190.57251980432084

\begin{tabular}{lllllllll}
\hline
Goldfeld-Quandt test for Heteroskedasticity \tabularnewline
p-values & Alternative Hypothesis \tabularnewline
breakpoint index & greater & 2-sided & less \tabularnewline
15 & 0.109019261627383 & 0.218038523254766 & 0.890980738372617 \tabularnewline
16 & 0.0675551523601192 & 0.135110304720238 & 0.93244484763988 \tabularnewline
17 & 0.0423156532245387 & 0.0846313064490773 & 0.957684346775461 \tabularnewline
18 & 0.0258775437638876 & 0.0517550875277752 & 0.974122456236112 \tabularnewline
19 & 0.0164839116154130 & 0.0329678232308261 & 0.983516088384587 \tabularnewline
20 & 0.00885084331598356 & 0.0177016866319671 & 0.991149156684016 \tabularnewline
21 & 0.00474567688538691 & 0.00949135377077382 & 0.995254323114613 \tabularnewline
22 & 0.00289038180724094 & 0.00578076361448189 & 0.99710961819276 \tabularnewline
23 & 0.00179938158782429 & 0.00359876317564858 & 0.998200618412176 \tabularnewline
24 & 0.00121954124003322 & 0.00243908248006644 & 0.998780458759967 \tabularnewline
25 & 0.000716308159936708 & 0.00143261631987342 & 0.999283691840063 \tabularnewline
26 & 0.000422845286078060 & 0.000845690572156119 & 0.999577154713922 \tabularnewline
27 & 0.000262036799188852 & 0.000524073598377704 & 0.999737963200811 \tabularnewline
28 & 0.000180246327134337 & 0.000360492654268675 & 0.999819753672866 \tabularnewline
29 & 0.000149024734891683 & 0.000298049469783366 & 0.999850975265108 \tabularnewline
30 & 0.000111772835262297 & 0.000223545670524595 & 0.999888227164738 \tabularnewline
31 & 0.000121485969035239 & 0.000242971938070478 & 0.999878514030965 \tabularnewline
32 & 0.000627565118245735 & 0.00125513023649147 & 0.999372434881754 \tabularnewline
33 & 0.00165774991414539 & 0.00331549982829079 & 0.998342250085855 \tabularnewline
34 & 0.0203014103510398 & 0.0406028207020797 & 0.97969858964896 \tabularnewline
35 & 0.0791467689200517 & 0.158293537840103 & 0.920853231079948 \tabularnewline
36 & 0.198636208471009 & 0.397272416942017 & 0.801363791528992 \tabularnewline
37 & 0.255734732508873 & 0.511469465017747 & 0.744265267491127 \tabularnewline
38 & 0.331177273541467 & 0.662354547082934 & 0.668822726458533 \tabularnewline
39 & 0.400572030343642 & 0.801144060687284 & 0.599427969656358 \tabularnewline
40 & 0.464359964107648 & 0.928719928215297 & 0.535640035892352 \tabularnewline
41 & 0.511595361845367 & 0.976809276309266 & 0.488404638154633 \tabularnewline
42 & 0.552054069513039 & 0.895891860973923 & 0.447945930486961 \tabularnewline
43 & 0.566449355970686 & 0.867101288058628 & 0.433550644029314 \tabularnewline
44 & 0.606247014616337 & 0.787505970767327 & 0.393752985383663 \tabularnewline
45 & 0.652511715792575 & 0.694976568414851 & 0.347488284207425 \tabularnewline
46 & 0.660026100756905 & 0.67994779848619 & 0.339973899243095 \tabularnewline
47 & 0.636622052958007 & 0.726755894083987 & 0.363377947041993 \tabularnewline
48 & 0.593592760849925 & 0.81281447830015 & 0.406407239150075 \tabularnewline
49 & 0.551687278401917 & 0.896625443196166 & 0.448312721598083 \tabularnewline
50 & 0.526164665994816 & 0.947670668010368 & 0.473835334005184 \tabularnewline
51 & 0.502520389984824 & 0.994959220030352 & 0.497479610015176 \tabularnewline
52 & 0.464163687856552 & 0.928327375713104 & 0.535836312143448 \tabularnewline
53 & 0.448621816158423 & 0.897243632316847 & 0.551378183841577 \tabularnewline
54 & 0.427480195679160 & 0.854960391358319 & 0.57251980432084 \tabularnewline
\hline
\end{tabular}
%Source: https://freestatistics.org/blog/index.php?pk=63275&T=5

[TABLE]
[ROW][C]Goldfeld-Quandt test for Heteroskedasticity[/C][/ROW]
[ROW][C]p-values[/C][C]Alternative Hypothesis[/C][/ROW]
[ROW][C]breakpoint index[/C][C]greater[/C][C]2-sided[/C][C]less[/C][/ROW]
[ROW][C]15[/C][C]0.109019261627383[/C][C]0.218038523254766[/C][C]0.890980738372617[/C][/ROW]
[ROW][C]16[/C][C]0.0675551523601192[/C][C]0.135110304720238[/C][C]0.93244484763988[/C][/ROW]
[ROW][C]17[/C][C]0.0423156532245387[/C][C]0.0846313064490773[/C][C]0.957684346775461[/C][/ROW]
[ROW][C]18[/C][C]0.0258775437638876[/C][C]0.0517550875277752[/C][C]0.974122456236112[/C][/ROW]
[ROW][C]19[/C][C]0.0164839116154130[/C][C]0.0329678232308261[/C][C]0.983516088384587[/C][/ROW]
[ROW][C]20[/C][C]0.00885084331598356[/C][C]0.0177016866319671[/C][C]0.991149156684016[/C][/ROW]
[ROW][C]21[/C][C]0.00474567688538691[/C][C]0.00949135377077382[/C][C]0.995254323114613[/C][/ROW]
[ROW][C]22[/C][C]0.00289038180724094[/C][C]0.00578076361448189[/C][C]0.99710961819276[/C][/ROW]
[ROW][C]23[/C][C]0.00179938158782429[/C][C]0.00359876317564858[/C][C]0.998200618412176[/C][/ROW]
[ROW][C]24[/C][C]0.00121954124003322[/C][C]0.00243908248006644[/C][C]0.998780458759967[/C][/ROW]
[ROW][C]25[/C][C]0.000716308159936708[/C][C]0.00143261631987342[/C][C]0.999283691840063[/C][/ROW]
[ROW][C]26[/C][C]0.000422845286078060[/C][C]0.000845690572156119[/C][C]0.999577154713922[/C][/ROW]
[ROW][C]27[/C][C]0.000262036799188852[/C][C]0.000524073598377704[/C][C]0.999737963200811[/C][/ROW]
[ROW][C]28[/C][C]0.000180246327134337[/C][C]0.000360492654268675[/C][C]0.999819753672866[/C][/ROW]
[ROW][C]29[/C][C]0.000149024734891683[/C][C]0.000298049469783366[/C][C]0.999850975265108[/C][/ROW]
[ROW][C]30[/C][C]0.000111772835262297[/C][C]0.000223545670524595[/C][C]0.999888227164738[/C][/ROW]
[ROW][C]31[/C][C]0.000121485969035239[/C][C]0.000242971938070478[/C][C]0.999878514030965[/C][/ROW]
[ROW][C]32[/C][C]0.000627565118245735[/C][C]0.00125513023649147[/C][C]0.999372434881754[/C][/ROW]
[ROW][C]33[/C][C]0.00165774991414539[/C][C]0.00331549982829079[/C][C]0.998342250085855[/C][/ROW]
[ROW][C]34[/C][C]0.0203014103510398[/C][C]0.0406028207020797[/C][C]0.97969858964896[/C][/ROW]
[ROW][C]35[/C][C]0.0791467689200517[/C][C]0.158293537840103[/C][C]0.920853231079948[/C][/ROW]
[ROW][C]36[/C][C]0.198636208471009[/C][C]0.397272416942017[/C][C]0.801363791528992[/C][/ROW]
[ROW][C]37[/C][C]0.255734732508873[/C][C]0.511469465017747[/C][C]0.744265267491127[/C][/ROW]
[ROW][C]38[/C][C]0.331177273541467[/C][C]0.662354547082934[/C][C]0.668822726458533[/C][/ROW]
[ROW][C]39[/C][C]0.400572030343642[/C][C]0.801144060687284[/C][C]0.599427969656358[/C][/ROW]
[ROW][C]40[/C][C]0.464359964107648[/C][C]0.928719928215297[/C][C]0.535640035892352[/C][/ROW]
[ROW][C]41[/C][C]0.511595361845367[/C][C]0.976809276309266[/C][C]0.488404638154633[/C][/ROW]
[ROW][C]42[/C][C]0.552054069513039[/C][C]0.895891860973923[/C][C]0.447945930486961[/C][/ROW]
[ROW][C]43[/C][C]0.566449355970686[/C][C]0.867101288058628[/C][C]0.433550644029314[/C][/ROW]
[ROW][C]44[/C][C]0.606247014616337[/C][C]0.787505970767327[/C][C]0.393752985383663[/C][/ROW]
[ROW][C]45[/C][C]0.652511715792575[/C][C]0.694976568414851[/C][C]0.347488284207425[/C][/ROW]
[ROW][C]46[/C][C]0.660026100756905[/C][C]0.67994779848619[/C][C]0.339973899243095[/C][/ROW]
[ROW][C]47[/C][C]0.636622052958007[/C][C]0.726755894083987[/C][C]0.363377947041993[/C][/ROW]
[ROW][C]48[/C][C]0.593592760849925[/C][C]0.81281447830015[/C][C]0.406407239150075[/C][/ROW]
[ROW][C]49[/C][C]0.551687278401917[/C][C]0.896625443196166[/C][C]0.448312721598083[/C][/ROW]
[ROW][C]50[/C][C]0.526164665994816[/C][C]0.947670668010368[/C][C]0.473835334005184[/C][/ROW]
[ROW][C]51[/C][C]0.502520389984824[/C][C]0.994959220030352[/C][C]0.497479610015176[/C][/ROW]
[ROW][C]52[/C][C]0.464163687856552[/C][C]0.928327375713104[/C][C]0.535836312143448[/C][/ROW]
[ROW][C]53[/C][C]0.448621816158423[/C][C]0.897243632316847[/C][C]0.551378183841577[/C][/ROW]
[ROW][C]54[/C][C]0.427480195679160[/C][C]0.854960391358319[/C][C]0.57251980432084[/C][/ROW]
[/TABLE]
Source: https://freestatistics.org/blog/index.php?pk=63275&T=5

Globally Unique Identifier (entire table): ba.freestatistics.org/blog/index.php?pk=63275&T=5

As an alternative you can also use a QR Code:  

The GUIDs for individual cells are displayed in the table below:

Goldfeld-Quandt test for Heteroskedasticity
p-valuesAlternative Hypothesis
breakpoint indexgreater2-sidedless
150.1090192616273830.2180385232547660.890980738372617
160.06755515236011920.1351103047202380.93244484763988
170.04231565322453870.08463130644907730.957684346775461
180.02587754376388760.05175508752777520.974122456236112
190.01648391161541300.03296782323082610.983516088384587
200.008850843315983560.01770168663196710.991149156684016
210.004745676885386910.009491353770773820.995254323114613
220.002890381807240940.005780763614481890.99710961819276
230.001799381587824290.003598763175648580.998200618412176
240.001219541240033220.002439082480066440.998780458759967
250.0007163081599367080.001432616319873420.999283691840063
260.0004228452860780600.0008456905721561190.999577154713922
270.0002620367991888520.0005240735983777040.999737963200811
280.0001802463271343370.0003604926542686750.999819753672866
290.0001490247348916830.0002980494697833660.999850975265108
300.0001117728352622970.0002235456705245950.999888227164738
310.0001214859690352390.0002429719380704780.999878514030965
320.0006275651182457350.001255130236491470.999372434881754
330.001657749914145390.003315499828290790.998342250085855
340.02030141035103980.04060282070207970.97969858964896
350.07914676892005170.1582935378401030.920853231079948
360.1986362084710090.3972724169420170.801363791528992
370.2557347325088730.5114694650177470.744265267491127
380.3311772735414670.6623545470829340.668822726458533
390.4005720303436420.8011440606872840.599427969656358
400.4643599641076480.9287199282152970.535640035892352
410.5115953618453670.9768092763092660.488404638154633
420.5520540695130390.8958918609739230.447945930486961
430.5664493559706860.8671012880586280.433550644029314
440.6062470146163370.7875059707673270.393752985383663
450.6525117157925750.6949765684148510.347488284207425
460.6600261007569050.679947798486190.339973899243095
470.6366220529580070.7267558940839870.363377947041993
480.5935927608499250.812814478300150.406407239150075
490.5516872784019170.8966254431961660.448312721598083
500.5261646659948160.9476706680103680.473835334005184
510.5025203899848240.9949592200303520.497479610015176
520.4641636878565520.9283273757131040.535836312143448
530.4486218161584230.8972436323168470.551378183841577
540.4274801956791600.8549603913583190.57251980432084


Meta Analysis of Goldfeld-Quandt test for Heteroskedasticity
Description# significant tests% significant testsOK/NOK
1% type I error level130.325NOK
5% type I error level160.4NOK
10% type I error level180.45NOK

\begin{tabular}{lllllllll}
\hline
Meta Analysis of Goldfeld-Quandt test for Heteroskedasticity \tabularnewline
Description & # significant tests & % significant tests & OK/NOK \tabularnewline
1% type I error level & 13 & 0.325 & NOK \tabularnewline
5% type I error level & 16 & 0.4 & NOK \tabularnewline
10% type I error level & 18 & 0.45 & NOK \tabularnewline
\hline
\end{tabular}
%Source: https://freestatistics.org/blog/index.php?pk=63275&T=6

[TABLE]
[ROW][C]Meta Analysis of Goldfeld-Quandt test for Heteroskedasticity[/C][/ROW]
[ROW][C]Description[/C][C]# significant tests[/C][C]% significant tests[/C][C]OK/NOK[/C][/ROW]
[ROW][C]1% type I error level[/C][C]13[/C][C]0.325[/C][C]NOK[/C][/ROW]
[ROW][C]5% type I error level[/C][C]16[/C][C]0.4[/C][C]NOK[/C][/ROW]
[ROW][C]10% type I error level[/C][C]18[/C][C]0.45[/C][C]NOK[/C][/ROW]
[/TABLE]
Source: https://freestatistics.org/blog/index.php?pk=63275&T=6

Globally Unique Identifier (entire table): ba.freestatistics.org/blog/index.php?pk=63275&T=6

As an alternative you can also use a QR Code:  

The GUIDs for individual cells are displayed in the table below:

Meta Analysis of Goldfeld-Quandt test for Heteroskedasticity
Description# significant tests% significant testsOK/NOK
1% type I error level130.325NOK
5% type I error level160.4NOK
10% type I error level180.45NOK


Parameters (Session):
par1 = 1 ; par2 = Include Monthly Dummies ; par3 = No Linear Trend ;
Parameters (R input):
par1 = 1 ; par2 = Include Monthly Dummies ; par3 = No Linear Trend ;
R code (references can be found in the software module):
library(lattice)
library(lmtest)
n25 <- 25 #minimum number of obs. for Goldfeld-Quandt test
par1 <- as.numeric(par1)
x <- t(y)
k <- length(x[1,])
n <- length(x[,1])
x1 <- cbind(x[,par1], x[,1:k!=par1])
mycolnames <- c(colnames(x)[par1], colnames(x)[1:k!=par1])
colnames(x1) <- mycolnames #colnames(x)[par1]
x <- x1
if (par3 == 'First Differences'){
x2 <- array(0, dim=c(n-1,k), dimnames=list(1:(n-1), paste('(1-B)',colnames(x),sep='')))
for (i in 1:n-1) {
for (j in 1:k) {
x2[i,j] <- x[i+1,j] - x[i,j]
}
}
x <- x2
}
if (par2 == 'Include Monthly Dummies'){
x2 <- array(0, dim=c(n,11), dimnames=list(1:n, paste('M', seq(1:11), sep ='')))
for (i in 1:11){
x2[seq(i,n,12),i] <- 1
}
x <- cbind(x, x2)
}
if (par2 == 'Include Quarterly Dummies'){
x2 <- array(0, dim=c(n,3), dimnames=list(1:n, paste('Q', seq(1:3), sep ='')))
for (i in 1:3){
x2[seq(i,n,4),i] <- 1
}
x <- cbind(x, x2)
}
k <- length(x[1,])
if (par3 == 'Linear Trend'){
x <- cbind(x, c(1:n))
colnames(x)[k+1] <- 't'
}
x
k <- length(x[1,])
df <- as.data.frame(x)
(mylm <- lm(df))
(mysum <- summary(mylm))
if (n > n25) {
kp3 <- k + 3
nmkm3 <- n - k - 3
gqarr <- array(NA, dim=c(nmkm3-kp3+1,3))
numgqtests <- 0
numsignificant1 <- 0
numsignificant5 <- 0
numsignificant10 <- 0
for (mypoint in kp3:nmkm3) {
j <- 0
numgqtests <- numgqtests + 1
for (myalt in c('greater', 'two.sided', 'less')) {
j <- j + 1
gqarr[mypoint-kp3+1,j] <- gqtest(mylm, point=mypoint, alternative=myalt)$p.value
}
if (gqarr[mypoint-kp3+1,2] < 0.01) numsignificant1 <- numsignificant1 + 1
if (gqarr[mypoint-kp3+1,2] < 0.05) numsignificant5 <- numsignificant5 + 1
if (gqarr[mypoint-kp3+1,2] < 0.10) numsignificant10 <- numsignificant10 + 1
}
gqarr
}
bitmap(file='test0.png')
plot(x[,1], type='l', main='Actuals and Interpolation', ylab='value of Actuals and Interpolation (dots)', xlab='time or index')
points(x[,1]-mysum$resid)
grid()
dev.off()
bitmap(file='test1.png')
plot(mysum$resid, type='b', pch=19, main='Residuals', ylab='value of Residuals', xlab='time or index')
grid()
dev.off()
bitmap(file='test2.png')
hist(mysum$resid, main='Residual Histogram', xlab='values of Residuals')
grid()
dev.off()
bitmap(file='test3.png')
densityplot(~mysum$resid,col='black',main='Residual Density Plot', xlab='values of Residuals')
dev.off()
bitmap(file='test4.png')
qqnorm(mysum$resid, main='Residual Normal Q-Q Plot')
qqline(mysum$resid)
grid()
dev.off()
(myerror <- as.ts(mysum$resid))
bitmap(file='test5.png')
dum <- cbind(lag(myerror,k=1),myerror)
dum
dum1 <- dum[2:length(myerror),]
dum1
z <- as.data.frame(dum1)
z
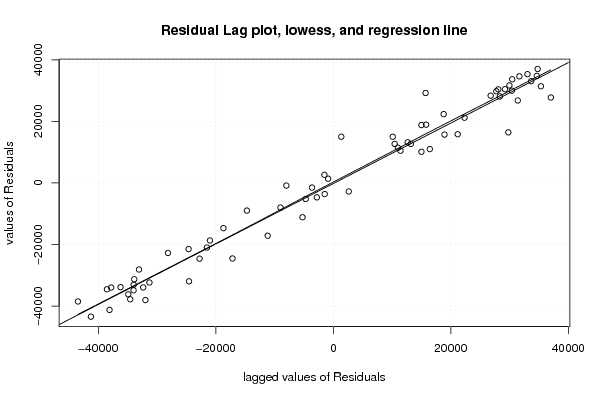
plot(z,main=paste('Residual Lag plot, lowess, and regression line'), ylab='values of Residuals', xlab='lagged values of Residuals')
lines(lowess(z))
abline(lm(z))
grid()
dev.off()
bitmap(file='test6.png')
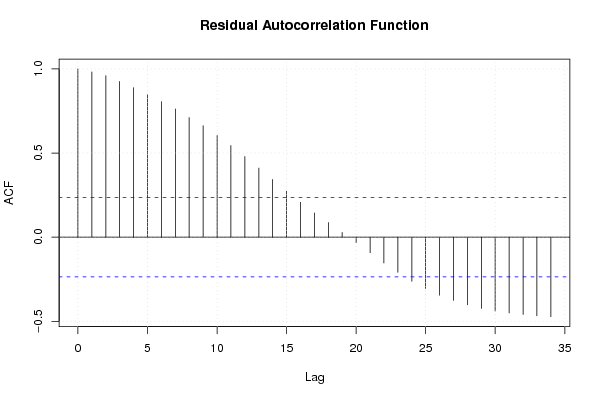
acf(mysum$resid, lag.max=length(mysum$resid)/2, main='Residual Autocorrelation Function')
grid()
dev.off()
bitmap(file='test7.png')
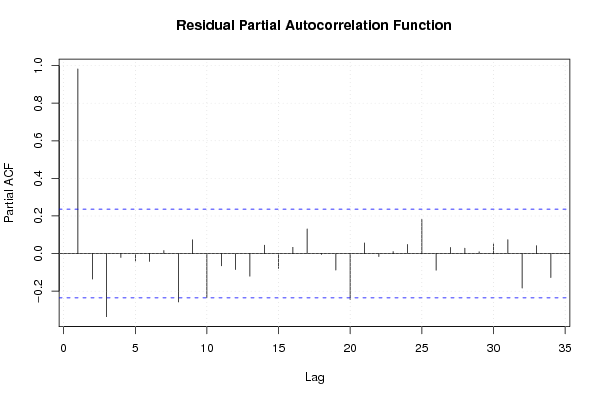
pacf(mysum$resid, lag.max=length(mysum$resid)/2, main='Residual Partial Autocorrelation Function')
grid()
dev.off()
bitmap(file='test8.png')
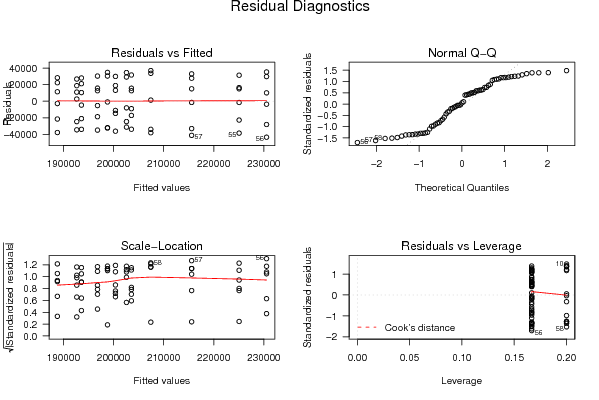
opar <- par(mfrow = c(2,2), oma = c(0, 0, 1.1, 0))
plot(mylm, las = 1, sub='Residual Diagnostics')
par(opar)
dev.off()
if (n > n25) {
bitmap(file='test9.png')
plot(kp3:nmkm3,gqarr[,2], main='Goldfeld-Quandt test',ylab='2-sided p-value',xlab='breakpoint')
grid()
dev.off()
}
load(file='createtable')
a<-table.start()
a<-table.row.start(a)
a<-table.element(a, 'Multiple Linear Regression - Estimated Regression Equation', 1, TRUE)
a<-table.row.end(a)
myeq <- colnames(x)[1]
myeq <- paste(myeq, '[t] = ', sep='')
for (i in 1:k){
if (mysum$coefficients[i,1] > 0) myeq <- paste(myeq, '+', '')
myeq <- paste(myeq, mysum$coefficients[i,1], sep=' ')
if (rownames(mysum$coefficients)[i] != '(Intercept)') {
myeq <- paste(myeq, rownames(mysum$coefficients)[i], sep='')
if (rownames(mysum$coefficients)[i] != 't') myeq <- paste(myeq, '[t]', sep='')
}
}
myeq <- paste(myeq, ' + e[t]')
a<-table.row.start(a)
a<-table.element(a, myeq)
a<-table.row.end(a)
a<-table.end(a)
table.save(a,file='mytable1.tab')
a<-table.start()
a<-table.row.start(a)
a<-table.element(a,hyperlink('ols1.htm','Multiple Linear Regression - Ordinary Least Squares',''), 6, TRUE)
a<-table.row.end(a)
a<-table.row.start(a)
a<-table.element(a,'Variable',header=TRUE)
a<-table.element(a,'Parameter',header=TRUE)
a<-table.element(a,'S.D.',header=TRUE)
a<-table.element(a,'T-STAT
H0: parameter = 0',header=TRUE)
a<-table.element(a,'2-tail p-value',header=TRUE)
a<-table.element(a,'1-tail p-value',header=TRUE)
a<-table.row.end(a)
for (i in 1:k){
a<-table.row.start(a)
a<-table.element(a,rownames(mysum$coefficients)[i],header=TRUE)
a<-table.element(a,mysum$coefficients[i,1])
a<-table.element(a, round(mysum$coefficients[i,2],6))
a<-table.element(a, round(mysum$coefficients[i,3],4))
a<-table.element(a, round(mysum$coefficients[i,4],6))
a<-table.element(a, round(mysum$coefficients[i,4]/2,6))
a<-table.row.end(a)
}
a<-table.end(a)
table.save(a,file='mytable2.tab')
a<-table.start()
a<-table.row.start(a)
a<-table.element(a, 'Multiple Linear Regression - Regression Statistics', 2, TRUE)
a<-table.row.end(a)
a<-table.row.start(a)
a<-table.element(a, 'Multiple R',1,TRUE)
a<-table.element(a, sqrt(mysum$r.squared))
a<-table.row.end(a)
a<-table.row.start(a)
a<-table.element(a, 'R-squared',1,TRUE)
a<-table.element(a, mysum$r.squared)
a<-table.row.end(a)
a<-table.row.start(a)
a<-table.element(a, 'Adjusted R-squared',1,TRUE)
a<-table.element(a, mysum$adj.r.squared)
a<-table.row.end(a)
a<-table.row.start(a)
a<-table.element(a, 'F-TEST (value)',1,TRUE)
a<-table.element(a, mysum$fstatistic[1])
a<-table.row.end(a)
a<-table.row.start(a)
a<-table.element(a, 'F-TEST (DF numerator)',1,TRUE)
a<-table.element(a, mysum$fstatistic[2])
a<-table.row.end(a)
a<-table.row.start(a)
a<-table.element(a, 'F-TEST (DF denominator)',1,TRUE)
a<-table.element(a, mysum$fstatistic[3])
a<-table.row.end(a)
a<-table.row.start(a)
a<-table.element(a, 'p-value',1,TRUE)
a<-table.element(a, 1-pf(mysum$fstatistic[1],mysum$fstatistic[2],mysum$fstatistic[3]))
a<-table.row.end(a)
a<-table.row.start(a)
a<-table.element(a, 'Multiple Linear Regression - Residual Statistics', 2, TRUE)
a<-table.row.end(a)
a<-table.row.start(a)
a<-table.element(a, 'Residual Standard Deviation',1,TRUE)
a<-table.element(a, mysum$sigma)
a<-table.row.end(a)
a<-table.row.start(a)
a<-table.element(a, 'Sum Squared Residuals',1,TRUE)
a<-table.element(a, sum(myerror*myerror))
a<-table.row.end(a)
a<-table.end(a)
table.save(a,file='mytable3.tab')
a<-table.start()
a<-table.row.start(a)
a<-table.element(a, 'Multiple Linear Regression - Actuals, Interpolation, and Residuals', 4, TRUE)
a<-table.row.end(a)
a<-table.row.start(a)
a<-table.element(a, 'Time or Index', 1, TRUE)
a<-table.element(a, 'Actuals', 1, TRUE)
a<-table.element(a, 'Interpolation
Forecast', 1, TRUE)
a<-table.element(a, 'Residuals
Prediction Error', 1, TRUE)
a<-table.row.end(a)
for (i in 1:n) {
a<-table.row.start(a)
a<-table.element(a,i, 1, TRUE)
a<-table.element(a,x[i])
a<-table.element(a,x[i]-mysum$resid[i])
a<-table.element(a,mysum$resid[i])
a<-table.row.end(a)
}
a<-table.end(a)
table.save(a,file='mytable4.tab')
if (n > n25) {
a<-table.start()
a<-table.row.start(a)
a<-table.element(a,'Goldfeld-Quandt test for Heteroskedasticity',4,TRUE)
a<-table.row.end(a)
a<-table.row.start(a)
a<-table.element(a,'p-values',header=TRUE)
a<-table.element(a,'Alternative Hypothesis',3,header=TRUE)
a<-table.row.end(a)
a<-table.row.start(a)
a<-table.element(a,'breakpoint index',header=TRUE)
a<-table.element(a,'greater',header=TRUE)
a<-table.element(a,'2-sided',header=TRUE)
a<-table.element(a,'less',header=TRUE)
a<-table.row.end(a)
for (mypoint in kp3:nmkm3) {
a<-table.row.start(a)
a<-table.element(a,mypoint,header=TRUE)
a<-table.element(a,gqarr[mypoint-kp3+1,1])
a<-table.element(a,gqarr[mypoint-kp3+1,2])
a<-table.element(a,gqarr[mypoint-kp3+1,3])
a<-table.row.end(a)
}
a<-table.end(a)
table.save(a,file='mytable5.tab')
a<-table.start()
a<-table.row.start(a)
a<-table.element(a,'Meta Analysis of Goldfeld-Quandt test for Heteroskedasticity',4,TRUE)
a<-table.row.end(a)
a<-table.row.start(a)
a<-table.element(a,'Description',header=TRUE)
a<-table.element(a,'# significant tests',header=TRUE)
a<-table.element(a,'% significant tests',header=TRUE)
a<-table.element(a,'OK/NOK',header=TRUE)
a<-table.row.end(a)
a<-table.row.start(a)
a<-table.element(a,'1% type I error level',header=TRUE)
a<-table.element(a,numsignificant1)
a<-table.element(a,numsignificant1/numgqtests)
if (numsignificant1/numgqtests < 0.01) dum <- 'OK' else dum <- 'NOK'
a<-table.element(a,dum)
a<-table.row.end(a)
a<-table.row.start(a)
a<-table.element(a,'5% type I error level',header=TRUE)
a<-table.element(a,numsignificant5)
a<-table.element(a,numsignificant5/numgqtests)
if (numsignificant5/numgqtests < 0.05) dum <- 'OK' else dum <- 'NOK'
a<-table.element(a,dum)
a<-table.row.end(a)
a<-table.row.start(a)
a<-table.element(a,'10% type I error level',header=TRUE)
a<-table.element(a,numsignificant10)
a<-table.element(a,numsignificant10/numgqtests)
if (numsignificant10/numgqtests < 0.1) dum <- 'OK' else dum <- 'NOK'
a<-table.element(a,dum)
a<-table.row.end(a)
a<-table.end(a)
table.save(a,file='mytable6.tab')
}