Free Statistics

of Irreproducible Research!

Author's title

Author*The author of this computation has been verified*
R Software Modulerwasp_multipleregression.wasp
Title produced by softwareMultiple Regression
Date of computationFri, 04 Dec 2009 04:01:55 -0700
Cite this page as followsStatistical Computations at FreeStatistics.org, Office for Research Development and Education, URL https://freestatistics.org/blog/index.php?v=date/2009/Dec/04/t1259924589rj1o4jg78w6glz8.htm/, Retrieved Sat, 27 Apr 2024 18:07:20 +0000
Statistical Computations at FreeStatistics.org, Office for Research Development and Education, URL https://freestatistics.org/blog/index.php?pk=63276, Retrieved Sat, 27 Apr 2024 18:07:20 +0000
QR Codes:

Original text written by user:
IsPrivate?No (this computation is public)
User-defined keywords
Estimated Impact133
Family? (F = Feedback message, R = changed R code, M = changed R Module, P = changed Parameters, D = changed Data)
-     [Multiple Regression] [Q1 The Seatbeltlaw] [2007-11-14 19:27:43] [8cd6641b921d30ebe00b648d1481bba0]
- RMPD  [Multiple Regression] [Seatbelt] [2009-11-12 13:54:52] [b98453cac15ba1066b407e146608df68]
-    D    [Multiple Regression] [WS7] [2009-11-18 15:22:11] [cd6314e7e707a6546bd4604c9d1f2b69]
-   PD      [Multiple Regression] [Paper - multiple ...] [2009-12-04 10:59:15] [cd6314e7e707a6546bd4604c9d1f2b69]
-   P           [Multiple Regression] [Paper - multiple ...] [2009-12-04 11:01:55] [ea241b681aafed79da4b5b99fad98471] [Current]
Feedback Forum

Post a new message
Dataseries X:
216234
213587
209465
204045
200237
203666
241476
260307
243324
244460
233575
237217
235243
230354
227184
221678
217142
219452
256446
265845
248624
241114
229245
231805
219277
219313
212610
214771
211142
211457
240048
240636
230580
208795
197922
194596
194581
185686
178106
172608
167302
168053
202300
202388
182516
173476
166444
171297
169701
164182
161914
159612
151001
158114
186530
187069
174330
169362
166827
178037
186412
189226
191563
188906
186005
195309
223532
226899
214126


Summary of computational transaction
Raw Inputview raw input (R code)
Raw Outputview raw output of R engine
Computing time4 seconds
R Server'Gwilym Jenkins' @ 72.249.127.135

\begin{tabular}{lllllllll}
\hline
Summary of computational transaction \tabularnewline
Raw Input & view raw input (R code)  \tabularnewline
Raw Output & view raw output of R engine  \tabularnewline
Computing time & 4 seconds \tabularnewline
R Server & 'Gwilym Jenkins' @ 72.249.127.135 \tabularnewline
\hline
\end{tabular}
%Source: https://freestatistics.org/blog/index.php?pk=63276&T=0

[TABLE]
[ROW][C]Summary of computational transaction[/C][/ROW]
[ROW][C]Raw Input[/C][C]view raw input (R code) [/C][/ROW]
[ROW][C]Raw Output[/C][C]view raw output of R engine [/C][/ROW]
[ROW][C]Computing time[/C][C]4 seconds[/C][/ROW]
[ROW][C]R Server[/C][C]'Gwilym Jenkins' @ 72.249.127.135[/C][/ROW]
[/TABLE]
Source: https://freestatistics.org/blog/index.php?pk=63276&T=0

Globally Unique Identifier (entire table): ba.freestatistics.org/blog/index.php?pk=63276&T=0

As an alternative you can also use a QR Code:  

The GUIDs for individual cells are displayed in the table below:

Summary of computational transaction
Raw Inputview raw input (R code)
Raw Outputview raw output of R engine
Computing time4 seconds
R Server'Gwilym Jenkins' @ 72.249.127.135


Multiple Linear Regression - Estimated Regression Equation
Werkl[t] = + 237091.616 -3807.56888888884M1[t] -6032.53511111112M2[t] -8658.50133333337M3[t] -10903.8008888889M4[t] -14743.9337777778M5[t] -9915.23333333334M6[t] + 23423.3004444444M7[t] + 29850.3342222222M8[t] + 15868.0346666666M9[t] + 2934.26577777775M10[t] -4746.16711111114M11[t] -958.367111111112t + e[t]

\begin{tabular}{lllllllll}
\hline
Multiple Linear Regression - Estimated Regression Equation \tabularnewline
Werkl[t] =  +  237091.616 -3807.56888888884M1[t] -6032.53511111112M2[t] -8658.50133333337M3[t] -10903.8008888889M4[t] -14743.9337777778M5[t] -9915.23333333334M6[t] +  23423.3004444444M7[t] +  29850.3342222222M8[t] +  15868.0346666666M9[t] +  2934.26577777775M10[t] -4746.16711111114M11[t] -958.367111111112t  + e[t] \tabularnewline
\hline
\end{tabular}
%Source: https://freestatistics.org/blog/index.php?pk=63276&T=1

[TABLE]
[ROW][C]Multiple Linear Regression - Estimated Regression Equation[/C][/ROW]
[ROW][C]Werkl[t] =  +  237091.616 -3807.56888888884M1[t] -6032.53511111112M2[t] -8658.50133333337M3[t] -10903.8008888889M4[t] -14743.9337777778M5[t] -9915.23333333334M6[t] +  23423.3004444444M7[t] +  29850.3342222222M8[t] +  15868.0346666666M9[t] +  2934.26577777775M10[t] -4746.16711111114M11[t] -958.367111111112t  + e[t][/C][/ROW]
[/TABLE]
Source: https://freestatistics.org/blog/index.php?pk=63276&T=1

Globally Unique Identifier (entire table): ba.freestatistics.org/blog/index.php?pk=63276&T=1

As an alternative you can also use a QR Code:  

The GUIDs for individual cells are displayed in the table below:

Multiple Linear Regression - Estimated Regression Equation
Werkl[t] = + 237091.616 -3807.56888888884M1[t] -6032.53511111112M2[t] -8658.50133333337M3[t] -10903.8008888889M4[t] -14743.9337777778M5[t] -9915.23333333334M6[t] + 23423.3004444444M7[t] + 29850.3342222222M8[t] + 15868.0346666666M9[t] + 2934.26577777775M10[t] -4746.16711111114M11[t] -958.367111111112t + e[t]


Multiple Linear Regression - Ordinary Least Squares
VariableParameterS.D.T-STATH0: parameter = 02-tail p-value1-tail p-value
(Intercept)237091.6169352.04400325.351800
M1-3807.5688888888411385.813789-0.33440.7393170.369658
M2-6032.5351111111211380.650284-0.53010.5981590.29908
M3-8658.5013333333711376.632605-0.76110.4498040.224902
M4-10903.800888888911373.761965-0.95870.3418410.17092
M5-14743.933777777811372.039233-1.29650.2001180.100059
M6-9915.2333333333411371.464932-0.87190.3869640.193482
M723423.300444444411372.0392332.05970.0440840.022042
M829850.334222222211373.7619652.62450.0111640.005582
M915868.034666666611376.6326051.39480.1685870.084293
M102934.2657777777511879.3070210.2470.8058070.402903
M11-4746.1671111111411877.657614-0.39960.690980.34549
t-958.367111111112114.287523-8.385600

\begin{tabular}{lllllllll}
\hline
Multiple Linear Regression - Ordinary Least Squares \tabularnewline
Variable & Parameter & S.D. & T-STATH0: parameter = 0 & 2-tail p-value & 1-tail p-value \tabularnewline
(Intercept) & 237091.616 & 9352.044003 & 25.3518 & 0 & 0 \tabularnewline
M1 & -3807.56888888884 & 11385.813789 & -0.3344 & 0.739317 & 0.369658 \tabularnewline
M2 & -6032.53511111112 & 11380.650284 & -0.5301 & 0.598159 & 0.29908 \tabularnewline
M3 & -8658.50133333337 & 11376.632605 & -0.7611 & 0.449804 & 0.224902 \tabularnewline
M4 & -10903.8008888889 & 11373.761965 & -0.9587 & 0.341841 & 0.17092 \tabularnewline
M5 & -14743.9337777778 & 11372.039233 & -1.2965 & 0.200118 & 0.100059 \tabularnewline
M6 & -9915.23333333334 & 11371.464932 & -0.8719 & 0.386964 & 0.193482 \tabularnewline
M7 & 23423.3004444444 & 11372.039233 & 2.0597 & 0.044084 & 0.022042 \tabularnewline
M8 & 29850.3342222222 & 11373.761965 & 2.6245 & 0.011164 & 0.005582 \tabularnewline
M9 & 15868.0346666666 & 11376.632605 & 1.3948 & 0.168587 & 0.084293 \tabularnewline
M10 & 2934.26577777775 & 11879.307021 & 0.247 & 0.805807 & 0.402903 \tabularnewline
M11 & -4746.16711111114 & 11877.657614 & -0.3996 & 0.69098 & 0.34549 \tabularnewline
t & -958.367111111112 & 114.287523 & -8.3856 & 0 & 0 \tabularnewline
\hline
\end{tabular}
%Source: https://freestatistics.org/blog/index.php?pk=63276&T=2

[TABLE]
[ROW][C]Multiple Linear Regression - Ordinary Least Squares[/C][/ROW]
[ROW][C]Variable[/C][C]Parameter[/C][C]S.D.[/C][C]T-STATH0: parameter = 0[/C][C]2-tail p-value[/C][C]1-tail p-value[/C][/ROW]
[ROW][C](Intercept)[/C][C]237091.616[/C][C]9352.044003[/C][C]25.3518[/C][C]0[/C][C]0[/C][/ROW]
[ROW][C]M1[/C][C]-3807.56888888884[/C][C]11385.813789[/C][C]-0.3344[/C][C]0.739317[/C][C]0.369658[/C][/ROW]
[ROW][C]M2[/C][C]-6032.53511111112[/C][C]11380.650284[/C][C]-0.5301[/C][C]0.598159[/C][C]0.29908[/C][/ROW]
[ROW][C]M3[/C][C]-8658.50133333337[/C][C]11376.632605[/C][C]-0.7611[/C][C]0.449804[/C][C]0.224902[/C][/ROW]
[ROW][C]M4[/C][C]-10903.8008888889[/C][C]11373.761965[/C][C]-0.9587[/C][C]0.341841[/C][C]0.17092[/C][/ROW]
[ROW][C]M5[/C][C]-14743.9337777778[/C][C]11372.039233[/C][C]-1.2965[/C][C]0.200118[/C][C]0.100059[/C][/ROW]
[ROW][C]M6[/C][C]-9915.23333333334[/C][C]11371.464932[/C][C]-0.8719[/C][C]0.386964[/C][C]0.193482[/C][/ROW]
[ROW][C]M7[/C][C]23423.3004444444[/C][C]11372.039233[/C][C]2.0597[/C][C]0.044084[/C][C]0.022042[/C][/ROW]
[ROW][C]M8[/C][C]29850.3342222222[/C][C]11373.761965[/C][C]2.6245[/C][C]0.011164[/C][C]0.005582[/C][/ROW]
[ROW][C]M9[/C][C]15868.0346666666[/C][C]11376.632605[/C][C]1.3948[/C][C]0.168587[/C][C]0.084293[/C][/ROW]
[ROW][C]M10[/C][C]2934.26577777775[/C][C]11879.307021[/C][C]0.247[/C][C]0.805807[/C][C]0.402903[/C][/ROW]
[ROW][C]M11[/C][C]-4746.16711111114[/C][C]11877.657614[/C][C]-0.3996[/C][C]0.69098[/C][C]0.34549[/C][/ROW]
[ROW][C]t[/C][C]-958.367111111112[/C][C]114.287523[/C][C]-8.3856[/C][C]0[/C][C]0[/C][/ROW]
[/TABLE]
Source: https://freestatistics.org/blog/index.php?pk=63276&T=2

Globally Unique Identifier (entire table): ba.freestatistics.org/blog/index.php?pk=63276&T=2

As an alternative you can also use a QR Code:  

The GUIDs for individual cells are displayed in the table below:

Multiple Linear Regression - Ordinary Least Squares
VariableParameterS.D.T-STATH0: parameter = 02-tail p-value1-tail p-value
(Intercept)237091.6169352.04400325.351800
M1-3807.5688888888411385.813789-0.33440.7393170.369658
M2-6032.5351111111211380.650284-0.53010.5981590.29908
M3-8658.5013333333711376.632605-0.76110.4498040.224902
M4-10903.800888888911373.761965-0.95870.3418410.17092
M5-14743.933777777811372.039233-1.29650.2001180.100059
M6-9915.2333333333411371.464932-0.87190.3869640.193482
M723423.300444444411372.0392332.05970.0440840.022042
M829850.334222222211373.7619652.62450.0111640.005582
M915868.034666666611376.6326051.39480.1685870.084293
M102934.2657777777511879.3070210.2470.8058070.402903
M11-4746.1671111111411877.657614-0.39960.690980.34549
t-958.367111111112114.287523-8.385600


Multiple Linear Regression - Regression Statistics
Multiple R0.802972043958226
R-squared0.644764103378451
Adjusted R-squared0.568642125530976
F-TEST (value)8.47014386134791
F-TEST (DF numerator)12
F-TEST (DF denominator)56
p-value7.57113860494485e-09
Multiple Linear Regression - Residual Statistics
Residual Standard Deviation18779.3562689802
Sum Squared Residuals19749196425.128

\begin{tabular}{lllllllll}
\hline
Multiple Linear Regression - Regression Statistics \tabularnewline
Multiple R & 0.802972043958226 \tabularnewline
R-squared & 0.644764103378451 \tabularnewline
Adjusted R-squared & 0.568642125530976 \tabularnewline
F-TEST (value) & 8.47014386134791 \tabularnewline
F-TEST (DF numerator) & 12 \tabularnewline
F-TEST (DF denominator) & 56 \tabularnewline
p-value & 7.57113860494485e-09 \tabularnewline
Multiple Linear Regression - Residual Statistics \tabularnewline
Residual Standard Deviation & 18779.3562689802 \tabularnewline
Sum Squared Residuals & 19749196425.128 \tabularnewline
\hline
\end{tabular}
%Source: https://freestatistics.org/blog/index.php?pk=63276&T=3

[TABLE]
[ROW][C]Multiple Linear Regression - Regression Statistics[/C][/ROW]
[ROW][C]Multiple R[/C][C]0.802972043958226[/C][/ROW]
[ROW][C]R-squared[/C][C]0.644764103378451[/C][/ROW]
[ROW][C]Adjusted R-squared[/C][C]0.568642125530976[/C][/ROW]
[ROW][C]F-TEST (value)[/C][C]8.47014386134791[/C][/ROW]
[ROW][C]F-TEST (DF numerator)[/C][C]12[/C][/ROW]
[ROW][C]F-TEST (DF denominator)[/C][C]56[/C][/ROW]
[ROW][C]p-value[/C][C]7.57113860494485e-09[/C][/ROW]
[ROW][C]Multiple Linear Regression - Residual Statistics[/C][/ROW]
[ROW][C]Residual Standard Deviation[/C][C]18779.3562689802[/C][/ROW]
[ROW][C]Sum Squared Residuals[/C][C]19749196425.128[/C][/ROW]
[/TABLE]
Source: https://freestatistics.org/blog/index.php?pk=63276&T=3

Globally Unique Identifier (entire table): ba.freestatistics.org/blog/index.php?pk=63276&T=3

As an alternative you can also use a QR Code:  

The GUIDs for individual cells are displayed in the table below:

Multiple Linear Regression - Regression Statistics
Multiple R0.802972043958226
R-squared0.644764103378451
Adjusted R-squared0.568642125530976
F-TEST (value)8.47014386134791
F-TEST (DF numerator)12
F-TEST (DF denominator)56
p-value7.57113860494485e-09
Multiple Linear Regression - Residual Statistics
Residual Standard Deviation18779.3562689802
Sum Squared Residuals19749196425.128


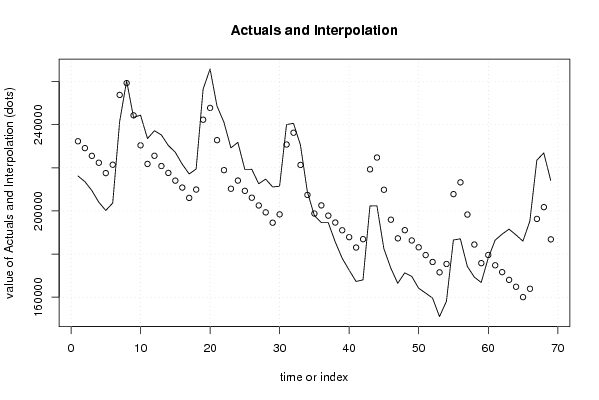
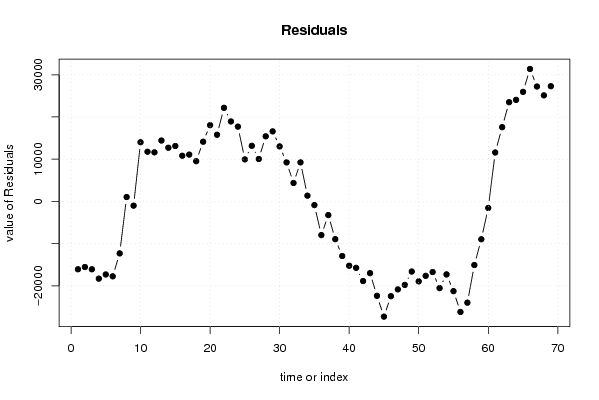
Multiple Linear Regression - Actuals, Interpolation, and Residuals
Time or IndexActualsInterpolationForecastResidualsPrediction Error
1216234232325.680000000-16091.6799999996
2213587229142.346666667-15555.3466666667
3209465225558.013333333-16093.0133333334
4204045222354.346666667-18309.3466666667
5200237217555.846666667-17318.8466666666
6203666221426.18-17760.1800000000
7241476253806.346666667-12330.3466666667
8260307259275.0133333331031.98666666669
9243324244334.346666667-1010.34666666669
10244460230442.21066666714017.7893333333
11233575221803.41066666711771.5893333333
12237217225591.21066666711625.7893333333
13235243220825.27466666714417.7253333332
14230354217641.94133333312712.0586666667
15227184214057.60813126.392
16221678210853.94133333310824.0586666667
17217142206055.44133333311086.5586666667
18219452209925.7746666679526.22533333333
19256446242305.94133333314140.0586666667
20265845247774.60818070.392
21248624232833.94133333315790.0586666667
22241114218941.80533333322172.1946666667
23229245210303.00533333318941.9946666666
24231805214090.80533333317714.1946666666
25219277209324.8693333339952.13066666658
26219313206141.53613171.464
27212610202557.20266666710052.7973333333
28214771199353.53615417.464
29211142194555.03616586.964
30211457198425.36933333313031.6306666667
31240048230805.5369242.464
32240636236274.2026666674361.79733333332
33230580221333.5369246.464
34208795207441.41353.60000000000
35197922198802.6-880.600000000006
36194596202590.4-7994.40000000002
37194581197824.464-3243.46400000007
38185686194641.130666667-8955.13066666666
39178106191056.797333333-12950.7973333333
40172608187853.130666667-15245.1306666667
41167302183054.630666667-15752.6306666667
42168053186924.964-18871.9640000000
43202300219305.130666667-17005.1306666667
44202388224773.797333333-22385.7973333333
45182516209833.130666667-27317.1306666667
46173476195940.994666667-22464.9946666666
47166444187302.194666667-20858.1946666667
48171297191089.994666667-19792.9946666667
49169701186324.058666667-16623.0586666667
50164182183140.725333333-18958.7253333333
51161914179556.392-17642.392
52159612176352.725333333-16740.7253333333
53151001171554.225333333-20553.2253333333
54158114175424.558666667-17310.5586666666
55186530207804.725333333-21274.7253333333
56187069213273.392-26204.392
57174330198332.725333333-24002.7253333333
58169362184440.589333333-15078.5893333333
59166827175801.789333333-8974.78933333332
60178037179589.589333333-1552.58933333334
61186412174823.65333333311588.3466666666
62189226171640.3217585.6800000000
63191563168055.98666666723507.0133333334
64188906164852.3224053.68
65186005160053.8225951.18
66195309163924.15333333331384.8466666667
67223532196304.3227227.6800000000
68226899201772.98666666725126.0133333333
69214126186832.3227293.6800000000

\begin{tabular}{lllllllll}
\hline
Multiple Linear Regression - Actuals, Interpolation, and Residuals \tabularnewline
Time or Index & Actuals & InterpolationForecast & ResidualsPrediction Error \tabularnewline
1 & 216234 & 232325.680000000 & -16091.6799999996 \tabularnewline
2 & 213587 & 229142.346666667 & -15555.3466666667 \tabularnewline
3 & 209465 & 225558.013333333 & -16093.0133333334 \tabularnewline
4 & 204045 & 222354.346666667 & -18309.3466666667 \tabularnewline
5 & 200237 & 217555.846666667 & -17318.8466666666 \tabularnewline
6 & 203666 & 221426.18 & -17760.1800000000 \tabularnewline
7 & 241476 & 253806.346666667 & -12330.3466666667 \tabularnewline
8 & 260307 & 259275.013333333 & 1031.98666666669 \tabularnewline
9 & 243324 & 244334.346666667 & -1010.34666666669 \tabularnewline
10 & 244460 & 230442.210666667 & 14017.7893333333 \tabularnewline
11 & 233575 & 221803.410666667 & 11771.5893333333 \tabularnewline
12 & 237217 & 225591.210666667 & 11625.7893333333 \tabularnewline
13 & 235243 & 220825.274666667 & 14417.7253333332 \tabularnewline
14 & 230354 & 217641.941333333 & 12712.0586666667 \tabularnewline
15 & 227184 & 214057.608 & 13126.392 \tabularnewline
16 & 221678 & 210853.941333333 & 10824.0586666667 \tabularnewline
17 & 217142 & 206055.441333333 & 11086.5586666667 \tabularnewline
18 & 219452 & 209925.774666667 & 9526.22533333333 \tabularnewline
19 & 256446 & 242305.941333333 & 14140.0586666667 \tabularnewline
20 & 265845 & 247774.608 & 18070.392 \tabularnewline
21 & 248624 & 232833.941333333 & 15790.0586666667 \tabularnewline
22 & 241114 & 218941.805333333 & 22172.1946666667 \tabularnewline
23 & 229245 & 210303.005333333 & 18941.9946666666 \tabularnewline
24 & 231805 & 214090.805333333 & 17714.1946666666 \tabularnewline
25 & 219277 & 209324.869333333 & 9952.13066666658 \tabularnewline
26 & 219313 & 206141.536 & 13171.464 \tabularnewline
27 & 212610 & 202557.202666667 & 10052.7973333333 \tabularnewline
28 & 214771 & 199353.536 & 15417.464 \tabularnewline
29 & 211142 & 194555.036 & 16586.964 \tabularnewline
30 & 211457 & 198425.369333333 & 13031.6306666667 \tabularnewline
31 & 240048 & 230805.536 & 9242.464 \tabularnewline
32 & 240636 & 236274.202666667 & 4361.79733333332 \tabularnewline
33 & 230580 & 221333.536 & 9246.464 \tabularnewline
34 & 208795 & 207441.4 & 1353.60000000000 \tabularnewline
35 & 197922 & 198802.6 & -880.600000000006 \tabularnewline
36 & 194596 & 202590.4 & -7994.40000000002 \tabularnewline
37 & 194581 & 197824.464 & -3243.46400000007 \tabularnewline
38 & 185686 & 194641.130666667 & -8955.13066666666 \tabularnewline
39 & 178106 & 191056.797333333 & -12950.7973333333 \tabularnewline
40 & 172608 & 187853.130666667 & -15245.1306666667 \tabularnewline
41 & 167302 & 183054.630666667 & -15752.6306666667 \tabularnewline
42 & 168053 & 186924.964 & -18871.9640000000 \tabularnewline
43 & 202300 & 219305.130666667 & -17005.1306666667 \tabularnewline
44 & 202388 & 224773.797333333 & -22385.7973333333 \tabularnewline
45 & 182516 & 209833.130666667 & -27317.1306666667 \tabularnewline
46 & 173476 & 195940.994666667 & -22464.9946666666 \tabularnewline
47 & 166444 & 187302.194666667 & -20858.1946666667 \tabularnewline
48 & 171297 & 191089.994666667 & -19792.9946666667 \tabularnewline
49 & 169701 & 186324.058666667 & -16623.0586666667 \tabularnewline
50 & 164182 & 183140.725333333 & -18958.7253333333 \tabularnewline
51 & 161914 & 179556.392 & -17642.392 \tabularnewline
52 & 159612 & 176352.725333333 & -16740.7253333333 \tabularnewline
53 & 151001 & 171554.225333333 & -20553.2253333333 \tabularnewline
54 & 158114 & 175424.558666667 & -17310.5586666666 \tabularnewline
55 & 186530 & 207804.725333333 & -21274.7253333333 \tabularnewline
56 & 187069 & 213273.392 & -26204.392 \tabularnewline
57 & 174330 & 198332.725333333 & -24002.7253333333 \tabularnewline
58 & 169362 & 184440.589333333 & -15078.5893333333 \tabularnewline
59 & 166827 & 175801.789333333 & -8974.78933333332 \tabularnewline
60 & 178037 & 179589.589333333 & -1552.58933333334 \tabularnewline
61 & 186412 & 174823.653333333 & 11588.3466666666 \tabularnewline
62 & 189226 & 171640.32 & 17585.6800000000 \tabularnewline
63 & 191563 & 168055.986666667 & 23507.0133333334 \tabularnewline
64 & 188906 & 164852.32 & 24053.68 \tabularnewline
65 & 186005 & 160053.82 & 25951.18 \tabularnewline
66 & 195309 & 163924.153333333 & 31384.8466666667 \tabularnewline
67 & 223532 & 196304.32 & 27227.6800000000 \tabularnewline
68 & 226899 & 201772.986666667 & 25126.0133333333 \tabularnewline
69 & 214126 & 186832.32 & 27293.6800000000 \tabularnewline
\hline
\end{tabular}
%Source: https://freestatistics.org/blog/index.php?pk=63276&T=4

[TABLE]
[ROW][C]Multiple Linear Regression - Actuals, Interpolation, and Residuals[/C][/ROW]
[ROW][C]Time or Index[/C][C]Actuals[/C][C]InterpolationForecast[/C][C]ResidualsPrediction Error[/C][/ROW]
[ROW][C]1[/C][C]216234[/C][C]232325.680000000[/C][C]-16091.6799999996[/C][/ROW]
[ROW][C]2[/C][C]213587[/C][C]229142.346666667[/C][C]-15555.3466666667[/C][/ROW]
[ROW][C]3[/C][C]209465[/C][C]225558.013333333[/C][C]-16093.0133333334[/C][/ROW]
[ROW][C]4[/C][C]204045[/C][C]222354.346666667[/C][C]-18309.3466666667[/C][/ROW]
[ROW][C]5[/C][C]200237[/C][C]217555.846666667[/C][C]-17318.8466666666[/C][/ROW]
[ROW][C]6[/C][C]203666[/C][C]221426.18[/C][C]-17760.1800000000[/C][/ROW]
[ROW][C]7[/C][C]241476[/C][C]253806.346666667[/C][C]-12330.3466666667[/C][/ROW]
[ROW][C]8[/C][C]260307[/C][C]259275.013333333[/C][C]1031.98666666669[/C][/ROW]
[ROW][C]9[/C][C]243324[/C][C]244334.346666667[/C][C]-1010.34666666669[/C][/ROW]
[ROW][C]10[/C][C]244460[/C][C]230442.210666667[/C][C]14017.7893333333[/C][/ROW]
[ROW][C]11[/C][C]233575[/C][C]221803.410666667[/C][C]11771.5893333333[/C][/ROW]
[ROW][C]12[/C][C]237217[/C][C]225591.210666667[/C][C]11625.7893333333[/C][/ROW]
[ROW][C]13[/C][C]235243[/C][C]220825.274666667[/C][C]14417.7253333332[/C][/ROW]
[ROW][C]14[/C][C]230354[/C][C]217641.941333333[/C][C]12712.0586666667[/C][/ROW]
[ROW][C]15[/C][C]227184[/C][C]214057.608[/C][C]13126.392[/C][/ROW]
[ROW][C]16[/C][C]221678[/C][C]210853.941333333[/C][C]10824.0586666667[/C][/ROW]
[ROW][C]17[/C][C]217142[/C][C]206055.441333333[/C][C]11086.5586666667[/C][/ROW]
[ROW][C]18[/C][C]219452[/C][C]209925.774666667[/C][C]9526.22533333333[/C][/ROW]
[ROW][C]19[/C][C]256446[/C][C]242305.941333333[/C][C]14140.0586666667[/C][/ROW]
[ROW][C]20[/C][C]265845[/C][C]247774.608[/C][C]18070.392[/C][/ROW]
[ROW][C]21[/C][C]248624[/C][C]232833.941333333[/C][C]15790.0586666667[/C][/ROW]
[ROW][C]22[/C][C]241114[/C][C]218941.805333333[/C][C]22172.1946666667[/C][/ROW]
[ROW][C]23[/C][C]229245[/C][C]210303.005333333[/C][C]18941.9946666666[/C][/ROW]
[ROW][C]24[/C][C]231805[/C][C]214090.805333333[/C][C]17714.1946666666[/C][/ROW]
[ROW][C]25[/C][C]219277[/C][C]209324.869333333[/C][C]9952.13066666658[/C][/ROW]
[ROW][C]26[/C][C]219313[/C][C]206141.536[/C][C]13171.464[/C][/ROW]
[ROW][C]27[/C][C]212610[/C][C]202557.202666667[/C][C]10052.7973333333[/C][/ROW]
[ROW][C]28[/C][C]214771[/C][C]199353.536[/C][C]15417.464[/C][/ROW]
[ROW][C]29[/C][C]211142[/C][C]194555.036[/C][C]16586.964[/C][/ROW]
[ROW][C]30[/C][C]211457[/C][C]198425.369333333[/C][C]13031.6306666667[/C][/ROW]
[ROW][C]31[/C][C]240048[/C][C]230805.536[/C][C]9242.464[/C][/ROW]
[ROW][C]32[/C][C]240636[/C][C]236274.202666667[/C][C]4361.79733333332[/C][/ROW]
[ROW][C]33[/C][C]230580[/C][C]221333.536[/C][C]9246.464[/C][/ROW]
[ROW][C]34[/C][C]208795[/C][C]207441.4[/C][C]1353.60000000000[/C][/ROW]
[ROW][C]35[/C][C]197922[/C][C]198802.6[/C][C]-880.600000000006[/C][/ROW]
[ROW][C]36[/C][C]194596[/C][C]202590.4[/C][C]-7994.40000000002[/C][/ROW]
[ROW][C]37[/C][C]194581[/C][C]197824.464[/C][C]-3243.46400000007[/C][/ROW]
[ROW][C]38[/C][C]185686[/C][C]194641.130666667[/C][C]-8955.13066666666[/C][/ROW]
[ROW][C]39[/C][C]178106[/C][C]191056.797333333[/C][C]-12950.7973333333[/C][/ROW]
[ROW][C]40[/C][C]172608[/C][C]187853.130666667[/C][C]-15245.1306666667[/C][/ROW]
[ROW][C]41[/C][C]167302[/C][C]183054.630666667[/C][C]-15752.6306666667[/C][/ROW]
[ROW][C]42[/C][C]168053[/C][C]186924.964[/C][C]-18871.9640000000[/C][/ROW]
[ROW][C]43[/C][C]202300[/C][C]219305.130666667[/C][C]-17005.1306666667[/C][/ROW]
[ROW][C]44[/C][C]202388[/C][C]224773.797333333[/C][C]-22385.7973333333[/C][/ROW]
[ROW][C]45[/C][C]182516[/C][C]209833.130666667[/C][C]-27317.1306666667[/C][/ROW]
[ROW][C]46[/C][C]173476[/C][C]195940.994666667[/C][C]-22464.9946666666[/C][/ROW]
[ROW][C]47[/C][C]166444[/C][C]187302.194666667[/C][C]-20858.1946666667[/C][/ROW]
[ROW][C]48[/C][C]171297[/C][C]191089.994666667[/C][C]-19792.9946666667[/C][/ROW]
[ROW][C]49[/C][C]169701[/C][C]186324.058666667[/C][C]-16623.0586666667[/C][/ROW]
[ROW][C]50[/C][C]164182[/C][C]183140.725333333[/C][C]-18958.7253333333[/C][/ROW]
[ROW][C]51[/C][C]161914[/C][C]179556.392[/C][C]-17642.392[/C][/ROW]
[ROW][C]52[/C][C]159612[/C][C]176352.725333333[/C][C]-16740.7253333333[/C][/ROW]
[ROW][C]53[/C][C]151001[/C][C]171554.225333333[/C][C]-20553.2253333333[/C][/ROW]
[ROW][C]54[/C][C]158114[/C][C]175424.558666667[/C][C]-17310.5586666666[/C][/ROW]
[ROW][C]55[/C][C]186530[/C][C]207804.725333333[/C][C]-21274.7253333333[/C][/ROW]
[ROW][C]56[/C][C]187069[/C][C]213273.392[/C][C]-26204.392[/C][/ROW]
[ROW][C]57[/C][C]174330[/C][C]198332.725333333[/C][C]-24002.7253333333[/C][/ROW]
[ROW][C]58[/C][C]169362[/C][C]184440.589333333[/C][C]-15078.5893333333[/C][/ROW]
[ROW][C]59[/C][C]166827[/C][C]175801.789333333[/C][C]-8974.78933333332[/C][/ROW]
[ROW][C]60[/C][C]178037[/C][C]179589.589333333[/C][C]-1552.58933333334[/C][/ROW]
[ROW][C]61[/C][C]186412[/C][C]174823.653333333[/C][C]11588.3466666666[/C][/ROW]
[ROW][C]62[/C][C]189226[/C][C]171640.32[/C][C]17585.6800000000[/C][/ROW]
[ROW][C]63[/C][C]191563[/C][C]168055.986666667[/C][C]23507.0133333334[/C][/ROW]
[ROW][C]64[/C][C]188906[/C][C]164852.32[/C][C]24053.68[/C][/ROW]
[ROW][C]65[/C][C]186005[/C][C]160053.82[/C][C]25951.18[/C][/ROW]
[ROW][C]66[/C][C]195309[/C][C]163924.153333333[/C][C]31384.8466666667[/C][/ROW]
[ROW][C]67[/C][C]223532[/C][C]196304.32[/C][C]27227.6800000000[/C][/ROW]
[ROW][C]68[/C][C]226899[/C][C]201772.986666667[/C][C]25126.0133333333[/C][/ROW]
[ROW][C]69[/C][C]214126[/C][C]186832.32[/C][C]27293.6800000000[/C][/ROW]
[/TABLE]
Source: https://freestatistics.org/blog/index.php?pk=63276&T=4

Globally Unique Identifier (entire table): ba.freestatistics.org/blog/index.php?pk=63276&T=4

As an alternative you can also use a QR Code:  

The GUIDs for individual cells are displayed in the table below:

Multiple Linear Regression - Actuals, Interpolation, and Residuals
Time or IndexActualsInterpolationForecastResidualsPrediction Error
1216234232325.680000000-16091.6799999996
2213587229142.346666667-15555.3466666667
3209465225558.013333333-16093.0133333334
4204045222354.346666667-18309.3466666667
5200237217555.846666667-17318.8466666666
6203666221426.18-17760.1800000000
7241476253806.346666667-12330.3466666667
8260307259275.0133333331031.98666666669
9243324244334.346666667-1010.34666666669
10244460230442.21066666714017.7893333333
11233575221803.41066666711771.5893333333
12237217225591.21066666711625.7893333333
13235243220825.27466666714417.7253333332
14230354217641.94133333312712.0586666667
15227184214057.60813126.392
16221678210853.94133333310824.0586666667
17217142206055.44133333311086.5586666667
18219452209925.7746666679526.22533333333
19256446242305.94133333314140.0586666667
20265845247774.60818070.392
21248624232833.94133333315790.0586666667
22241114218941.80533333322172.1946666667
23229245210303.00533333318941.9946666666
24231805214090.80533333317714.1946666666
25219277209324.8693333339952.13066666658
26219313206141.53613171.464
27212610202557.20266666710052.7973333333
28214771199353.53615417.464
29211142194555.03616586.964
30211457198425.36933333313031.6306666667
31240048230805.5369242.464
32240636236274.2026666674361.79733333332
33230580221333.5369246.464
34208795207441.41353.60000000000
35197922198802.6-880.600000000006
36194596202590.4-7994.40000000002
37194581197824.464-3243.46400000007
38185686194641.130666667-8955.13066666666
39178106191056.797333333-12950.7973333333
40172608187853.130666667-15245.1306666667
41167302183054.630666667-15752.6306666667
42168053186924.964-18871.9640000000
43202300219305.130666667-17005.1306666667
44202388224773.797333333-22385.7973333333
45182516209833.130666667-27317.1306666667
46173476195940.994666667-22464.9946666666
47166444187302.194666667-20858.1946666667
48171297191089.994666667-19792.9946666667
49169701186324.058666667-16623.0586666667
50164182183140.725333333-18958.7253333333
51161914179556.392-17642.392
52159612176352.725333333-16740.7253333333
53151001171554.225333333-20553.2253333333
54158114175424.558666667-17310.5586666666
55186530207804.725333333-21274.7253333333
56187069213273.392-26204.392
57174330198332.725333333-24002.7253333333
58169362184440.589333333-15078.5893333333
59166827175801.789333333-8974.78933333332
60178037179589.589333333-1552.58933333334
61186412174823.65333333311588.3466666666
62189226171640.3217585.6800000000
63191563168055.98666666723507.0133333334
64188906164852.3224053.68
65186005160053.8225951.18
66195309163924.15333333331384.8466666667
67223532196304.3227227.6800000000
68226899201772.98666666725126.0133333333
69214126186832.3227293.6800000000


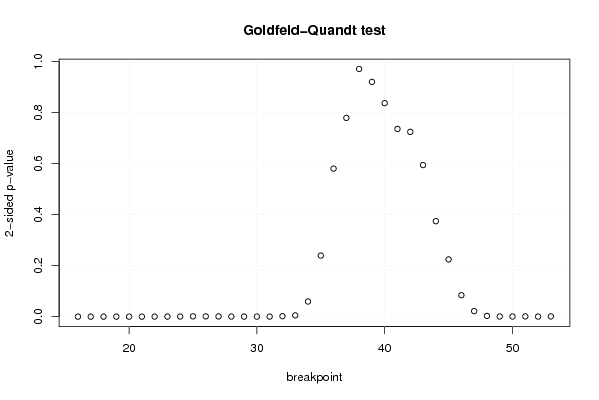
Goldfeld-Quandt test for Heteroskedasticity
p-valuesAlternative Hypothesis
breakpoint indexgreater2-sidedless
164.81719072650606e-059.63438145301211e-050.999951828092735
171.92620033663612e-063.85240067327224e-060.999998073799663
182.37716964781009e-074.75433929562018e-070.999999762283035
194.40947225369467e-088.81894450738934e-080.999999955905277
209.89883520438864e-061.97976704087773e-050.999990101164796
211.18608325443965e-052.37216650887929e-050.999988139167456
228.7311053019765e-050.000174622106039530.99991268894698
230.0001777017880750520.0003554035761501040.999822298211925
240.0002581335235681030.0005162670471362070.999741866476432
250.0006295134909145680.001259026981829140.999370486509085
260.0005067115847841050.001013423169568210.999493288415216
270.0004340744663724670.0008681489327449350.999565925533628
280.0002346499425165380.0004692998850330750.999765350057483
290.0001420488575388330.0002840977150776660.999857951142461
309.03053700711777e-050.0001806107401423550.999909694629929
310.0001201429459318690.0002402858918637390.999879857054068
320.0008335224015716820.001667044803143360.999166477598428
330.002485849008306830.004971698016613670.997514150991693
340.02968107407467780.05936214814935570.970318925925322
350.1197978914199570.2395957828399150.880202108580043
360.2901968367510970.5803936735021950.709803163248903
370.3895809883256210.7791619766512420.610419011674379
380.4855359418293830.9710718836587670.514464058170617
390.5397751391711150.920449721657770.460224860828885
400.5814769913339730.8370460173320550.418523008666027
410.632043683816230.7359126323675390.367956316183769
420.6377658019145180.7244683961709630.362234198085482
430.7029009322753210.5941981354493580.297099067724679
440.8128652130540160.3742695738919680.187134786945984
450.8877915726042050.2244168547915910.112208427395795
460.9579895015625970.08402099687480640.0420104984374032
470.9892156422873670.02156871542526600.0107843577126330
480.998489680528520.003020638942958330.00151031947147916
490.999673715794950.0006525684100986780.000326284205049339
500.9997448593151680.0005102813696642090.000255140684832104
510.999485756374180.001028487251638920.000514243625819461
520.9998420979407940.0003158041184118080.000157902059205904
530.9994771730309870.00104565393802580.0005228269690129

\begin{tabular}{lllllllll}
\hline
Goldfeld-Quandt test for Heteroskedasticity \tabularnewline
p-values & Alternative Hypothesis \tabularnewline
breakpoint index & greater & 2-sided & less \tabularnewline
16 & 4.81719072650606e-05 & 9.63438145301211e-05 & 0.999951828092735 \tabularnewline
17 & 1.92620033663612e-06 & 3.85240067327224e-06 & 0.999998073799663 \tabularnewline
18 & 2.37716964781009e-07 & 4.75433929562018e-07 & 0.999999762283035 \tabularnewline
19 & 4.40947225369467e-08 & 8.81894450738934e-08 & 0.999999955905277 \tabularnewline
20 & 9.89883520438864e-06 & 1.97976704087773e-05 & 0.999990101164796 \tabularnewline
21 & 1.18608325443965e-05 & 2.37216650887929e-05 & 0.999988139167456 \tabularnewline
22 & 8.7311053019765e-05 & 0.00017462210603953 & 0.99991268894698 \tabularnewline
23 & 0.000177701788075052 & 0.000355403576150104 & 0.999822298211925 \tabularnewline
24 & 0.000258133523568103 & 0.000516267047136207 & 0.999741866476432 \tabularnewline
25 & 0.000629513490914568 & 0.00125902698182914 & 0.999370486509085 \tabularnewline
26 & 0.000506711584784105 & 0.00101342316956821 & 0.999493288415216 \tabularnewline
27 & 0.000434074466372467 & 0.000868148932744935 & 0.999565925533628 \tabularnewline
28 & 0.000234649942516538 & 0.000469299885033075 & 0.999765350057483 \tabularnewline
29 & 0.000142048857538833 & 0.000284097715077666 & 0.999857951142461 \tabularnewline
30 & 9.03053700711777e-05 & 0.000180610740142355 & 0.999909694629929 \tabularnewline
31 & 0.000120142945931869 & 0.000240285891863739 & 0.999879857054068 \tabularnewline
32 & 0.000833522401571682 & 0.00166704480314336 & 0.999166477598428 \tabularnewline
33 & 0.00248584900830683 & 0.00497169801661367 & 0.997514150991693 \tabularnewline
34 & 0.0296810740746778 & 0.0593621481493557 & 0.970318925925322 \tabularnewline
35 & 0.119797891419957 & 0.239595782839915 & 0.880202108580043 \tabularnewline
36 & 0.290196836751097 & 0.580393673502195 & 0.709803163248903 \tabularnewline
37 & 0.389580988325621 & 0.779161976651242 & 0.610419011674379 \tabularnewline
38 & 0.485535941829383 & 0.971071883658767 & 0.514464058170617 \tabularnewline
39 & 0.539775139171115 & 0.92044972165777 & 0.460224860828885 \tabularnewline
40 & 0.581476991333973 & 0.837046017332055 & 0.418523008666027 \tabularnewline
41 & 0.63204368381623 & 0.735912632367539 & 0.367956316183769 \tabularnewline
42 & 0.637765801914518 & 0.724468396170963 & 0.362234198085482 \tabularnewline
43 & 0.702900932275321 & 0.594198135449358 & 0.297099067724679 \tabularnewline
44 & 0.812865213054016 & 0.374269573891968 & 0.187134786945984 \tabularnewline
45 & 0.887791572604205 & 0.224416854791591 & 0.112208427395795 \tabularnewline
46 & 0.957989501562597 & 0.0840209968748064 & 0.0420104984374032 \tabularnewline
47 & 0.989215642287367 & 0.0215687154252660 & 0.0107843577126330 \tabularnewline
48 & 0.99848968052852 & 0.00302063894295833 & 0.00151031947147916 \tabularnewline
49 & 0.99967371579495 & 0.000652568410098678 & 0.000326284205049339 \tabularnewline
50 & 0.999744859315168 & 0.000510281369664209 & 0.000255140684832104 \tabularnewline
51 & 0.99948575637418 & 0.00102848725163892 & 0.000514243625819461 \tabularnewline
52 & 0.999842097940794 & 0.000315804118411808 & 0.000157902059205904 \tabularnewline
53 & 0.999477173030987 & 0.0010456539380258 & 0.0005228269690129 \tabularnewline
\hline
\end{tabular}
%Source: https://freestatistics.org/blog/index.php?pk=63276&T=5

[TABLE]
[ROW][C]Goldfeld-Quandt test for Heteroskedasticity[/C][/ROW]
[ROW][C]p-values[/C][C]Alternative Hypothesis[/C][/ROW]
[ROW][C]breakpoint index[/C][C]greater[/C][C]2-sided[/C][C]less[/C][/ROW]
[ROW][C]16[/C][C]4.81719072650606e-05[/C][C]9.63438145301211e-05[/C][C]0.999951828092735[/C][/ROW]
[ROW][C]17[/C][C]1.92620033663612e-06[/C][C]3.85240067327224e-06[/C][C]0.999998073799663[/C][/ROW]
[ROW][C]18[/C][C]2.37716964781009e-07[/C][C]4.75433929562018e-07[/C][C]0.999999762283035[/C][/ROW]
[ROW][C]19[/C][C]4.40947225369467e-08[/C][C]8.81894450738934e-08[/C][C]0.999999955905277[/C][/ROW]
[ROW][C]20[/C][C]9.89883520438864e-06[/C][C]1.97976704087773e-05[/C][C]0.999990101164796[/C][/ROW]
[ROW][C]21[/C][C]1.18608325443965e-05[/C][C]2.37216650887929e-05[/C][C]0.999988139167456[/C][/ROW]
[ROW][C]22[/C][C]8.7311053019765e-05[/C][C]0.00017462210603953[/C][C]0.99991268894698[/C][/ROW]
[ROW][C]23[/C][C]0.000177701788075052[/C][C]0.000355403576150104[/C][C]0.999822298211925[/C][/ROW]
[ROW][C]24[/C][C]0.000258133523568103[/C][C]0.000516267047136207[/C][C]0.999741866476432[/C][/ROW]
[ROW][C]25[/C][C]0.000629513490914568[/C][C]0.00125902698182914[/C][C]0.999370486509085[/C][/ROW]
[ROW][C]26[/C][C]0.000506711584784105[/C][C]0.00101342316956821[/C][C]0.999493288415216[/C][/ROW]
[ROW][C]27[/C][C]0.000434074466372467[/C][C]0.000868148932744935[/C][C]0.999565925533628[/C][/ROW]
[ROW][C]28[/C][C]0.000234649942516538[/C][C]0.000469299885033075[/C][C]0.999765350057483[/C][/ROW]
[ROW][C]29[/C][C]0.000142048857538833[/C][C]0.000284097715077666[/C][C]0.999857951142461[/C][/ROW]
[ROW][C]30[/C][C]9.03053700711777e-05[/C][C]0.000180610740142355[/C][C]0.999909694629929[/C][/ROW]
[ROW][C]31[/C][C]0.000120142945931869[/C][C]0.000240285891863739[/C][C]0.999879857054068[/C][/ROW]
[ROW][C]32[/C][C]0.000833522401571682[/C][C]0.00166704480314336[/C][C]0.999166477598428[/C][/ROW]
[ROW][C]33[/C][C]0.00248584900830683[/C][C]0.00497169801661367[/C][C]0.997514150991693[/C][/ROW]
[ROW][C]34[/C][C]0.0296810740746778[/C][C]0.0593621481493557[/C][C]0.970318925925322[/C][/ROW]
[ROW][C]35[/C][C]0.119797891419957[/C][C]0.239595782839915[/C][C]0.880202108580043[/C][/ROW]
[ROW][C]36[/C][C]0.290196836751097[/C][C]0.580393673502195[/C][C]0.709803163248903[/C][/ROW]
[ROW][C]37[/C][C]0.389580988325621[/C][C]0.779161976651242[/C][C]0.610419011674379[/C][/ROW]
[ROW][C]38[/C][C]0.485535941829383[/C][C]0.971071883658767[/C][C]0.514464058170617[/C][/ROW]
[ROW][C]39[/C][C]0.539775139171115[/C][C]0.92044972165777[/C][C]0.460224860828885[/C][/ROW]
[ROW][C]40[/C][C]0.581476991333973[/C][C]0.837046017332055[/C][C]0.418523008666027[/C][/ROW]
[ROW][C]41[/C][C]0.63204368381623[/C][C]0.735912632367539[/C][C]0.367956316183769[/C][/ROW]
[ROW][C]42[/C][C]0.637765801914518[/C][C]0.724468396170963[/C][C]0.362234198085482[/C][/ROW]
[ROW][C]43[/C][C]0.702900932275321[/C][C]0.594198135449358[/C][C]0.297099067724679[/C][/ROW]
[ROW][C]44[/C][C]0.812865213054016[/C][C]0.374269573891968[/C][C]0.187134786945984[/C][/ROW]
[ROW][C]45[/C][C]0.887791572604205[/C][C]0.224416854791591[/C][C]0.112208427395795[/C][/ROW]
[ROW][C]46[/C][C]0.957989501562597[/C][C]0.0840209968748064[/C][C]0.0420104984374032[/C][/ROW]
[ROW][C]47[/C][C]0.989215642287367[/C][C]0.0215687154252660[/C][C]0.0107843577126330[/C][/ROW]
[ROW][C]48[/C][C]0.99848968052852[/C][C]0.00302063894295833[/C][C]0.00151031947147916[/C][/ROW]
[ROW][C]49[/C][C]0.99967371579495[/C][C]0.000652568410098678[/C][C]0.000326284205049339[/C][/ROW]
[ROW][C]50[/C][C]0.999744859315168[/C][C]0.000510281369664209[/C][C]0.000255140684832104[/C][/ROW]
[ROW][C]51[/C][C]0.99948575637418[/C][C]0.00102848725163892[/C][C]0.000514243625819461[/C][/ROW]
[ROW][C]52[/C][C]0.999842097940794[/C][C]0.000315804118411808[/C][C]0.000157902059205904[/C][/ROW]
[ROW][C]53[/C][C]0.999477173030987[/C][C]0.0010456539380258[/C][C]0.0005228269690129[/C][/ROW]
[/TABLE]
Source: https://freestatistics.org/blog/index.php?pk=63276&T=5

Globally Unique Identifier (entire table): ba.freestatistics.org/blog/index.php?pk=63276&T=5

As an alternative you can also use a QR Code:  

The GUIDs for individual cells are displayed in the table below:

Goldfeld-Quandt test for Heteroskedasticity
p-valuesAlternative Hypothesis
breakpoint indexgreater2-sidedless
164.81719072650606e-059.63438145301211e-050.999951828092735
171.92620033663612e-063.85240067327224e-060.999998073799663
182.37716964781009e-074.75433929562018e-070.999999762283035
194.40947225369467e-088.81894450738934e-080.999999955905277
209.89883520438864e-061.97976704087773e-050.999990101164796
211.18608325443965e-052.37216650887929e-050.999988139167456
228.7311053019765e-050.000174622106039530.99991268894698
230.0001777017880750520.0003554035761501040.999822298211925
240.0002581335235681030.0005162670471362070.999741866476432
250.0006295134909145680.001259026981829140.999370486509085
260.0005067115847841050.001013423169568210.999493288415216
270.0004340744663724670.0008681489327449350.999565925533628
280.0002346499425165380.0004692998850330750.999765350057483
290.0001420488575388330.0002840977150776660.999857951142461
309.03053700711777e-050.0001806107401423550.999909694629929
310.0001201429459318690.0002402858918637390.999879857054068
320.0008335224015716820.001667044803143360.999166477598428
330.002485849008306830.004971698016613670.997514150991693
340.02968107407467780.05936214814935570.970318925925322
350.1197978914199570.2395957828399150.880202108580043
360.2901968367510970.5803936735021950.709803163248903
370.3895809883256210.7791619766512420.610419011674379
380.4855359418293830.9710718836587670.514464058170617
390.5397751391711150.920449721657770.460224860828885
400.5814769913339730.8370460173320550.418523008666027
410.632043683816230.7359126323675390.367956316183769
420.6377658019145180.7244683961709630.362234198085482
430.7029009322753210.5941981354493580.297099067724679
440.8128652130540160.3742695738919680.187134786945984
450.8877915726042050.2244168547915910.112208427395795
460.9579895015625970.08402099687480640.0420104984374032
470.9892156422873670.02156871542526600.0107843577126330
480.998489680528520.003020638942958330.00151031947147916
490.999673715794950.0006525684100986780.000326284205049339
500.9997448593151680.0005102813696642090.000255140684832104
510.999485756374180.001028487251638920.000514243625819461
520.9998420979407940.0003158041184118080.000157902059205904
530.9994771730309870.00104565393802580.0005228269690129


Meta Analysis of Goldfeld-Quandt test for Heteroskedasticity
Description# significant tests% significant testsOK/NOK
1% type I error level240.631578947368421NOK
5% type I error level250.657894736842105NOK
10% type I error level270.710526315789474NOK

\begin{tabular}{lllllllll}
\hline
Meta Analysis of Goldfeld-Quandt test for Heteroskedasticity \tabularnewline
Description & # significant tests & % significant tests & OK/NOK \tabularnewline
1% type I error level & 24 & 0.631578947368421 & NOK \tabularnewline
5% type I error level & 25 & 0.657894736842105 & NOK \tabularnewline
10% type I error level & 27 & 0.710526315789474 & NOK \tabularnewline
\hline
\end{tabular}
%Source: https://freestatistics.org/blog/index.php?pk=63276&T=6

[TABLE]
[ROW][C]Meta Analysis of Goldfeld-Quandt test for Heteroskedasticity[/C][/ROW]
[ROW][C]Description[/C][C]# significant tests[/C][C]% significant tests[/C][C]OK/NOK[/C][/ROW]
[ROW][C]1% type I error level[/C][C]24[/C][C]0.631578947368421[/C][C]NOK[/C][/ROW]
[ROW][C]5% type I error level[/C][C]25[/C][C]0.657894736842105[/C][C]NOK[/C][/ROW]
[ROW][C]10% type I error level[/C][C]27[/C][C]0.710526315789474[/C][C]NOK[/C][/ROW]
[/TABLE]
Source: https://freestatistics.org/blog/index.php?pk=63276&T=6

Globally Unique Identifier (entire table): ba.freestatistics.org/blog/index.php?pk=63276&T=6

As an alternative you can also use a QR Code:  

The GUIDs for individual cells are displayed in the table below:

Meta Analysis of Goldfeld-Quandt test for Heteroskedasticity
Description# significant tests% significant testsOK/NOK
1% type I error level240.631578947368421NOK
5% type I error level250.657894736842105NOK
10% type I error level270.710526315789474NOK


Parameters (Session):
par1 = 1 ; par2 = Include Monthly Dummies ; par3 = Linear Trend ;
Parameters (R input):
par1 = 1 ; par2 = Include Monthly Dummies ; par3 = Linear Trend ;
R code (references can be found in the software module):
library(lattice)
library(lmtest)
n25 <- 25 #minimum number of obs. for Goldfeld-Quandt test
par1 <- as.numeric(par1)
x <- t(y)
k <- length(x[1,])
n <- length(x[,1])
x1 <- cbind(x[,par1], x[,1:k!=par1])
mycolnames <- c(colnames(x)[par1], colnames(x)[1:k!=par1])
colnames(x1) <- mycolnames #colnames(x)[par1]
x <- x1
if (par3 == 'First Differences'){
x2 <- array(0, dim=c(n-1,k), dimnames=list(1:(n-1), paste('(1-B)',colnames(x),sep='')))
for (i in 1:n-1) {
for (j in 1:k) {
x2[i,j] <- x[i+1,j] - x[i,j]
}
}
x <- x2
}
if (par2 == 'Include Monthly Dummies'){
x2 <- array(0, dim=c(n,11), dimnames=list(1:n, paste('M', seq(1:11), sep ='')))
for (i in 1:11){
x2[seq(i,n,12),i] <- 1
}
x <- cbind(x, x2)
}
if (par2 == 'Include Quarterly Dummies'){
x2 <- array(0, dim=c(n,3), dimnames=list(1:n, paste('Q', seq(1:3), sep ='')))
for (i in 1:3){
x2[seq(i,n,4),i] <- 1
}
x <- cbind(x, x2)
}
k <- length(x[1,])
if (par3 == 'Linear Trend'){
x <- cbind(x, c(1:n))
colnames(x)[k+1] <- 't'
}
x
k <- length(x[1,])
df <- as.data.frame(x)
(mylm <- lm(df))
(mysum <- summary(mylm))
if (n > n25) {
kp3 <- k + 3
nmkm3 <- n - k - 3
gqarr <- array(NA, dim=c(nmkm3-kp3+1,3))
numgqtests <- 0
numsignificant1 <- 0
numsignificant5 <- 0
numsignificant10 <- 0
for (mypoint in kp3:nmkm3) {
j <- 0
numgqtests <- numgqtests + 1
for (myalt in c('greater', 'two.sided', 'less')) {
j <- j + 1
gqarr[mypoint-kp3+1,j] <- gqtest(mylm, point=mypoint, alternative=myalt)$p.value
}
if (gqarr[mypoint-kp3+1,2] < 0.01) numsignificant1 <- numsignificant1 + 1
if (gqarr[mypoint-kp3+1,2] < 0.05) numsignificant5 <- numsignificant5 + 1
if (gqarr[mypoint-kp3+1,2] < 0.10) numsignificant10 <- numsignificant10 + 1
}
gqarr
}
bitmap(file='test0.png')
plot(x[,1], type='l', main='Actuals and Interpolation', ylab='value of Actuals and Interpolation (dots)', xlab='time or index')
points(x[,1]-mysum$resid)
grid()
dev.off()
bitmap(file='test1.png')
plot(mysum$resid, type='b', pch=19, main='Residuals', ylab='value of Residuals', xlab='time or index')
grid()
dev.off()
bitmap(file='test2.png')
hist(mysum$resid, main='Residual Histogram', xlab='values of Residuals')
grid()
dev.off()
bitmap(file='test3.png')
densityplot(~mysum$resid,col='black',main='Residual Density Plot', xlab='values of Residuals')
dev.off()
bitmap(file='test4.png')
qqnorm(mysum$resid, main='Residual Normal Q-Q Plot')
qqline(mysum$resid)
grid()
dev.off()
(myerror <- as.ts(mysum$resid))
bitmap(file='test5.png')
dum <- cbind(lag(myerror,k=1),myerror)
dum
dum1 <- dum[2:length(myerror),]
dum1
z <- as.data.frame(dum1)
z
plot(z,main=paste('Residual Lag plot, lowess, and regression line'), ylab='values of Residuals', xlab='lagged values of Residuals')
lines(lowess(z))
abline(lm(z))
grid()
dev.off()
bitmap(file='test6.png')
acf(mysum$resid, lag.max=length(mysum$resid)/2, main='Residual Autocorrelation Function')
grid()
dev.off()
bitmap(file='test7.png')
pacf(mysum$resid, lag.max=length(mysum$resid)/2, main='Residual Partial Autocorrelation Function')
grid()
dev.off()
bitmap(file='test8.png')
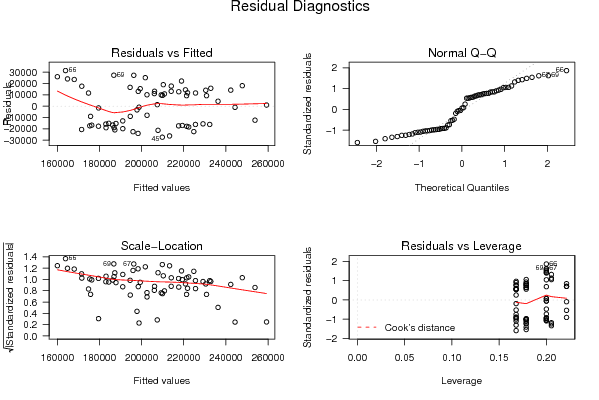
opar <- par(mfrow = c(2,2), oma = c(0, 0, 1.1, 0))
plot(mylm, las = 1, sub='Residual Diagnostics')
par(opar)
dev.off()
if (n > n25) {
bitmap(file='test9.png')
plot(kp3:nmkm3,gqarr[,2], main='Goldfeld-Quandt test',ylab='2-sided p-value',xlab='breakpoint')
grid()
dev.off()
}
load(file='createtable')
a<-table.start()
a<-table.row.start(a)
a<-table.element(a, 'Multiple Linear Regression - Estimated Regression Equation', 1, TRUE)
a<-table.row.end(a)
myeq <- colnames(x)[1]
myeq <- paste(myeq, '[t] = ', sep='')
for (i in 1:k){
if (mysum$coefficients[i,1] > 0) myeq <- paste(myeq, '+', '')
myeq <- paste(myeq, mysum$coefficients[i,1], sep=' ')
if (rownames(mysum$coefficients)[i] != '(Intercept)') {
myeq <- paste(myeq, rownames(mysum$coefficients)[i], sep='')
if (rownames(mysum$coefficients)[i] != 't') myeq <- paste(myeq, '[t]', sep='')
}
}
myeq <- paste(myeq, ' + e[t]')
a<-table.row.start(a)
a<-table.element(a, myeq)
a<-table.row.end(a)
a<-table.end(a)
table.save(a,file='mytable1.tab')
a<-table.start()
a<-table.row.start(a)
a<-table.element(a,hyperlink('ols1.htm','Multiple Linear Regression - Ordinary Least Squares',''), 6, TRUE)
a<-table.row.end(a)
a<-table.row.start(a)
a<-table.element(a,'Variable',header=TRUE)
a<-table.element(a,'Parameter',header=TRUE)
a<-table.element(a,'S.D.',header=TRUE)
a<-table.element(a,'T-STAT
H0: parameter = 0',header=TRUE)
a<-table.element(a,'2-tail p-value',header=TRUE)
a<-table.element(a,'1-tail p-value',header=TRUE)
a<-table.row.end(a)
for (i in 1:k){
a<-table.row.start(a)
a<-table.element(a,rownames(mysum$coefficients)[i],header=TRUE)
a<-table.element(a,mysum$coefficients[i,1])
a<-table.element(a, round(mysum$coefficients[i,2],6))
a<-table.element(a, round(mysum$coefficients[i,3],4))
a<-table.element(a, round(mysum$coefficients[i,4],6))
a<-table.element(a, round(mysum$coefficients[i,4]/2,6))
a<-table.row.end(a)
}
a<-table.end(a)
table.save(a,file='mytable2.tab')
a<-table.start()
a<-table.row.start(a)
a<-table.element(a, 'Multiple Linear Regression - Regression Statistics', 2, TRUE)
a<-table.row.end(a)
a<-table.row.start(a)
a<-table.element(a, 'Multiple R',1,TRUE)
a<-table.element(a, sqrt(mysum$r.squared))
a<-table.row.end(a)
a<-table.row.start(a)
a<-table.element(a, 'R-squared',1,TRUE)
a<-table.element(a, mysum$r.squared)
a<-table.row.end(a)
a<-table.row.start(a)
a<-table.element(a, 'Adjusted R-squared',1,TRUE)
a<-table.element(a, mysum$adj.r.squared)
a<-table.row.end(a)
a<-table.row.start(a)
a<-table.element(a, 'F-TEST (value)',1,TRUE)
a<-table.element(a, mysum$fstatistic[1])
a<-table.row.end(a)
a<-table.row.start(a)
a<-table.element(a, 'F-TEST (DF numerator)',1,TRUE)
a<-table.element(a, mysum$fstatistic[2])
a<-table.row.end(a)
a<-table.row.start(a)
a<-table.element(a, 'F-TEST (DF denominator)',1,TRUE)
a<-table.element(a, mysum$fstatistic[3])
a<-table.row.end(a)
a<-table.row.start(a)
a<-table.element(a, 'p-value',1,TRUE)
a<-table.element(a, 1-pf(mysum$fstatistic[1],mysum$fstatistic[2],mysum$fstatistic[3]))
a<-table.row.end(a)
a<-table.row.start(a)
a<-table.element(a, 'Multiple Linear Regression - Residual Statistics', 2, TRUE)
a<-table.row.end(a)
a<-table.row.start(a)
a<-table.element(a, 'Residual Standard Deviation',1,TRUE)
a<-table.element(a, mysum$sigma)
a<-table.row.end(a)
a<-table.row.start(a)
a<-table.element(a, 'Sum Squared Residuals',1,TRUE)
a<-table.element(a, sum(myerror*myerror))
a<-table.row.end(a)
a<-table.end(a)
table.save(a,file='mytable3.tab')
a<-table.start()
a<-table.row.start(a)
a<-table.element(a, 'Multiple Linear Regression - Actuals, Interpolation, and Residuals', 4, TRUE)
a<-table.row.end(a)
a<-table.row.start(a)
a<-table.element(a, 'Time or Index', 1, TRUE)
a<-table.element(a, 'Actuals', 1, TRUE)
a<-table.element(a, 'Interpolation
Forecast', 1, TRUE)
a<-table.element(a, 'Residuals
Prediction Error', 1, TRUE)
a<-table.row.end(a)
for (i in 1:n) {
a<-table.row.start(a)
a<-table.element(a,i, 1, TRUE)
a<-table.element(a,x[i])
a<-table.element(a,x[i]-mysum$resid[i])
a<-table.element(a,mysum$resid[i])
a<-table.row.end(a)
}
a<-table.end(a)
table.save(a,file='mytable4.tab')
if (n > n25) {
a<-table.start()
a<-table.row.start(a)
a<-table.element(a,'Goldfeld-Quandt test for Heteroskedasticity',4,TRUE)
a<-table.row.end(a)
a<-table.row.start(a)
a<-table.element(a,'p-values',header=TRUE)
a<-table.element(a,'Alternative Hypothesis',3,header=TRUE)
a<-table.row.end(a)
a<-table.row.start(a)
a<-table.element(a,'breakpoint index',header=TRUE)
a<-table.element(a,'greater',header=TRUE)
a<-table.element(a,'2-sided',header=TRUE)
a<-table.element(a,'less',header=TRUE)
a<-table.row.end(a)
for (mypoint in kp3:nmkm3) {
a<-table.row.start(a)
a<-table.element(a,mypoint,header=TRUE)
a<-table.element(a,gqarr[mypoint-kp3+1,1])
a<-table.element(a,gqarr[mypoint-kp3+1,2])
a<-table.element(a,gqarr[mypoint-kp3+1,3])
a<-table.row.end(a)
}
a<-table.end(a)
table.save(a,file='mytable5.tab')
a<-table.start()
a<-table.row.start(a)
a<-table.element(a,'Meta Analysis of Goldfeld-Quandt test for Heteroskedasticity',4,TRUE)
a<-table.row.end(a)
a<-table.row.start(a)
a<-table.element(a,'Description',header=TRUE)
a<-table.element(a,'# significant tests',header=TRUE)
a<-table.element(a,'% significant tests',header=TRUE)
a<-table.element(a,'OK/NOK',header=TRUE)
a<-table.row.end(a)
a<-table.row.start(a)
a<-table.element(a,'1% type I error level',header=TRUE)
a<-table.element(a,numsignificant1)
a<-table.element(a,numsignificant1/numgqtests)
if (numsignificant1/numgqtests < 0.01) dum <- 'OK' else dum <- 'NOK'
a<-table.element(a,dum)
a<-table.row.end(a)
a<-table.row.start(a)
a<-table.element(a,'5% type I error level',header=TRUE)
a<-table.element(a,numsignificant5)
a<-table.element(a,numsignificant5/numgqtests)
if (numsignificant5/numgqtests < 0.05) dum <- 'OK' else dum <- 'NOK'
a<-table.element(a,dum)
a<-table.row.end(a)
a<-table.row.start(a)
a<-table.element(a,'10% type I error level',header=TRUE)
a<-table.element(a,numsignificant10)
a<-table.element(a,numsignificant10/numgqtests)
if (numsignificant10/numgqtests < 0.1) dum <- 'OK' else dum <- 'NOK'
a<-table.element(a,dum)
a<-table.row.end(a)
a<-table.end(a)
table.save(a,file='mytable6.tab')
}