Free Statistics
of Irreproducible Research!
Description of Statistical Computation | |||||||||||||||||||||||||||||||||||||||||
|---|---|---|---|---|---|---|---|---|---|---|---|---|---|---|---|---|---|---|---|---|---|---|---|---|---|---|---|---|---|---|---|---|---|---|---|---|---|---|---|---|---|
| Author's title | |||||||||||||||||||||||||||||||||||||||||
| Author | *The author of this computation has been verified* | ||||||||||||||||||||||||||||||||||||||||
| R Software Module | rwasp_univariatedataseries.wasp | ||||||||||||||||||||||||||||||||||||||||
| Title produced by software | Univariate Data Series | ||||||||||||||||||||||||||||||||||||||||
| Date of computation | Fri, 04 Dec 2009 04:37:55 -0700 | ||||||||||||||||||||||||||||||||||||||||
| Cite this page as follows | Statistical Computations at FreeStatistics.org, Office for Research Development and Education, URL https://freestatistics.org/blog/index.php?v=date/2009/Dec/04/t1259927735rxz04d1j7yius4f.htm/, Retrieved Sun, 28 Apr 2024 12:54:05 +0000 | ||||||||||||||||||||||||||||||||||||||||
| Statistical Computations at FreeStatistics.org, Office for Research Development and Education, URL https://freestatistics.org/blog/index.php?pk=63324, Retrieved Sun, 28 Apr 2024 12:54:05 +0000 | |||||||||||||||||||||||||||||||||||||||||
| QR Codes: | |||||||||||||||||||||||||||||||||||||||||
|
| |||||||||||||||||||||||||||||||||||||||||
| Original text written by user: | |||||||||||||||||||||||||||||||||||||||||
| IsPrivate? | No (this computation is public) | ||||||||||||||||||||||||||||||||||||||||
| User-defined keywords | |||||||||||||||||||||||||||||||||||||||||
| Estimated Impact | 116 | ||||||||||||||||||||||||||||||||||||||||
Tree of Dependent Computations | |||||||||||||||||||||||||||||||||||||||||
| Family? (F = Feedback message, R = changed R code, M = changed R Module, P = changed Parameters, D = changed Data) | |||||||||||||||||||||||||||||||||||||||||
| - [Univariate Data Series] [data set] [2008-12-01 19:54:57] [b98453cac15ba1066b407e146608df68] - RMP [ARIMA Backward Selection] [] [2009-11-27 14:53:14] [b98453cac15ba1066b407e146608df68] - D [ARIMA Backward Selection] [backwards arima s...] [2009-12-02 17:38:59] [8b1aef4e7013bd33fbc2a5833375c5f5] - P [ARIMA Backward Selection] [backward arma es...] [2009-12-03 13:27:44] [8b1aef4e7013bd33fbc2a5833375c5f5] - RMPD [Univariate Data Series] [Paper: Werklooshe...] [2009-12-04 11:23:56] [34b80aeb109c116fd63bf2eb7493a276] - PD [Univariate Data Series] [Paper: Inflatie B...] [2009-12-04 11:37:55] [307139c5e328127f586f26d5bcc435d8] [Current] - PD [Univariate Data Series] [Inflatie Belgi�] [2009-12-04 11:57:12] [34b80aeb109c116fd63bf2eb7493a276] - PD [Univariate Data Series] [Industri�le produ...] [2009-12-04 12:03:38] [34b80aeb109c116fd63bf2eb7493a276] | |||||||||||||||||||||||||||||||||||||||||
| Feedback Forum | |||||||||||||||||||||||||||||||||||||||||
Post a new message | |||||||||||||||||||||||||||||||||||||||||
Dataset | |||||||||||||||||||||||||||||||||||||||||
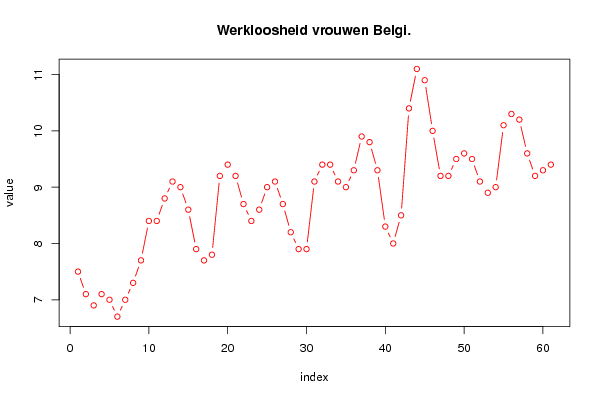
| Dataseries X: | |||||||||||||||||||||||||||||||||||||||||
7.5 7.1 6.9 7.1 7 6.7 7 7.3 7.7 8.4 8.4 8.8 9.1 9 8.6 7.9 7.7 7.8 9.2 9.4 9.2 8.7 8.4 8.6 9 9.1 8.7 8.2 7.9 7.9 9.1 9.4 9.4 9.1 9 9.3 9.9 9.8 9.3 8.3 8 8.5 10.4 11.1 10.9 10 9.2 9.2 9.5 9.6 9.5 9.1 8.9 9 10.1 10.3 10.2 9.6 9.2 9.3 9.4 | |||||||||||||||||||||||||||||||||||||||||
Tables (Output of Computation) | |||||||||||||||||||||||||||||||||||||||||
| |||||||||||||||||||||||||||||||||||||||||
Figures (Output of Computation) | |||||||||||||||||||||||||||||||||||||||||
Input Parameters & R Code | |||||||||||||||||||||||||||||||||||||||||
| Parameters (Session): | |||||||||||||||||||||||||||||||||||||||||
| par1 = Werkloosheid vrouwen Belgi� ; par2 = http://www.nbb.be/belgostat/GlobalDispatcher?TARGET=/TreeviewLinker&rowID=1211&prop=treeview&action=close&Lang=N#1211 ; | |||||||||||||||||||||||||||||||||||||||||
| Parameters (R input): | |||||||||||||||||||||||||||||||||||||||||
| par1 = Werkloosheid vrouwen Belgi� ; par2 = http://www.nbb.be/belgostat/GlobalDispatcher?TARGET=/TreeviewLinker&rowID=1211&prop=treeview&action=close&Lang=N#1211 ; par3 = ; | |||||||||||||||||||||||||||||||||||||||||
| R code (references can be found in the software module): | |||||||||||||||||||||||||||||||||||||||||
bitmap(file='test1.png') | |||||||||||||||||||||||||||||||||||||||||