Free Statistics

of Irreproducible Research!

Author's title

Author*The author of this computation has been verified*
R Software Modulerwasp_exponentialsmoothing.wasp
Title produced by softwareExponential Smoothing
Date of computationFri, 04 Dec 2009 04:59:12 -0700
Cite this page as followsStatistical Computations at FreeStatistics.org, Office for Research Development and Education, URL https://freestatistics.org/blog/index.php?v=date/2009/Dec/04/t1259928012wvemfjci7ka8nbb.htm/, Retrieved Sun, 28 Apr 2024 11:27:49 +0000
Statistical Computations at FreeStatistics.org, Office for Research Development and Education, URL https://freestatistics.org/blog/index.php?pk=63336, Retrieved Sun, 28 Apr 2024 11:27:49 +0000
QR Codes:

Original text written by user:
IsPrivate?No (this computation is public)
User-defined keywords
Estimated Impact86
Family? (F = Feedback message, R = changed R code, M = changed R Module, P = changed Parameters, D = changed Data)
-     [Univariate Data Series] [data set] [2008-12-01 19:54:57] [b98453cac15ba1066b407e146608df68]
- RMP   [Exponential Smoothing] [] [2009-11-27 15:04:36] [b98453cac15ba1066b407e146608df68]
-    D      [Exponential Smoothing] [workshop 9] [2009-12-04 11:59:12] [6198946fb53eb5eb18db46bb758f7fde] [Current]
Feedback Forum

Post a new message
Dataseries X:
0.6348
0.634
0.62915
0.62168
0.61328
0.6089
0.60857
0.62672
0.62291
0.62393
0.61838
0.62012
0.61659
0.6116
0.61573
0.61407
0.62823
0.64405
0.6387
0.63633
0.63059
0.62994
0.63709
0.64217
0.65711
0.66977
0.68255
0.68902
0.71322
0.70224
0.70045
0.69919
0.69693
0.69763
0.69278
0.70196
0.69215
0.6769
0.67124
0.66532
0.67157
0.66428
0.66576
0.66942
0.6813
0.69144
0.69862
0.695
0.69867
0.68968
0.69233
0.68293
0.68399
0.66895
0.68756
0.68527
0.6776
0.68137
0.67933
0.67922


Summary of computational transaction
Raw Inputview raw input (R code)
Raw Outputview raw output of R engine
Computing time1 seconds
R Server'Gwilym Jenkins' @ 72.249.127.135

\begin{tabular}{lllllllll}
\hline
Summary of computational transaction \tabularnewline
Raw Input & view raw input (R code)  \tabularnewline
Raw Output & view raw output of R engine  \tabularnewline
Computing time & 1 seconds \tabularnewline
R Server & 'Gwilym Jenkins' @ 72.249.127.135 \tabularnewline
\hline
\end{tabular}
%Source: https://freestatistics.org/blog/index.php?pk=63336&T=0

[TABLE]
[ROW][C]Summary of computational transaction[/C][/ROW]
[ROW][C]Raw Input[/C][C]view raw input (R code) [/C][/ROW]
[ROW][C]Raw Output[/C][C]view raw output of R engine [/C][/ROW]
[ROW][C]Computing time[/C][C]1 seconds[/C][/ROW]
[ROW][C]R Server[/C][C]'Gwilym Jenkins' @ 72.249.127.135[/C][/ROW]
[/TABLE]
Source: https://freestatistics.org/blog/index.php?pk=63336&T=0

Globally Unique Identifier (entire table): ba.freestatistics.org/blog/index.php?pk=63336&T=0

As an alternative you can also use a QR Code:  

The GUIDs for individual cells are displayed in the table below:

Summary of computational transaction
Raw Inputview raw input (R code)
Raw Outputview raw output of R engine
Computing time1 seconds
R Server'Gwilym Jenkins' @ 72.249.127.135


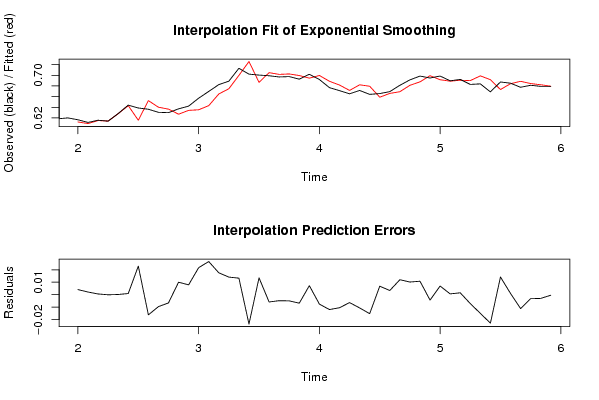
Estimated Parameters of Exponential Smoothing
ParameterValue
alpha0.66962132181715
beta0
gamma1

\begin{tabular}{lllllllll}
\hline
Estimated Parameters of Exponential Smoothing \tabularnewline
Parameter & Value \tabularnewline
alpha & 0.66962132181715 \tabularnewline
beta & 0 \tabularnewline
gamma & 1 \tabularnewline
\hline
\end{tabular}
%Source: https://freestatistics.org/blog/index.php?pk=63336&T=1

[TABLE]
[ROW][C]Estimated Parameters of Exponential Smoothing[/C][/ROW]
[ROW][C]Parameter[/C][C]Value[/C][/ROW]
[ROW][C]alpha[/C][C]0.66962132181715[/C][/ROW]
[ROW][C]beta[/C][C]0[/C][/ROW]
[ROW][C]gamma[/C][C]1[/C][/ROW]
[/TABLE]
Source: https://freestatistics.org/blog/index.php?pk=63336&T=1

Globally Unique Identifier (entire table): ba.freestatistics.org/blog/index.php?pk=63336&T=1

As an alternative you can also use a QR Code:  

The GUIDs for individual cells are displayed in the table below:

Estimated Parameters of Exponential Smoothing
ParameterValue
alpha0.66962132181715
beta0
gamma1


Interpolation Forecasts of Exponential Smoothing
tObservedFittedResiduals
130.616590.6124975009721890.00409249902781061
140.61160.6094778529537740.00212214704622571
150.615730.6151582273487060.000571772651294267
160.614070.614161909656626-9.1909656625977e-05
170.628230.62808601512280.000143984877200243
180.644050.6431368538542590.00091314614574145
190.63870.6157118160601380.0229881839398619
200.636330.652568374770993-0.0162383747709927
210.630590.640196745644255-0.00960674564425479
220.629940.636568216833885-0.00662821683388526
230.637090.6270535176546550.0100364823453450
240.642170.6342721909358440.0078978090641565
250.657110.6353811248611230.021728875138877
260.669770.6431264109400540.026643589059946
270.682550.6649488831037420.0176011168962579
280.689020.6748948689523470.0141251310476532
290.713220.6999283214535810.0132916785464188
300.702240.725875451407125-0.0236354514071250
310.700450.6868884376184670.0135615623815333
320.699190.70505955943636-0.00586955943635947
330.696930.701769731679134-0.00483973167913399
340.697630.702615579996933-0.00498557999693339
350.692780.699619890729639-0.00683989072963931
360.701960.6947104784078690.00724952159213132
370.692150.699737775508837-0.00758777550883682
380.67690.688879878046408-0.0119798780464085
390.671240.681751226894113-0.0105112268941132
400.665320.671704469979952-0.00638446997995168
410.671570.682223139164555-0.0106531391645552
420.664280.679558931514768-0.0152789315147677
430.665760.6589505191081310.00680948089186895
440.669420.6660746952025170.00334530479748285
450.68130.6692829778789840.0120170221210159
460.691440.681271253541480.0101687464585204
470.698620.6878113604641390.0108086395358614
480.6950.699369288308636-0.00436928830863603
490.698670.6917401560229610.00692984397703855
500.689680.6890562416716740.000623758328326174
510.692330.6908254459327940.00150455406720562
520.682930.690097840493339-0.00716784049333918
530.683990.69901943908038-0.0150294390803799
540.668950.691871173926501-0.0229211739265007
550.687560.6733545980810970.0142054019189030
560.685270.6842974029987450.000972597001255071
570.67760.688802500116735-0.0112025001167348
580.681370.684598615739255-0.00322861573925481
590.679330.682354259245283-0.00302425924528293
600.679220.679669736423884-0.000449736423883906

\begin{tabular}{lllllllll}
\hline
Interpolation Forecasts of Exponential Smoothing \tabularnewline
t & Observed & Fitted & Residuals \tabularnewline
13 & 0.61659 & 0.612497500972189 & 0.00409249902781061 \tabularnewline
14 & 0.6116 & 0.609477852953774 & 0.00212214704622571 \tabularnewline
15 & 0.61573 & 0.615158227348706 & 0.000571772651294267 \tabularnewline
16 & 0.61407 & 0.614161909656626 & -9.1909656625977e-05 \tabularnewline
17 & 0.62823 & 0.6280860151228 & 0.000143984877200243 \tabularnewline
18 & 0.64405 & 0.643136853854259 & 0.00091314614574145 \tabularnewline
19 & 0.6387 & 0.615711816060138 & 0.0229881839398619 \tabularnewline
20 & 0.63633 & 0.652568374770993 & -0.0162383747709927 \tabularnewline
21 & 0.63059 & 0.640196745644255 & -0.00960674564425479 \tabularnewline
22 & 0.62994 & 0.636568216833885 & -0.00662821683388526 \tabularnewline
23 & 0.63709 & 0.627053517654655 & 0.0100364823453450 \tabularnewline
24 & 0.64217 & 0.634272190935844 & 0.0078978090641565 \tabularnewline
25 & 0.65711 & 0.635381124861123 & 0.021728875138877 \tabularnewline
26 & 0.66977 & 0.643126410940054 & 0.026643589059946 \tabularnewline
27 & 0.68255 & 0.664948883103742 & 0.0176011168962579 \tabularnewline
28 & 0.68902 & 0.674894868952347 & 0.0141251310476532 \tabularnewline
29 & 0.71322 & 0.699928321453581 & 0.0132916785464188 \tabularnewline
30 & 0.70224 & 0.725875451407125 & -0.0236354514071250 \tabularnewline
31 & 0.70045 & 0.686888437618467 & 0.0135615623815333 \tabularnewline
32 & 0.69919 & 0.70505955943636 & -0.00586955943635947 \tabularnewline
33 & 0.69693 & 0.701769731679134 & -0.00483973167913399 \tabularnewline
34 & 0.69763 & 0.702615579996933 & -0.00498557999693339 \tabularnewline
35 & 0.69278 & 0.699619890729639 & -0.00683989072963931 \tabularnewline
36 & 0.70196 & 0.694710478407869 & 0.00724952159213132 \tabularnewline
37 & 0.69215 & 0.699737775508837 & -0.00758777550883682 \tabularnewline
38 & 0.6769 & 0.688879878046408 & -0.0119798780464085 \tabularnewline
39 & 0.67124 & 0.681751226894113 & -0.0105112268941132 \tabularnewline
40 & 0.66532 & 0.671704469979952 & -0.00638446997995168 \tabularnewline
41 & 0.67157 & 0.682223139164555 & -0.0106531391645552 \tabularnewline
42 & 0.66428 & 0.679558931514768 & -0.0152789315147677 \tabularnewline
43 & 0.66576 & 0.658950519108131 & 0.00680948089186895 \tabularnewline
44 & 0.66942 & 0.666074695202517 & 0.00334530479748285 \tabularnewline
45 & 0.6813 & 0.669282977878984 & 0.0120170221210159 \tabularnewline
46 & 0.69144 & 0.68127125354148 & 0.0101687464585204 \tabularnewline
47 & 0.69862 & 0.687811360464139 & 0.0108086395358614 \tabularnewline
48 & 0.695 & 0.699369288308636 & -0.00436928830863603 \tabularnewline
49 & 0.69867 & 0.691740156022961 & 0.00692984397703855 \tabularnewline
50 & 0.68968 & 0.689056241671674 & 0.000623758328326174 \tabularnewline
51 & 0.69233 & 0.690825445932794 & 0.00150455406720562 \tabularnewline
52 & 0.68293 & 0.690097840493339 & -0.00716784049333918 \tabularnewline
53 & 0.68399 & 0.69901943908038 & -0.0150294390803799 \tabularnewline
54 & 0.66895 & 0.691871173926501 & -0.0229211739265007 \tabularnewline
55 & 0.68756 & 0.673354598081097 & 0.0142054019189030 \tabularnewline
56 & 0.68527 & 0.684297402998745 & 0.000972597001255071 \tabularnewline
57 & 0.6776 & 0.688802500116735 & -0.0112025001167348 \tabularnewline
58 & 0.68137 & 0.684598615739255 & -0.00322861573925481 \tabularnewline
59 & 0.67933 & 0.682354259245283 & -0.00302425924528293 \tabularnewline
60 & 0.67922 & 0.679669736423884 & -0.000449736423883906 \tabularnewline
\hline
\end{tabular}
%Source: https://freestatistics.org/blog/index.php?pk=63336&T=2

[TABLE]
[ROW][C]Interpolation Forecasts of Exponential Smoothing[/C][/ROW]
[ROW][C]t[/C][C]Observed[/C][C]Fitted[/C][C]Residuals[/C][/ROW]
[ROW][C]13[/C][C]0.61659[/C][C]0.612497500972189[/C][C]0.00409249902781061[/C][/ROW]
[ROW][C]14[/C][C]0.6116[/C][C]0.609477852953774[/C][C]0.00212214704622571[/C][/ROW]
[ROW][C]15[/C][C]0.61573[/C][C]0.615158227348706[/C][C]0.000571772651294267[/C][/ROW]
[ROW][C]16[/C][C]0.61407[/C][C]0.614161909656626[/C][C]-9.1909656625977e-05[/C][/ROW]
[ROW][C]17[/C][C]0.62823[/C][C]0.6280860151228[/C][C]0.000143984877200243[/C][/ROW]
[ROW][C]18[/C][C]0.64405[/C][C]0.643136853854259[/C][C]0.00091314614574145[/C][/ROW]
[ROW][C]19[/C][C]0.6387[/C][C]0.615711816060138[/C][C]0.0229881839398619[/C][/ROW]
[ROW][C]20[/C][C]0.63633[/C][C]0.652568374770993[/C][C]-0.0162383747709927[/C][/ROW]
[ROW][C]21[/C][C]0.63059[/C][C]0.640196745644255[/C][C]-0.00960674564425479[/C][/ROW]
[ROW][C]22[/C][C]0.62994[/C][C]0.636568216833885[/C][C]-0.00662821683388526[/C][/ROW]
[ROW][C]23[/C][C]0.63709[/C][C]0.627053517654655[/C][C]0.0100364823453450[/C][/ROW]
[ROW][C]24[/C][C]0.64217[/C][C]0.634272190935844[/C][C]0.0078978090641565[/C][/ROW]
[ROW][C]25[/C][C]0.65711[/C][C]0.635381124861123[/C][C]0.021728875138877[/C][/ROW]
[ROW][C]26[/C][C]0.66977[/C][C]0.643126410940054[/C][C]0.026643589059946[/C][/ROW]
[ROW][C]27[/C][C]0.68255[/C][C]0.664948883103742[/C][C]0.0176011168962579[/C][/ROW]
[ROW][C]28[/C][C]0.68902[/C][C]0.674894868952347[/C][C]0.0141251310476532[/C][/ROW]
[ROW][C]29[/C][C]0.71322[/C][C]0.699928321453581[/C][C]0.0132916785464188[/C][/ROW]
[ROW][C]30[/C][C]0.70224[/C][C]0.725875451407125[/C][C]-0.0236354514071250[/C][/ROW]
[ROW][C]31[/C][C]0.70045[/C][C]0.686888437618467[/C][C]0.0135615623815333[/C][/ROW]
[ROW][C]32[/C][C]0.69919[/C][C]0.70505955943636[/C][C]-0.00586955943635947[/C][/ROW]
[ROW][C]33[/C][C]0.69693[/C][C]0.701769731679134[/C][C]-0.00483973167913399[/C][/ROW]
[ROW][C]34[/C][C]0.69763[/C][C]0.702615579996933[/C][C]-0.00498557999693339[/C][/ROW]
[ROW][C]35[/C][C]0.69278[/C][C]0.699619890729639[/C][C]-0.00683989072963931[/C][/ROW]
[ROW][C]36[/C][C]0.70196[/C][C]0.694710478407869[/C][C]0.00724952159213132[/C][/ROW]
[ROW][C]37[/C][C]0.69215[/C][C]0.699737775508837[/C][C]-0.00758777550883682[/C][/ROW]
[ROW][C]38[/C][C]0.6769[/C][C]0.688879878046408[/C][C]-0.0119798780464085[/C][/ROW]
[ROW][C]39[/C][C]0.67124[/C][C]0.681751226894113[/C][C]-0.0105112268941132[/C][/ROW]
[ROW][C]40[/C][C]0.66532[/C][C]0.671704469979952[/C][C]-0.00638446997995168[/C][/ROW]
[ROW][C]41[/C][C]0.67157[/C][C]0.682223139164555[/C][C]-0.0106531391645552[/C][/ROW]
[ROW][C]42[/C][C]0.66428[/C][C]0.679558931514768[/C][C]-0.0152789315147677[/C][/ROW]
[ROW][C]43[/C][C]0.66576[/C][C]0.658950519108131[/C][C]0.00680948089186895[/C][/ROW]
[ROW][C]44[/C][C]0.66942[/C][C]0.666074695202517[/C][C]0.00334530479748285[/C][/ROW]
[ROW][C]45[/C][C]0.6813[/C][C]0.669282977878984[/C][C]0.0120170221210159[/C][/ROW]
[ROW][C]46[/C][C]0.69144[/C][C]0.68127125354148[/C][C]0.0101687464585204[/C][/ROW]
[ROW][C]47[/C][C]0.69862[/C][C]0.687811360464139[/C][C]0.0108086395358614[/C][/ROW]
[ROW][C]48[/C][C]0.695[/C][C]0.699369288308636[/C][C]-0.00436928830863603[/C][/ROW]
[ROW][C]49[/C][C]0.69867[/C][C]0.691740156022961[/C][C]0.00692984397703855[/C][/ROW]
[ROW][C]50[/C][C]0.68968[/C][C]0.689056241671674[/C][C]0.000623758328326174[/C][/ROW]
[ROW][C]51[/C][C]0.69233[/C][C]0.690825445932794[/C][C]0.00150455406720562[/C][/ROW]
[ROW][C]52[/C][C]0.68293[/C][C]0.690097840493339[/C][C]-0.00716784049333918[/C][/ROW]
[ROW][C]53[/C][C]0.68399[/C][C]0.69901943908038[/C][C]-0.0150294390803799[/C][/ROW]
[ROW][C]54[/C][C]0.66895[/C][C]0.691871173926501[/C][C]-0.0229211739265007[/C][/ROW]
[ROW][C]55[/C][C]0.68756[/C][C]0.673354598081097[/C][C]0.0142054019189030[/C][/ROW]
[ROW][C]56[/C][C]0.68527[/C][C]0.684297402998745[/C][C]0.000972597001255071[/C][/ROW]
[ROW][C]57[/C][C]0.6776[/C][C]0.688802500116735[/C][C]-0.0112025001167348[/C][/ROW]
[ROW][C]58[/C][C]0.68137[/C][C]0.684598615739255[/C][C]-0.00322861573925481[/C][/ROW]
[ROW][C]59[/C][C]0.67933[/C][C]0.682354259245283[/C][C]-0.00302425924528293[/C][/ROW]
[ROW][C]60[/C][C]0.67922[/C][C]0.679669736423884[/C][C]-0.000449736423883906[/C][/ROW]
[/TABLE]
Source: https://freestatistics.org/blog/index.php?pk=63336&T=2

Globally Unique Identifier (entire table): ba.freestatistics.org/blog/index.php?pk=63336&T=2

As an alternative you can also use a QR Code:  

The GUIDs for individual cells are displayed in the table below:

Interpolation Forecasts of Exponential Smoothing
tObservedFittedResiduals
130.616590.6124975009721890.00409249902781061
140.61160.6094778529537740.00212214704622571
150.615730.6151582273487060.000571772651294267
160.614070.614161909656626-9.1909656625977e-05
170.628230.62808601512280.000143984877200243
180.644050.6431368538542590.00091314614574145
190.63870.6157118160601380.0229881839398619
200.636330.652568374770993-0.0162383747709927
210.630590.640196745644255-0.00960674564425479
220.629940.636568216833885-0.00662821683388526
230.637090.6270535176546550.0100364823453450
240.642170.6342721909358440.0078978090641565
250.657110.6353811248611230.021728875138877
260.669770.6431264109400540.026643589059946
270.682550.6649488831037420.0176011168962579
280.689020.6748948689523470.0141251310476532
290.713220.6999283214535810.0132916785464188
300.702240.725875451407125-0.0236354514071250
310.700450.6868884376184670.0135615623815333
320.699190.70505955943636-0.00586955943635947
330.696930.701769731679134-0.00483973167913399
340.697630.702615579996933-0.00498557999693339
350.692780.699619890729639-0.00683989072963931
360.701960.6947104784078690.00724952159213132
370.692150.699737775508837-0.00758777550883682
380.67690.688879878046408-0.0119798780464085
390.671240.681751226894113-0.0105112268941132
400.665320.671704469979952-0.00638446997995168
410.671570.682223139164555-0.0106531391645552
420.664280.679558931514768-0.0152789315147677
430.665760.6589505191081310.00680948089186895
440.669420.6660746952025170.00334530479748285
450.68130.6692829778789840.0120170221210159
460.691440.681271253541480.0101687464585204
470.698620.6878113604641390.0108086395358614
480.6950.699369288308636-0.00436928830863603
490.698670.6917401560229610.00692984397703855
500.689680.6890562416716740.000623758328326174
510.692330.6908254459327940.00150455406720562
520.682930.690097840493339-0.00716784049333918
530.683990.69901943908038-0.0150294390803799
540.668950.691871173926501-0.0229211739265007
550.687560.6733545980810970.0142054019189030
560.685270.6842974029987450.000972597001255071
570.67760.688802500116735-0.0112025001167348
580.681370.684598615739255-0.00322861573925481
590.679330.682354259245283-0.00302425924528293
600.679220.679669736423884-0.000449736423883906


Extrapolation Forecasts of Exponential Smoothing
tForecast95% Lower Bound95% Upper Bound
610.6784244413199210.6558436308190110.701005251820831
620.6693137700754710.6422607946432020.69636674550774
630.6709321018889880.6399234802470970.70194072353088
640.6664839277424070.6321403050019610.700827550482853
650.6772898340375420.639406541379350.715173126695734
660.6774335461866460.6366737221857490.718193370187543
670.6865695388293880.6427071266353860.73043195102339
680.6836334348937610.637433444366890.729833425420631
690.6834266628907440.6348745145094010.731978811272087
700.6893987928348970.6382411943776640.740556391292131
710.6893705614648640.6360816824161990.742659440513529
720.689551747635884-25.947317825718627.3264213209903

\begin{tabular}{lllllllll}
\hline
Extrapolation Forecasts of Exponential Smoothing \tabularnewline
t & Forecast & 95% Lower Bound & 95% Upper Bound \tabularnewline
61 & 0.678424441319921 & 0.655843630819011 & 0.701005251820831 \tabularnewline
62 & 0.669313770075471 & 0.642260794643202 & 0.69636674550774 \tabularnewline
63 & 0.670932101888988 & 0.639923480247097 & 0.70194072353088 \tabularnewline
64 & 0.666483927742407 & 0.632140305001961 & 0.700827550482853 \tabularnewline
65 & 0.677289834037542 & 0.63940654137935 & 0.715173126695734 \tabularnewline
66 & 0.677433546186646 & 0.636673722185749 & 0.718193370187543 \tabularnewline
67 & 0.686569538829388 & 0.642707126635386 & 0.73043195102339 \tabularnewline
68 & 0.683633434893761 & 0.63743344436689 & 0.729833425420631 \tabularnewline
69 & 0.683426662890744 & 0.634874514509401 & 0.731978811272087 \tabularnewline
70 & 0.689398792834897 & 0.638241194377664 & 0.740556391292131 \tabularnewline
71 & 0.689370561464864 & 0.636081682416199 & 0.742659440513529 \tabularnewline
72 & 0.689551747635884 & -25.9473178257186 & 27.3264213209903 \tabularnewline
\hline
\end{tabular}
%Source: https://freestatistics.org/blog/index.php?pk=63336&T=3

[TABLE]
[ROW][C]Extrapolation Forecasts of Exponential Smoothing[/C][/ROW]
[ROW][C]t[/C][C]Forecast[/C][C]95% Lower Bound[/C][C]95% Upper Bound[/C][/ROW]
[ROW][C]61[/C][C]0.678424441319921[/C][C]0.655843630819011[/C][C]0.701005251820831[/C][/ROW]
[ROW][C]62[/C][C]0.669313770075471[/C][C]0.642260794643202[/C][C]0.69636674550774[/C][/ROW]
[ROW][C]63[/C][C]0.670932101888988[/C][C]0.639923480247097[/C][C]0.70194072353088[/C][/ROW]
[ROW][C]64[/C][C]0.666483927742407[/C][C]0.632140305001961[/C][C]0.700827550482853[/C][/ROW]
[ROW][C]65[/C][C]0.677289834037542[/C][C]0.63940654137935[/C][C]0.715173126695734[/C][/ROW]
[ROW][C]66[/C][C]0.677433546186646[/C][C]0.636673722185749[/C][C]0.718193370187543[/C][/ROW]
[ROW][C]67[/C][C]0.686569538829388[/C][C]0.642707126635386[/C][C]0.73043195102339[/C][/ROW]
[ROW][C]68[/C][C]0.683633434893761[/C][C]0.63743344436689[/C][C]0.729833425420631[/C][/ROW]
[ROW][C]69[/C][C]0.683426662890744[/C][C]0.634874514509401[/C][C]0.731978811272087[/C][/ROW]
[ROW][C]70[/C][C]0.689398792834897[/C][C]0.638241194377664[/C][C]0.740556391292131[/C][/ROW]
[ROW][C]71[/C][C]0.689370561464864[/C][C]0.636081682416199[/C][C]0.742659440513529[/C][/ROW]
[ROW][C]72[/C][C]0.689551747635884[/C][C]-25.9473178257186[/C][C]27.3264213209903[/C][/ROW]
[/TABLE]
Source: https://freestatistics.org/blog/index.php?pk=63336&T=3

Globally Unique Identifier (entire table): ba.freestatistics.org/blog/index.php?pk=63336&T=3

As an alternative you can also use a QR Code:  

The GUIDs for individual cells are displayed in the table below:

Extrapolation Forecasts of Exponential Smoothing
tForecast95% Lower Bound95% Upper Bound
610.6784244413199210.6558436308190110.701005251820831
620.6693137700754710.6422607946432020.69636674550774
630.6709321018889880.6399234802470970.70194072353088
640.6664839277424070.6321403050019610.700827550482853
650.6772898340375420.639406541379350.715173126695734
660.6774335461866460.6366737221857490.718193370187543
670.6865695388293880.6427071266353860.73043195102339
680.6836334348937610.637433444366890.729833425420631
690.6834266628907440.6348745145094010.731978811272087
700.6893987928348970.6382411943776640.740556391292131
710.6893705614648640.6360816824161990.742659440513529
720.689551747635884-25.947317825718627.3264213209903


Parameters (Session):
par1 = 12 ; par2 = Triple ; par3 = multiplicative ;
Parameters (R input):
par1 = 12 ; par2 = Triple ; par3 = multiplicative ;
R code (references can be found in the software module):
par1 <- as.numeric(par1)
if (par2 == 'Single') K <- 1
if (par2 == 'Double') K <- 2
if (par2 == 'Triple') K <- par1
nx <- length(x)
nxmK <- nx - K
x <- ts(x, frequency = par1)
if (par2 == 'Single') fit <- HoltWinters(x, gamma=0, beta=0)
if (par2 == 'Double') fit <- HoltWinters(x, gamma=0)
if (par2 == 'Triple') fit <- HoltWinters(x, seasonal=par3)
fit
myresid <- x - fit$fitted[,'xhat']
bitmap(file='test1.png')
op <- par(mfrow=c(2,1))
plot(fit,ylab='Observed (black) / Fitted (red)',main='Interpolation Fit of Exponential Smoothing')
plot(myresid,ylab='Residuals',main='Interpolation Prediction Errors')
par(op)
dev.off()
bitmap(file='test2.png')
p <- predict(fit, par1, prediction.interval=TRUE)
np <- length(p[,1])
plot(fit,p,ylab='Observed (black) / Fitted (red)',main='Extrapolation Fit of Exponential Smoothing')
dev.off()
bitmap(file='test3.png')
op <- par(mfrow = c(2,2))
acf(as.numeric(myresid),lag.max = nx/2,main='Residual ACF')
spectrum(myresid,main='Residals Periodogram')
cpgram(myresid,main='Residal Cumulative Periodogram')
qqnorm(myresid,main='Residual Normal QQ Plot')
qqline(myresid)
par(op)
dev.off()
load(file='createtable')
a<-table.start()
a<-table.row.start(a)
a<-table.element(a,'Estimated Parameters of Exponential Smoothing',2,TRUE)
a<-table.row.end(a)
a<-table.row.start(a)
a<-table.element(a,'Parameter',header=TRUE)
a<-table.element(a,'Value',header=TRUE)
a<-table.row.end(a)
a<-table.row.start(a)
a<-table.element(a,'alpha',header=TRUE)
a<-table.element(a,fit$alpha)
a<-table.row.end(a)
a<-table.row.start(a)
a<-table.element(a,'beta',header=TRUE)
a<-table.element(a,fit$beta)
a<-table.row.end(a)
a<-table.row.start(a)
a<-table.element(a,'gamma',header=TRUE)
a<-table.element(a,fit$gamma)
a<-table.row.end(a)
a<-table.end(a)
table.save(a,file='mytable.tab')
a<-table.start()
a<-table.row.start(a)
a<-table.element(a,'Interpolation Forecasts of Exponential Smoothing',4,TRUE)
a<-table.row.end(a)
a<-table.row.start(a)
a<-table.element(a,'t',header=TRUE)
a<-table.element(a,'Observed',header=TRUE)
a<-table.element(a,'Fitted',header=TRUE)
a<-table.element(a,'Residuals',header=TRUE)
a<-table.row.end(a)
for (i in 1:nxmK) {
a<-table.row.start(a)
a<-table.element(a,i+K,header=TRUE)
a<-table.element(a,x[i+K])
a<-table.element(a,fit$fitted[i,'xhat'])
a<-table.element(a,myresid[i])
a<-table.row.end(a)
}
a<-table.end(a)
table.save(a,file='mytable1.tab')
a<-table.start()
a<-table.row.start(a)
a<-table.element(a,'Extrapolation Forecasts of Exponential Smoothing',4,TRUE)
a<-table.row.end(a)
a<-table.row.start(a)
a<-table.element(a,'t',header=TRUE)
a<-table.element(a,'Forecast',header=TRUE)
a<-table.element(a,'95% Lower Bound',header=TRUE)
a<-table.element(a,'95% Upper Bound',header=TRUE)
a<-table.row.end(a)
for (i in 1:np) {
a<-table.row.start(a)
a<-table.element(a,nx+i,header=TRUE)
a<-table.element(a,p[i,'fit'])
a<-table.element(a,p[i,'lwr'])
a<-table.element(a,p[i,'upr'])
a<-table.row.end(a)
}
a<-table.end(a)
table.save(a,file='mytable2.tab')