Free Statistics

of Irreproducible Research!

Author's title

Author*The author of this computation has been verified*
R Software Modulerwasp_exponentialsmoothing.wasp
Title produced by softwareExponential Smoothing
Date of computationFri, 04 Dec 2009 05:15:07 -0700
Cite this page as followsStatistical Computations at FreeStatistics.org, Office for Research Development and Education, URL https://freestatistics.org/blog/index.php?v=date/2009/Dec/04/t1259928958haptvd4bitxhx6n.htm/, Retrieved Sun, 28 Apr 2024 12:49:29 +0000
Statistical Computations at FreeStatistics.org, Office for Research Development and Education, URL https://freestatistics.org/blog/index.php?pk=63373, Retrieved Sun, 28 Apr 2024 12:49:29 +0000
QR Codes:

Original text written by user:
IsPrivate?No (this computation is public)
User-defined keywords
Estimated Impact144
Family? (F = Feedback message, R = changed R code, M = changed R Module, P = changed Parameters, D = changed Data)
-     [Univariate Data Series] [data set] [2008-12-01 19:54:57] [b98453cac15ba1066b407e146608df68]
- RMP   [Exponential Smoothing] [] [2009-11-27 15:04:36] [b98453cac15ba1066b407e146608df68]
-   PD    [Exponential Smoothing] [ws 8 Ad hoc forec...] [2009-12-02 20:19:53] [616e2df490b611f6cb7080068870ecbd]
-   PD        [Exponential Smoothing] [Workshop 9] [2009-12-04 12:15:07] [ee8fc1691ecec7724e0ca78f0c288737] [Current]
-   PD          [Exponential Smoothing] [WS9] [2009-12-11 12:54:10] [4fe1472705bb0a32f118ba3ca90ffa8e]
Feedback Forum

Post a new message
Dataseries X:
130
136.7
138.1
139.5
140.4
144.6
151.4
147.9
141.5
143.8
143.6
150.5
150.1
154.9
162.1
176.7
186.6
194.8
196.3
228.8
267.2
237.2
254.7
258.2
257.9
269.6
266.9
269.6
253.9
258.6
274.2
301.5
304.5
285.1
287.7
265.5
264.1
276.1
258.9
239.1
250.1
276.8
297.6
295.4
283
275.8
279.7
254.6
234.6
176.9
148.1
122.7
124.9
121.6
128.4
144.5
151.8
167.1
173.8
203.7
199.8


Summary of computational transaction
Raw Inputview raw input (R code)
Raw Outputview raw output of R engine
Computing time3 seconds
R Server'Gwilym Jenkins' @ 72.249.127.135

\begin{tabular}{lllllllll}
\hline
Summary of computational transaction \tabularnewline
Raw Input & view raw input (R code)  \tabularnewline
Raw Output & view raw output of R engine  \tabularnewline
Computing time & 3 seconds \tabularnewline
R Server & 'Gwilym Jenkins' @ 72.249.127.135 \tabularnewline
\hline
\end{tabular}
%Source: https://freestatistics.org/blog/index.php?pk=63373&T=0

[TABLE]
[ROW][C]Summary of computational transaction[/C][/ROW]
[ROW][C]Raw Input[/C][C]view raw input (R code) [/C][/ROW]
[ROW][C]Raw Output[/C][C]view raw output of R engine [/C][/ROW]
[ROW][C]Computing time[/C][C]3 seconds[/C][/ROW]
[ROW][C]R Server[/C][C]'Gwilym Jenkins' @ 72.249.127.135[/C][/ROW]
[/TABLE]
Source: https://freestatistics.org/blog/index.php?pk=63373&T=0

Globally Unique Identifier (entire table): ba.freestatistics.org/blog/index.php?pk=63373&T=0

As an alternative you can also use a QR Code:  

The GUIDs for individual cells are displayed in the table below:

Summary of computational transaction
Raw Inputview raw input (R code)
Raw Outputview raw output of R engine
Computing time3 seconds
R Server'Gwilym Jenkins' @ 72.249.127.135


Estimated Parameters of Exponential Smoothing
ParameterValue
alpha0.91594433817239
beta0.254681260792864
gamma1

\begin{tabular}{lllllllll}
\hline
Estimated Parameters of Exponential Smoothing \tabularnewline
Parameter & Value \tabularnewline
alpha & 0.91594433817239 \tabularnewline
beta & 0.254681260792864 \tabularnewline
gamma & 1 \tabularnewline
\hline
\end{tabular}
%Source: https://freestatistics.org/blog/index.php?pk=63373&T=1

[TABLE]
[ROW][C]Estimated Parameters of Exponential Smoothing[/C][/ROW]
[ROW][C]Parameter[/C][C]Value[/C][/ROW]
[ROW][C]alpha[/C][C]0.91594433817239[/C][/ROW]
[ROW][C]beta[/C][C]0.254681260792864[/C][/ROW]
[ROW][C]gamma[/C][C]1[/C][/ROW]
[/TABLE]
Source: https://freestatistics.org/blog/index.php?pk=63373&T=1

Globally Unique Identifier (entire table): ba.freestatistics.org/blog/index.php?pk=63373&T=1

As an alternative you can also use a QR Code:  

The GUIDs for individual cells are displayed in the table below:

Estimated Parameters of Exponential Smoothing
ParameterValue
alpha0.91594433817239
beta0.254681260792864
gamma1


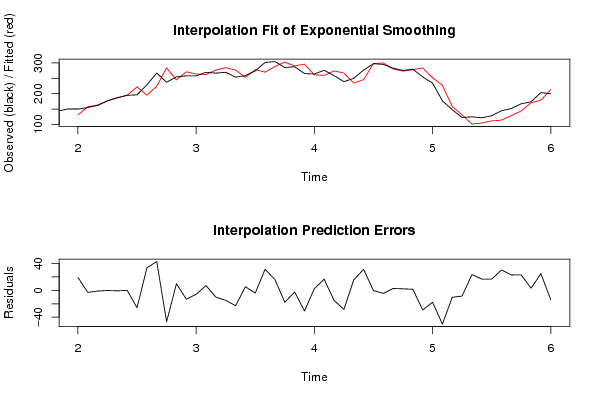
Interpolation Forecasts of Exponential Smoothing
tObservedFittedResiduals
13150.1130.8805847848719.2194152151301
14154.9157.905109673890-3.00510967389044
15162.1163.119940761206-1.01994076120627
16176.7176.837042114557-0.137042114557289
17186.6187.219177521515-0.619177521514899
18194.8194.7363877915690.0636122084314081
19196.3222.232225112377-25.9322251123766
20228.8195.11751715782333.6824828421766
21267.2224.20259410233142.9974058976687
22237.2283.901442079443-46.7014420794433
23254.7244.7895044956329.91049550436773
24258.2271.28539781617-13.0853978161700
25257.9263.814699897086-5.91469989708571
26269.6262.3998148087977.20018519120333
27266.9276.905536256762-10.0055362567618
28269.6284.382714022403-14.7827140224032
29253.9276.767504829663-22.8675048296630
30258.6253.2091972079615.39080279203932
31274.2278.157364936914-3.95736493691419
32301.5270.01184677413331.4881532258671
33304.5288.3297941685516.1702058314501
34285.1302.837171801158-17.7371718011576
35287.7290.070933366641-2.37093336664128
36265.5296.128872327679-30.6288723276792
37264.1261.4499561096002.6500438904003
38276.1259.40542160603016.6945783939705
39258.9273.855365360832-14.9553653608322
40239.1267.417240107409-28.3172401074092
41250.1234.47268399284915.6273160071509
42276.8245.50209411204131.2979058879588
43297.6297.851825910214-0.251825910213597
44295.4299.929471940812-4.52947194081179
45283280.1445643069732.8554356930274
46275.8273.4686885208992.33131147910086
47279.7278.1134499795311.58655002046862
48254.6283.769198230010-29.1691982300104
49234.6252.186511999984-17.586511999984
50176.9227.075627290153-50.1756272901533
51148.1158.405168445699-10.3051684456992
52122.7131.101893376469-8.4018933764694
53124.9101.29293865534123.6070613446595
54121.6104.76782562462816.8321743753722
55128.4111.61479669467216.7852033053279
56144.5114.10681644815330.3931835518466
57151.8128.82379491181322.9762050881868
58167.1143.99362215386223.1063778461379
59173.8170.6139310095883.18606899041225
60203.7178.80198679576624.8980132042344
61199.8213.502594383305-13.7025943833049

\begin{tabular}{lllllllll}
\hline
Interpolation Forecasts of Exponential Smoothing \tabularnewline
t & Observed & Fitted & Residuals \tabularnewline
13 & 150.1 & 130.88058478487 & 19.2194152151301 \tabularnewline
14 & 154.9 & 157.905109673890 & -3.00510967389044 \tabularnewline
15 & 162.1 & 163.119940761206 & -1.01994076120627 \tabularnewline
16 & 176.7 & 176.837042114557 & -0.137042114557289 \tabularnewline
17 & 186.6 & 187.219177521515 & -0.619177521514899 \tabularnewline
18 & 194.8 & 194.736387791569 & 0.0636122084314081 \tabularnewline
19 & 196.3 & 222.232225112377 & -25.9322251123766 \tabularnewline
20 & 228.8 & 195.117517157823 & 33.6824828421766 \tabularnewline
21 & 267.2 & 224.202594102331 & 42.9974058976687 \tabularnewline
22 & 237.2 & 283.901442079443 & -46.7014420794433 \tabularnewline
23 & 254.7 & 244.789504495632 & 9.91049550436773 \tabularnewline
24 & 258.2 & 271.28539781617 & -13.0853978161700 \tabularnewline
25 & 257.9 & 263.814699897086 & -5.91469989708571 \tabularnewline
26 & 269.6 & 262.399814808797 & 7.20018519120333 \tabularnewline
27 & 266.9 & 276.905536256762 & -10.0055362567618 \tabularnewline
28 & 269.6 & 284.382714022403 & -14.7827140224032 \tabularnewline
29 & 253.9 & 276.767504829663 & -22.8675048296630 \tabularnewline
30 & 258.6 & 253.209197207961 & 5.39080279203932 \tabularnewline
31 & 274.2 & 278.157364936914 & -3.95736493691419 \tabularnewline
32 & 301.5 & 270.011846774133 & 31.4881532258671 \tabularnewline
33 & 304.5 & 288.32979416855 & 16.1702058314501 \tabularnewline
34 & 285.1 & 302.837171801158 & -17.7371718011576 \tabularnewline
35 & 287.7 & 290.070933366641 & -2.37093336664128 \tabularnewline
36 & 265.5 & 296.128872327679 & -30.6288723276792 \tabularnewline
37 & 264.1 & 261.449956109600 & 2.6500438904003 \tabularnewline
38 & 276.1 & 259.405421606030 & 16.6945783939705 \tabularnewline
39 & 258.9 & 273.855365360832 & -14.9553653608322 \tabularnewline
40 & 239.1 & 267.417240107409 & -28.3172401074092 \tabularnewline
41 & 250.1 & 234.472683992849 & 15.6273160071509 \tabularnewline
42 & 276.8 & 245.502094112041 & 31.2979058879588 \tabularnewline
43 & 297.6 & 297.851825910214 & -0.251825910213597 \tabularnewline
44 & 295.4 & 299.929471940812 & -4.52947194081179 \tabularnewline
45 & 283 & 280.144564306973 & 2.8554356930274 \tabularnewline
46 & 275.8 & 273.468688520899 & 2.33131147910086 \tabularnewline
47 & 279.7 & 278.113449979531 & 1.58655002046862 \tabularnewline
48 & 254.6 & 283.769198230010 & -29.1691982300104 \tabularnewline
49 & 234.6 & 252.186511999984 & -17.586511999984 \tabularnewline
50 & 176.9 & 227.075627290153 & -50.1756272901533 \tabularnewline
51 & 148.1 & 158.405168445699 & -10.3051684456992 \tabularnewline
52 & 122.7 & 131.101893376469 & -8.4018933764694 \tabularnewline
53 & 124.9 & 101.292938655341 & 23.6070613446595 \tabularnewline
54 & 121.6 & 104.767825624628 & 16.8321743753722 \tabularnewline
55 & 128.4 & 111.614796694672 & 16.7852033053279 \tabularnewline
56 & 144.5 & 114.106816448153 & 30.3931835518466 \tabularnewline
57 & 151.8 & 128.823794911813 & 22.9762050881868 \tabularnewline
58 & 167.1 & 143.993622153862 & 23.1063778461379 \tabularnewline
59 & 173.8 & 170.613931009588 & 3.18606899041225 \tabularnewline
60 & 203.7 & 178.801986795766 & 24.8980132042344 \tabularnewline
61 & 199.8 & 213.502594383305 & -13.7025943833049 \tabularnewline
\hline
\end{tabular}
%Source: https://freestatistics.org/blog/index.php?pk=63373&T=2

[TABLE]
[ROW][C]Interpolation Forecasts of Exponential Smoothing[/C][/ROW]
[ROW][C]t[/C][C]Observed[/C][C]Fitted[/C][C]Residuals[/C][/ROW]
[ROW][C]13[/C][C]150.1[/C][C]130.88058478487[/C][C]19.2194152151301[/C][/ROW]
[ROW][C]14[/C][C]154.9[/C][C]157.905109673890[/C][C]-3.00510967389044[/C][/ROW]
[ROW][C]15[/C][C]162.1[/C][C]163.119940761206[/C][C]-1.01994076120627[/C][/ROW]
[ROW][C]16[/C][C]176.7[/C][C]176.837042114557[/C][C]-0.137042114557289[/C][/ROW]
[ROW][C]17[/C][C]186.6[/C][C]187.219177521515[/C][C]-0.619177521514899[/C][/ROW]
[ROW][C]18[/C][C]194.8[/C][C]194.736387791569[/C][C]0.0636122084314081[/C][/ROW]
[ROW][C]19[/C][C]196.3[/C][C]222.232225112377[/C][C]-25.9322251123766[/C][/ROW]
[ROW][C]20[/C][C]228.8[/C][C]195.117517157823[/C][C]33.6824828421766[/C][/ROW]
[ROW][C]21[/C][C]267.2[/C][C]224.202594102331[/C][C]42.9974058976687[/C][/ROW]
[ROW][C]22[/C][C]237.2[/C][C]283.901442079443[/C][C]-46.7014420794433[/C][/ROW]
[ROW][C]23[/C][C]254.7[/C][C]244.789504495632[/C][C]9.91049550436773[/C][/ROW]
[ROW][C]24[/C][C]258.2[/C][C]271.28539781617[/C][C]-13.0853978161700[/C][/ROW]
[ROW][C]25[/C][C]257.9[/C][C]263.814699897086[/C][C]-5.91469989708571[/C][/ROW]
[ROW][C]26[/C][C]269.6[/C][C]262.399814808797[/C][C]7.20018519120333[/C][/ROW]
[ROW][C]27[/C][C]266.9[/C][C]276.905536256762[/C][C]-10.0055362567618[/C][/ROW]
[ROW][C]28[/C][C]269.6[/C][C]284.382714022403[/C][C]-14.7827140224032[/C][/ROW]
[ROW][C]29[/C][C]253.9[/C][C]276.767504829663[/C][C]-22.8675048296630[/C][/ROW]
[ROW][C]30[/C][C]258.6[/C][C]253.209197207961[/C][C]5.39080279203932[/C][/ROW]
[ROW][C]31[/C][C]274.2[/C][C]278.157364936914[/C][C]-3.95736493691419[/C][/ROW]
[ROW][C]32[/C][C]301.5[/C][C]270.011846774133[/C][C]31.4881532258671[/C][/ROW]
[ROW][C]33[/C][C]304.5[/C][C]288.32979416855[/C][C]16.1702058314501[/C][/ROW]
[ROW][C]34[/C][C]285.1[/C][C]302.837171801158[/C][C]-17.7371718011576[/C][/ROW]
[ROW][C]35[/C][C]287.7[/C][C]290.070933366641[/C][C]-2.37093336664128[/C][/ROW]
[ROW][C]36[/C][C]265.5[/C][C]296.128872327679[/C][C]-30.6288723276792[/C][/ROW]
[ROW][C]37[/C][C]264.1[/C][C]261.449956109600[/C][C]2.6500438904003[/C][/ROW]
[ROW][C]38[/C][C]276.1[/C][C]259.405421606030[/C][C]16.6945783939705[/C][/ROW]
[ROW][C]39[/C][C]258.9[/C][C]273.855365360832[/C][C]-14.9553653608322[/C][/ROW]
[ROW][C]40[/C][C]239.1[/C][C]267.417240107409[/C][C]-28.3172401074092[/C][/ROW]
[ROW][C]41[/C][C]250.1[/C][C]234.472683992849[/C][C]15.6273160071509[/C][/ROW]
[ROW][C]42[/C][C]276.8[/C][C]245.502094112041[/C][C]31.2979058879588[/C][/ROW]
[ROW][C]43[/C][C]297.6[/C][C]297.851825910214[/C][C]-0.251825910213597[/C][/ROW]
[ROW][C]44[/C][C]295.4[/C][C]299.929471940812[/C][C]-4.52947194081179[/C][/ROW]
[ROW][C]45[/C][C]283[/C][C]280.144564306973[/C][C]2.8554356930274[/C][/ROW]
[ROW][C]46[/C][C]275.8[/C][C]273.468688520899[/C][C]2.33131147910086[/C][/ROW]
[ROW][C]47[/C][C]279.7[/C][C]278.113449979531[/C][C]1.58655002046862[/C][/ROW]
[ROW][C]48[/C][C]254.6[/C][C]283.769198230010[/C][C]-29.1691982300104[/C][/ROW]
[ROW][C]49[/C][C]234.6[/C][C]252.186511999984[/C][C]-17.586511999984[/C][/ROW]
[ROW][C]50[/C][C]176.9[/C][C]227.075627290153[/C][C]-50.1756272901533[/C][/ROW]
[ROW][C]51[/C][C]148.1[/C][C]158.405168445699[/C][C]-10.3051684456992[/C][/ROW]
[ROW][C]52[/C][C]122.7[/C][C]131.101893376469[/C][C]-8.4018933764694[/C][/ROW]
[ROW][C]53[/C][C]124.9[/C][C]101.292938655341[/C][C]23.6070613446595[/C][/ROW]
[ROW][C]54[/C][C]121.6[/C][C]104.767825624628[/C][C]16.8321743753722[/C][/ROW]
[ROW][C]55[/C][C]128.4[/C][C]111.614796694672[/C][C]16.7852033053279[/C][/ROW]
[ROW][C]56[/C][C]144.5[/C][C]114.106816448153[/C][C]30.3931835518466[/C][/ROW]
[ROW][C]57[/C][C]151.8[/C][C]128.823794911813[/C][C]22.9762050881868[/C][/ROW]
[ROW][C]58[/C][C]167.1[/C][C]143.993622153862[/C][C]23.1063778461379[/C][/ROW]
[ROW][C]59[/C][C]173.8[/C][C]170.613931009588[/C][C]3.18606899041225[/C][/ROW]
[ROW][C]60[/C][C]203.7[/C][C]178.801986795766[/C][C]24.8980132042344[/C][/ROW]
[ROW][C]61[/C][C]199.8[/C][C]213.502594383305[/C][C]-13.7025943833049[/C][/ROW]
[/TABLE]
Source: https://freestatistics.org/blog/index.php?pk=63373&T=2

Globally Unique Identifier (entire table): ba.freestatistics.org/blog/index.php?pk=63373&T=2

As an alternative you can also use a QR Code:  

The GUIDs for individual cells are displayed in the table below:

Interpolation Forecasts of Exponential Smoothing
tObservedFittedResiduals
13150.1130.8805847848719.2194152151301
14154.9157.905109673890-3.00510967389044
15162.1163.119940761206-1.01994076120627
16176.7176.837042114557-0.137042114557289
17186.6187.219177521515-0.619177521514899
18194.8194.7363877915690.0636122084314081
19196.3222.232225112377-25.9322251123766
20228.8195.11751715782333.6824828421766
21267.2224.20259410233142.9974058976687
22237.2283.901442079443-46.7014420794433
23254.7244.7895044956329.91049550436773
24258.2271.28539781617-13.0853978161700
25257.9263.814699897086-5.91469989708571
26269.6262.3998148087977.20018519120333
27266.9276.905536256762-10.0055362567618
28269.6284.382714022403-14.7827140224032
29253.9276.767504829663-22.8675048296630
30258.6253.2091972079615.39080279203932
31274.2278.157364936914-3.95736493691419
32301.5270.01184677413331.4881532258671
33304.5288.3297941685516.1702058314501
34285.1302.837171801158-17.7371718011576
35287.7290.070933366641-2.37093336664128
36265.5296.128872327679-30.6288723276792
37264.1261.4499561096002.6500438904003
38276.1259.40542160603016.6945783939705
39258.9273.855365360832-14.9553653608322
40239.1267.417240107409-28.3172401074092
41250.1234.47268399284915.6273160071509
42276.8245.50209411204131.2979058879588
43297.6297.851825910214-0.251825910213597
44295.4299.929471940812-4.52947194081179
45283280.1445643069732.8554356930274
46275.8273.4686885208992.33131147910086
47279.7278.1134499795311.58655002046862
48254.6283.769198230010-29.1691982300104
49234.6252.186511999984-17.586511999984
50176.9227.075627290153-50.1756272901533
51148.1158.405168445699-10.3051684456992
52122.7131.101893376469-8.4018933764694
53124.9101.29293865534123.6070613446595
54121.6104.76782562462816.8321743753722
55128.4111.61479669467216.7852033053279
56144.5114.10681644815330.3931835518466
57151.8128.82379491181322.9762050881868
58167.1143.99362215386223.1063778461379
59173.8170.6139310095883.18606899041225
60203.7178.80198679576624.8980132042344
61199.8213.502594383305-13.7025943833049


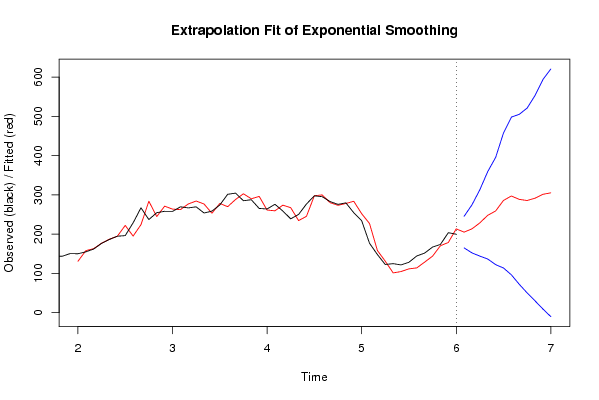
Extrapolation Forecasts of Exponential Smoothing
tForecast95% Lower Bound95% Upper Bound
62205.237717295804164.921283817349245.554150774259
63213.526101489112152.16778895417274.884414024055
64228.756986518236143.997795658477313.516177377995
65248.064929318224136.535302367125359.594556269323
66258.946715255600122.318556216615395.574874294584
67285.912727856994113.677834705983458.147621008005
68297.23670058711696.2403909860852498.233010188147
69288.65522336421672.0672682197685505.243178508664
70285.76173298386850.2384250387331521.285040929004
71291.65969490436129.9406821266919553.378707682029
72301.5297382083989.14505609709352593.914420319703
73305.301865648701-10.1412613150731620.744992612474

\begin{tabular}{lllllllll}
\hline
Extrapolation Forecasts of Exponential Smoothing \tabularnewline
t & Forecast & 95% Lower Bound & 95% Upper Bound \tabularnewline
62 & 205.237717295804 & 164.921283817349 & 245.554150774259 \tabularnewline
63 & 213.526101489112 & 152.16778895417 & 274.884414024055 \tabularnewline
64 & 228.756986518236 & 143.997795658477 & 313.516177377995 \tabularnewline
65 & 248.064929318224 & 136.535302367125 & 359.594556269323 \tabularnewline
66 & 258.946715255600 & 122.318556216615 & 395.574874294584 \tabularnewline
67 & 285.912727856994 & 113.677834705983 & 458.147621008005 \tabularnewline
68 & 297.236700587116 & 96.2403909860852 & 498.233010188147 \tabularnewline
69 & 288.655223364216 & 72.0672682197685 & 505.243178508664 \tabularnewline
70 & 285.761732983868 & 50.2384250387331 & 521.285040929004 \tabularnewline
71 & 291.659694904361 & 29.9406821266919 & 553.378707682029 \tabularnewline
72 & 301.529738208398 & 9.14505609709352 & 593.914420319703 \tabularnewline
73 & 305.301865648701 & -10.1412613150731 & 620.744992612474 \tabularnewline
\hline
\end{tabular}
%Source: https://freestatistics.org/blog/index.php?pk=63373&T=3

[TABLE]
[ROW][C]Extrapolation Forecasts of Exponential Smoothing[/C][/ROW]
[ROW][C]t[/C][C]Forecast[/C][C]95% Lower Bound[/C][C]95% Upper Bound[/C][/ROW]
[ROW][C]62[/C][C]205.237717295804[/C][C]164.921283817349[/C][C]245.554150774259[/C][/ROW]
[ROW][C]63[/C][C]213.526101489112[/C][C]152.16778895417[/C][C]274.884414024055[/C][/ROW]
[ROW][C]64[/C][C]228.756986518236[/C][C]143.997795658477[/C][C]313.516177377995[/C][/ROW]
[ROW][C]65[/C][C]248.064929318224[/C][C]136.535302367125[/C][C]359.594556269323[/C][/ROW]
[ROW][C]66[/C][C]258.946715255600[/C][C]122.318556216615[/C][C]395.574874294584[/C][/ROW]
[ROW][C]67[/C][C]285.912727856994[/C][C]113.677834705983[/C][C]458.147621008005[/C][/ROW]
[ROW][C]68[/C][C]297.236700587116[/C][C]96.2403909860852[/C][C]498.233010188147[/C][/ROW]
[ROW][C]69[/C][C]288.655223364216[/C][C]72.0672682197685[/C][C]505.243178508664[/C][/ROW]
[ROW][C]70[/C][C]285.761732983868[/C][C]50.2384250387331[/C][C]521.285040929004[/C][/ROW]
[ROW][C]71[/C][C]291.659694904361[/C][C]29.9406821266919[/C][C]553.378707682029[/C][/ROW]
[ROW][C]72[/C][C]301.529738208398[/C][C]9.14505609709352[/C][C]593.914420319703[/C][/ROW]
[ROW][C]73[/C][C]305.301865648701[/C][C]-10.1412613150731[/C][C]620.744992612474[/C][/ROW]
[/TABLE]
Source: https://freestatistics.org/blog/index.php?pk=63373&T=3

Globally Unique Identifier (entire table): ba.freestatistics.org/blog/index.php?pk=63373&T=3

As an alternative you can also use a QR Code:  

The GUIDs for individual cells are displayed in the table below:

Extrapolation Forecasts of Exponential Smoothing
tForecast95% Lower Bound95% Upper Bound
62205.237717295804164.921283817349245.554150774259
63213.526101489112152.16778895417274.884414024055
64228.756986518236143.997795658477313.516177377995
65248.064929318224136.535302367125359.594556269323
66258.946715255600122.318556216615395.574874294584
67285.912727856994113.677834705983458.147621008005
68297.23670058711696.2403909860852498.233010188147
69288.65522336421672.0672682197685505.243178508664
70285.76173298386850.2384250387331521.285040929004
71291.65969490436129.9406821266919553.378707682029
72301.5297382083989.14505609709352593.914420319703
73305.301865648701-10.1412613150731620.744992612474


Parameters (Session):
par1 = 12 ; par2 = Triple ; par3 = multiplicative ;
Parameters (R input):
par1 = 12 ; par2 = Triple ; par3 = multiplicative ;
R code (references can be found in the software module):
par1 <- as.numeric(par1)
if (par2 == 'Single') K <- 1
if (par2 == 'Double') K <- 2
if (par2 == 'Triple') K <- par1
nx <- length(x)
nxmK <- nx - K
x <- ts(x, frequency = par1)
if (par2 == 'Single') fit <- HoltWinters(x, gamma=0, beta=0)
if (par2 == 'Double') fit <- HoltWinters(x, gamma=0)
if (par2 == 'Triple') fit <- HoltWinters(x, seasonal=par3)
fit
myresid <- x - fit$fitted[,'xhat']
bitmap(file='test1.png')
op <- par(mfrow=c(2,1))
plot(fit,ylab='Observed (black) / Fitted (red)',main='Interpolation Fit of Exponential Smoothing')
plot(myresid,ylab='Residuals',main='Interpolation Prediction Errors')
par(op)
dev.off()
bitmap(file='test2.png')
p <- predict(fit, par1, prediction.interval=TRUE)
np <- length(p[,1])
plot(fit,p,ylab='Observed (black) / Fitted (red)',main='Extrapolation Fit of Exponential Smoothing')
dev.off()
bitmap(file='test3.png')
op <- par(mfrow = c(2,2))
acf(as.numeric(myresid),lag.max = nx/2,main='Residual ACF')
spectrum(myresid,main='Residals Periodogram')
cpgram(myresid,main='Residal Cumulative Periodogram')
qqnorm(myresid,main='Residual Normal QQ Plot')
qqline(myresid)
par(op)
dev.off()
load(file='createtable')
a<-table.start()
a<-table.row.start(a)
a<-table.element(a,'Estimated Parameters of Exponential Smoothing',2,TRUE)
a<-table.row.end(a)
a<-table.row.start(a)
a<-table.element(a,'Parameter',header=TRUE)
a<-table.element(a,'Value',header=TRUE)
a<-table.row.end(a)
a<-table.row.start(a)
a<-table.element(a,'alpha',header=TRUE)
a<-table.element(a,fit$alpha)
a<-table.row.end(a)
a<-table.row.start(a)
a<-table.element(a,'beta',header=TRUE)
a<-table.element(a,fit$beta)
a<-table.row.end(a)
a<-table.row.start(a)
a<-table.element(a,'gamma',header=TRUE)
a<-table.element(a,fit$gamma)
a<-table.row.end(a)
a<-table.end(a)
table.save(a,file='mytable.tab')
a<-table.start()
a<-table.row.start(a)
a<-table.element(a,'Interpolation Forecasts of Exponential Smoothing',4,TRUE)
a<-table.row.end(a)
a<-table.row.start(a)
a<-table.element(a,'t',header=TRUE)
a<-table.element(a,'Observed',header=TRUE)
a<-table.element(a,'Fitted',header=TRUE)
a<-table.element(a,'Residuals',header=TRUE)
a<-table.row.end(a)
for (i in 1:nxmK) {
a<-table.row.start(a)
a<-table.element(a,i+K,header=TRUE)
a<-table.element(a,x[i+K])
a<-table.element(a,fit$fitted[i,'xhat'])
a<-table.element(a,myresid[i])
a<-table.row.end(a)
}
a<-table.end(a)
table.save(a,file='mytable1.tab')
a<-table.start()
a<-table.row.start(a)
a<-table.element(a,'Extrapolation Forecasts of Exponential Smoothing',4,TRUE)
a<-table.row.end(a)
a<-table.row.start(a)
a<-table.element(a,'t',header=TRUE)
a<-table.element(a,'Forecast',header=TRUE)
a<-table.element(a,'95% Lower Bound',header=TRUE)
a<-table.element(a,'95% Upper Bound',header=TRUE)
a<-table.row.end(a)
for (i in 1:np) {
a<-table.row.start(a)
a<-table.element(a,nx+i,header=TRUE)
a<-table.element(a,p[i,'fit'])
a<-table.element(a,p[i,'lwr'])
a<-table.element(a,p[i,'upr'])
a<-table.row.end(a)
}
a<-table.end(a)
table.save(a,file='mytable2.tab')