Free Statistics

of Irreproducible Research!

Author's title

Author*The author of this computation has been verified*
R Software Modulerwasp_autocorrelation.wasp
Title produced by software(Partial) Autocorrelation Function
Date of computationFri, 04 Dec 2009 05:16:49 -0700
Cite this page as followsStatistical Computations at FreeStatistics.org, Office for Research Development and Education, URL https://freestatistics.org/blog/index.php?v=date/2009/Dec/04/t125992905954gasj8abg5u3mu.htm/, Retrieved Sat, 27 Apr 2024 15:34:19 +0000
Statistical Computations at FreeStatistics.org, Office for Research Development and Education, URL https://freestatistics.org/blog/index.php?pk=63378, Retrieved Sat, 27 Apr 2024 15:34:19 +0000
QR Codes:

Original text written by user:
IsPrivate?No (this computation is public)
User-defined keywords
Estimated Impact117
Family? (F = Feedback message, R = changed R code, M = changed R Module, P = changed Parameters, D = changed Data)
-     [Univariate Data Series] [data set] [2008-12-01 19:54:57] [b98453cac15ba1066b407e146608df68]
- RMP   [(Partial) Autocorrelation Function] [] [2009-11-27 14:47:30] [b98453cac15ba1066b407e146608df68]
-    D      [(Partial) Autocorrelation Function] [] [2009-12-04 12:16:49] [54f12ba6dfaf5b88c7c2745223d9c32f] [Current]
Feedback Forum

Post a new message
Dataseries X:
20366
22782
19169
13807
29743
25591
29096
26482
22405
27044
17970
18730
19684
19785
18479
10698
31956
29506
34506
27165
26736
23691
18157
17328
18205
20995
17382
9367
31124
26551
30651
25859
25100
25778
20418
18688
20424
24776
19814
12738
31566
30111
30019
31934
25826
26835
20205
17789
20520
22518
15572
11509
25447
24090
27786
26195
20516
22759
19028
16971
20036


Summary of computational transaction
Raw Inputview raw input (R code)
Raw Outputview raw output of R engine
Computing time1 seconds
R Server'Gwilym Jenkins' @ 72.249.127.135

\begin{tabular}{lllllllll}
\hline
Summary of computational transaction \tabularnewline
Raw Input & view raw input (R code)  \tabularnewline
Raw Output & view raw output of R engine  \tabularnewline
Computing time & 1 seconds \tabularnewline
R Server & 'Gwilym Jenkins' @ 72.249.127.135 \tabularnewline
\hline
\end{tabular}
%Source: https://freestatistics.org/blog/index.php?pk=63378&T=0

[TABLE]
[ROW][C]Summary of computational transaction[/C][/ROW]
[ROW][C]Raw Input[/C][C]view raw input (R code) [/C][/ROW]
[ROW][C]Raw Output[/C][C]view raw output of R engine [/C][/ROW]
[ROW][C]Computing time[/C][C]1 seconds[/C][/ROW]
[ROW][C]R Server[/C][C]'Gwilym Jenkins' @ 72.249.127.135[/C][/ROW]
[/TABLE]
Source: https://freestatistics.org/blog/index.php?pk=63378&T=0

Globally Unique Identifier (entire table): ba.freestatistics.org/blog/index.php?pk=63378&T=0

As an alternative you can also use a QR Code:  

The GUIDs for individual cells are displayed in the table below:

Summary of computational transaction
Raw Inputview raw input (R code)
Raw Outputview raw output of R engine
Computing time1 seconds
R Server'Gwilym Jenkins' @ 72.249.127.135


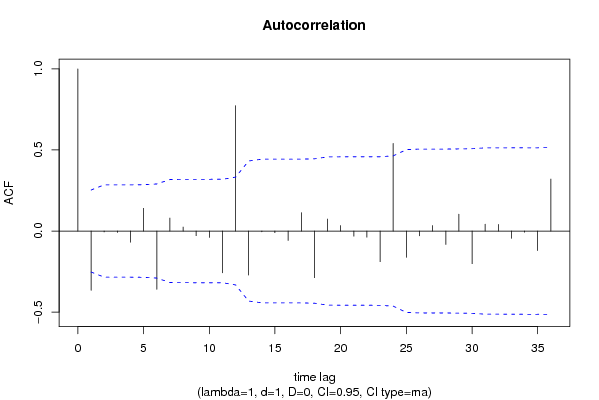
Autocorrelation Function
Time lag kACF(k)T-STATP-value
1-0.365795-2.83340.003132
2-0.005579-0.04320.482836
3-0.008661-0.06710.473366
4-0.06866-0.53180.298402
50.1400541.08490.141163
6-0.359491-2.78460.00358
70.080030.61990.268832
80.0243920.18890.425388
9-0.0286-0.22150.412714
10-0.039584-0.30660.380098
11-0.257722-1.99630.025222
120.7730835.98830
13-0.272055-2.10730.019639
14-0.005113-0.03960.48427
15-0.010595-0.08210.467431
16-0.058016-0.44940.327384
170.1128740.87430.192715
18-0.287936-2.23030.014738
190.0739330.57270.284501
200.0338220.2620.397117
21-0.032327-0.25040.401565
22-0.037957-0.2940.38488
23-0.18918-1.46540.074019
240.5404764.18654.7e-05
25-0.162107-1.25570.107051
26-0.029944-0.23190.408685
270.0337490.26140.397332
28-0.083185-0.64440.260902
290.1037590.80370.212369
30-0.201774-1.56290.061663
310.0419420.32490.3732
320.0402630.31190.378109
33-0.045403-0.35170.36315
34-0.007261-0.05620.477668
35-0.120972-0.9370.176246
360.3202642.48080.007966

\begin{tabular}{lllllllll}
\hline
Autocorrelation Function \tabularnewline
Time lag k & ACF(k) & T-STAT & P-value \tabularnewline
1 & -0.365795 & -2.8334 & 0.003132 \tabularnewline
2 & -0.005579 & -0.0432 & 0.482836 \tabularnewline
3 & -0.008661 & -0.0671 & 0.473366 \tabularnewline
4 & -0.06866 & -0.5318 & 0.298402 \tabularnewline
5 & 0.140054 & 1.0849 & 0.141163 \tabularnewline
6 & -0.359491 & -2.7846 & 0.00358 \tabularnewline
7 & 0.08003 & 0.6199 & 0.268832 \tabularnewline
8 & 0.024392 & 0.1889 & 0.425388 \tabularnewline
9 & -0.0286 & -0.2215 & 0.412714 \tabularnewline
10 & -0.039584 & -0.3066 & 0.380098 \tabularnewline
11 & -0.257722 & -1.9963 & 0.025222 \tabularnewline
12 & 0.773083 & 5.9883 & 0 \tabularnewline
13 & -0.272055 & -2.1073 & 0.019639 \tabularnewline
14 & -0.005113 & -0.0396 & 0.48427 \tabularnewline
15 & -0.010595 & -0.0821 & 0.467431 \tabularnewline
16 & -0.058016 & -0.4494 & 0.327384 \tabularnewline
17 & 0.112874 & 0.8743 & 0.192715 \tabularnewline
18 & -0.287936 & -2.2303 & 0.014738 \tabularnewline
19 & 0.073933 & 0.5727 & 0.284501 \tabularnewline
20 & 0.033822 & 0.262 & 0.397117 \tabularnewline
21 & -0.032327 & -0.2504 & 0.401565 \tabularnewline
22 & -0.037957 & -0.294 & 0.38488 \tabularnewline
23 & -0.18918 & -1.4654 & 0.074019 \tabularnewline
24 & 0.540476 & 4.1865 & 4.7e-05 \tabularnewline
25 & -0.162107 & -1.2557 & 0.107051 \tabularnewline
26 & -0.029944 & -0.2319 & 0.408685 \tabularnewline
27 & 0.033749 & 0.2614 & 0.397332 \tabularnewline
28 & -0.083185 & -0.6444 & 0.260902 \tabularnewline
29 & 0.103759 & 0.8037 & 0.212369 \tabularnewline
30 & -0.201774 & -1.5629 & 0.061663 \tabularnewline
31 & 0.041942 & 0.3249 & 0.3732 \tabularnewline
32 & 0.040263 & 0.3119 & 0.378109 \tabularnewline
33 & -0.045403 & -0.3517 & 0.36315 \tabularnewline
34 & -0.007261 & -0.0562 & 0.477668 \tabularnewline
35 & -0.120972 & -0.937 & 0.176246 \tabularnewline
36 & 0.320264 & 2.4808 & 0.007966 \tabularnewline
\hline
\end{tabular}
%Source: https://freestatistics.org/blog/index.php?pk=63378&T=1

[TABLE]
[ROW][C]Autocorrelation Function[/C][/ROW]
[ROW][C]Time lag k[/C][C]ACF(k)[/C][C]T-STAT[/C][C]P-value[/C][/ROW]
[ROW][C]1[/C][C]-0.365795[/C][C]-2.8334[/C][C]0.003132[/C][/ROW]
[ROW][C]2[/C][C]-0.005579[/C][C]-0.0432[/C][C]0.482836[/C][/ROW]
[ROW][C]3[/C][C]-0.008661[/C][C]-0.0671[/C][C]0.473366[/C][/ROW]
[ROW][C]4[/C][C]-0.06866[/C][C]-0.5318[/C][C]0.298402[/C][/ROW]
[ROW][C]5[/C][C]0.140054[/C][C]1.0849[/C][C]0.141163[/C][/ROW]
[ROW][C]6[/C][C]-0.359491[/C][C]-2.7846[/C][C]0.00358[/C][/ROW]
[ROW][C]7[/C][C]0.08003[/C][C]0.6199[/C][C]0.268832[/C][/ROW]
[ROW][C]8[/C][C]0.024392[/C][C]0.1889[/C][C]0.425388[/C][/ROW]
[ROW][C]9[/C][C]-0.0286[/C][C]-0.2215[/C][C]0.412714[/C][/ROW]
[ROW][C]10[/C][C]-0.039584[/C][C]-0.3066[/C][C]0.380098[/C][/ROW]
[ROW][C]11[/C][C]-0.257722[/C][C]-1.9963[/C][C]0.025222[/C][/ROW]
[ROW][C]12[/C][C]0.773083[/C][C]5.9883[/C][C]0[/C][/ROW]
[ROW][C]13[/C][C]-0.272055[/C][C]-2.1073[/C][C]0.019639[/C][/ROW]
[ROW][C]14[/C][C]-0.005113[/C][C]-0.0396[/C][C]0.48427[/C][/ROW]
[ROW][C]15[/C][C]-0.010595[/C][C]-0.0821[/C][C]0.467431[/C][/ROW]
[ROW][C]16[/C][C]-0.058016[/C][C]-0.4494[/C][C]0.327384[/C][/ROW]
[ROW][C]17[/C][C]0.112874[/C][C]0.8743[/C][C]0.192715[/C][/ROW]
[ROW][C]18[/C][C]-0.287936[/C][C]-2.2303[/C][C]0.014738[/C][/ROW]
[ROW][C]19[/C][C]0.073933[/C][C]0.5727[/C][C]0.284501[/C][/ROW]
[ROW][C]20[/C][C]0.033822[/C][C]0.262[/C][C]0.397117[/C][/ROW]
[ROW][C]21[/C][C]-0.032327[/C][C]-0.2504[/C][C]0.401565[/C][/ROW]
[ROW][C]22[/C][C]-0.037957[/C][C]-0.294[/C][C]0.38488[/C][/ROW]
[ROW][C]23[/C][C]-0.18918[/C][C]-1.4654[/C][C]0.074019[/C][/ROW]
[ROW][C]24[/C][C]0.540476[/C][C]4.1865[/C][C]4.7e-05[/C][/ROW]
[ROW][C]25[/C][C]-0.162107[/C][C]-1.2557[/C][C]0.107051[/C][/ROW]
[ROW][C]26[/C][C]-0.029944[/C][C]-0.2319[/C][C]0.408685[/C][/ROW]
[ROW][C]27[/C][C]0.033749[/C][C]0.2614[/C][C]0.397332[/C][/ROW]
[ROW][C]28[/C][C]-0.083185[/C][C]-0.6444[/C][C]0.260902[/C][/ROW]
[ROW][C]29[/C][C]0.103759[/C][C]0.8037[/C][C]0.212369[/C][/ROW]
[ROW][C]30[/C][C]-0.201774[/C][C]-1.5629[/C][C]0.061663[/C][/ROW]
[ROW][C]31[/C][C]0.041942[/C][C]0.3249[/C][C]0.3732[/C][/ROW]
[ROW][C]32[/C][C]0.040263[/C][C]0.3119[/C][C]0.378109[/C][/ROW]
[ROW][C]33[/C][C]-0.045403[/C][C]-0.3517[/C][C]0.36315[/C][/ROW]
[ROW][C]34[/C][C]-0.007261[/C][C]-0.0562[/C][C]0.477668[/C][/ROW]
[ROW][C]35[/C][C]-0.120972[/C][C]-0.937[/C][C]0.176246[/C][/ROW]
[ROW][C]36[/C][C]0.320264[/C][C]2.4808[/C][C]0.007966[/C][/ROW]
[/TABLE]
Source: https://freestatistics.org/blog/index.php?pk=63378&T=1

Globally Unique Identifier (entire table): ba.freestatistics.org/blog/index.php?pk=63378&T=1

As an alternative you can also use a QR Code:  

The GUIDs for individual cells are displayed in the table below:

Autocorrelation Function
Time lag kACF(k)T-STATP-value
1-0.365795-2.83340.003132
2-0.005579-0.04320.482836
3-0.008661-0.06710.473366
4-0.06866-0.53180.298402
50.1400541.08490.141163
6-0.359491-2.78460.00358
70.080030.61990.268832
80.0243920.18890.425388
9-0.0286-0.22150.412714
10-0.039584-0.30660.380098
11-0.257722-1.99630.025222
120.7730835.98830
13-0.272055-2.10730.019639
14-0.005113-0.03960.48427
15-0.010595-0.08210.467431
16-0.058016-0.44940.327384
170.1128740.87430.192715
18-0.287936-2.23030.014738
190.0739330.57270.284501
200.0338220.2620.397117
21-0.032327-0.25040.401565
22-0.037957-0.2940.38488
23-0.18918-1.46540.074019
240.5404764.18654.7e-05
25-0.162107-1.25570.107051
26-0.029944-0.23190.408685
270.0337490.26140.397332
28-0.083185-0.64440.260902
290.1037590.80370.212369
30-0.201774-1.56290.061663
310.0419420.32490.3732
320.0402630.31190.378109
33-0.045403-0.35170.36315
34-0.007261-0.05620.477668
35-0.120972-0.9370.176246
360.3202642.48080.007966


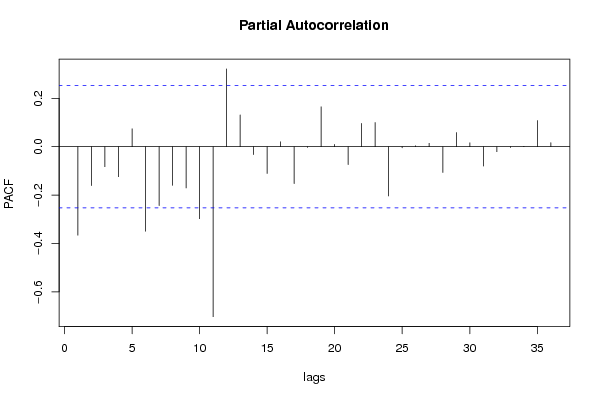
Partial Autocorrelation Function
Time lag kPACF(k)T-STATP-value
1-0.365795-2.83340.003132
2-0.160917-1.24650.108721
3-0.082835-0.64160.261776
4-0.123927-0.95990.17047
50.0742590.57520.283652
6-0.349545-2.70760.004408
7-0.243661-1.88740.031974
8-0.159459-1.23520.110792
9-0.170718-1.32240.095531
10-0.297896-2.30750.012247
11-0.702908-5.44471e-06
120.32162.49110.007759
130.1312921.0170.156622
14-0.032644-0.25290.400622
15-0.110803-0.85830.197077
160.0201460.1560.43826
17-0.152577-1.18190.120963
18-0.002855-0.02210.491215
190.1648191.27670.103317
200.0091470.07090.471875
21-0.07372-0.5710.285054
220.0962890.74590.229334
230.0999650.77430.220889
24-0.20389-1.57930.05976
25-0.004491-0.03480.486183
260.0039540.03060.487834
270.0139350.10790.457201
28-0.106319-0.82350.206731
290.05870.45470.325488
300.0163070.12630.449952
31-0.080177-0.62110.268459
32-0.020516-0.15890.437133
33-0.003542-0.02740.489101
340.0015990.01240.495078
350.1078850.83570.203326
360.0167150.12950.448706

\begin{tabular}{lllllllll}
\hline
Partial Autocorrelation Function \tabularnewline
Time lag k & PACF(k) & T-STAT & P-value \tabularnewline
1 & -0.365795 & -2.8334 & 0.003132 \tabularnewline
2 & -0.160917 & -1.2465 & 0.108721 \tabularnewline
3 & -0.082835 & -0.6416 & 0.261776 \tabularnewline
4 & -0.123927 & -0.9599 & 0.17047 \tabularnewline
5 & 0.074259 & 0.5752 & 0.283652 \tabularnewline
6 & -0.349545 & -2.7076 & 0.004408 \tabularnewline
7 & -0.243661 & -1.8874 & 0.031974 \tabularnewline
8 & -0.159459 & -1.2352 & 0.110792 \tabularnewline
9 & -0.170718 & -1.3224 & 0.095531 \tabularnewline
10 & -0.297896 & -2.3075 & 0.012247 \tabularnewline
11 & -0.702908 & -5.4447 & 1e-06 \tabularnewline
12 & 0.3216 & 2.4911 & 0.007759 \tabularnewline
13 & 0.131292 & 1.017 & 0.156622 \tabularnewline
14 & -0.032644 & -0.2529 & 0.400622 \tabularnewline
15 & -0.110803 & -0.8583 & 0.197077 \tabularnewline
16 & 0.020146 & 0.156 & 0.43826 \tabularnewline
17 & -0.152577 & -1.1819 & 0.120963 \tabularnewline
18 & -0.002855 & -0.0221 & 0.491215 \tabularnewline
19 & 0.164819 & 1.2767 & 0.103317 \tabularnewline
20 & 0.009147 & 0.0709 & 0.471875 \tabularnewline
21 & -0.07372 & -0.571 & 0.285054 \tabularnewline
22 & 0.096289 & 0.7459 & 0.229334 \tabularnewline
23 & 0.099965 & 0.7743 & 0.220889 \tabularnewline
24 & -0.20389 & -1.5793 & 0.05976 \tabularnewline
25 & -0.004491 & -0.0348 & 0.486183 \tabularnewline
26 & 0.003954 & 0.0306 & 0.487834 \tabularnewline
27 & 0.013935 & 0.1079 & 0.457201 \tabularnewline
28 & -0.106319 & -0.8235 & 0.206731 \tabularnewline
29 & 0.0587 & 0.4547 & 0.325488 \tabularnewline
30 & 0.016307 & 0.1263 & 0.449952 \tabularnewline
31 & -0.080177 & -0.6211 & 0.268459 \tabularnewline
32 & -0.020516 & -0.1589 & 0.437133 \tabularnewline
33 & -0.003542 & -0.0274 & 0.489101 \tabularnewline
34 & 0.001599 & 0.0124 & 0.495078 \tabularnewline
35 & 0.107885 & 0.8357 & 0.203326 \tabularnewline
36 & 0.016715 & 0.1295 & 0.448706 \tabularnewline
\hline
\end{tabular}
%Source: https://freestatistics.org/blog/index.php?pk=63378&T=2

[TABLE]
[ROW][C]Partial Autocorrelation Function[/C][/ROW]
[ROW][C]Time lag k[/C][C]PACF(k)[/C][C]T-STAT[/C][C]P-value[/C][/ROW]
[ROW][C]1[/C][C]-0.365795[/C][C]-2.8334[/C][C]0.003132[/C][/ROW]
[ROW][C]2[/C][C]-0.160917[/C][C]-1.2465[/C][C]0.108721[/C][/ROW]
[ROW][C]3[/C][C]-0.082835[/C][C]-0.6416[/C][C]0.261776[/C][/ROW]
[ROW][C]4[/C][C]-0.123927[/C][C]-0.9599[/C][C]0.17047[/C][/ROW]
[ROW][C]5[/C][C]0.074259[/C][C]0.5752[/C][C]0.283652[/C][/ROW]
[ROW][C]6[/C][C]-0.349545[/C][C]-2.7076[/C][C]0.004408[/C][/ROW]
[ROW][C]7[/C][C]-0.243661[/C][C]-1.8874[/C][C]0.031974[/C][/ROW]
[ROW][C]8[/C][C]-0.159459[/C][C]-1.2352[/C][C]0.110792[/C][/ROW]
[ROW][C]9[/C][C]-0.170718[/C][C]-1.3224[/C][C]0.095531[/C][/ROW]
[ROW][C]10[/C][C]-0.297896[/C][C]-2.3075[/C][C]0.012247[/C][/ROW]
[ROW][C]11[/C][C]-0.702908[/C][C]-5.4447[/C][C]1e-06[/C][/ROW]
[ROW][C]12[/C][C]0.3216[/C][C]2.4911[/C][C]0.007759[/C][/ROW]
[ROW][C]13[/C][C]0.131292[/C][C]1.017[/C][C]0.156622[/C][/ROW]
[ROW][C]14[/C][C]-0.032644[/C][C]-0.2529[/C][C]0.400622[/C][/ROW]
[ROW][C]15[/C][C]-0.110803[/C][C]-0.8583[/C][C]0.197077[/C][/ROW]
[ROW][C]16[/C][C]0.020146[/C][C]0.156[/C][C]0.43826[/C][/ROW]
[ROW][C]17[/C][C]-0.152577[/C][C]-1.1819[/C][C]0.120963[/C][/ROW]
[ROW][C]18[/C][C]-0.002855[/C][C]-0.0221[/C][C]0.491215[/C][/ROW]
[ROW][C]19[/C][C]0.164819[/C][C]1.2767[/C][C]0.103317[/C][/ROW]
[ROW][C]20[/C][C]0.009147[/C][C]0.0709[/C][C]0.471875[/C][/ROW]
[ROW][C]21[/C][C]-0.07372[/C][C]-0.571[/C][C]0.285054[/C][/ROW]
[ROW][C]22[/C][C]0.096289[/C][C]0.7459[/C][C]0.229334[/C][/ROW]
[ROW][C]23[/C][C]0.099965[/C][C]0.7743[/C][C]0.220889[/C][/ROW]
[ROW][C]24[/C][C]-0.20389[/C][C]-1.5793[/C][C]0.05976[/C][/ROW]
[ROW][C]25[/C][C]-0.004491[/C][C]-0.0348[/C][C]0.486183[/C][/ROW]
[ROW][C]26[/C][C]0.003954[/C][C]0.0306[/C][C]0.487834[/C][/ROW]
[ROW][C]27[/C][C]0.013935[/C][C]0.1079[/C][C]0.457201[/C][/ROW]
[ROW][C]28[/C][C]-0.106319[/C][C]-0.8235[/C][C]0.206731[/C][/ROW]
[ROW][C]29[/C][C]0.0587[/C][C]0.4547[/C][C]0.325488[/C][/ROW]
[ROW][C]30[/C][C]0.016307[/C][C]0.1263[/C][C]0.449952[/C][/ROW]
[ROW][C]31[/C][C]-0.080177[/C][C]-0.6211[/C][C]0.268459[/C][/ROW]
[ROW][C]32[/C][C]-0.020516[/C][C]-0.1589[/C][C]0.437133[/C][/ROW]
[ROW][C]33[/C][C]-0.003542[/C][C]-0.0274[/C][C]0.489101[/C][/ROW]
[ROW][C]34[/C][C]0.001599[/C][C]0.0124[/C][C]0.495078[/C][/ROW]
[ROW][C]35[/C][C]0.107885[/C][C]0.8357[/C][C]0.203326[/C][/ROW]
[ROW][C]36[/C][C]0.016715[/C][C]0.1295[/C][C]0.448706[/C][/ROW]
[/TABLE]
Source: https://freestatistics.org/blog/index.php?pk=63378&T=2

Globally Unique Identifier (entire table): ba.freestatistics.org/blog/index.php?pk=63378&T=2

As an alternative you can also use a QR Code:  

The GUIDs for individual cells are displayed in the table below:

Partial Autocorrelation Function
Time lag kPACF(k)T-STATP-value
1-0.365795-2.83340.003132
2-0.160917-1.24650.108721
3-0.082835-0.64160.261776
4-0.123927-0.95990.17047
50.0742590.57520.283652
6-0.349545-2.70760.004408
7-0.243661-1.88740.031974
8-0.159459-1.23520.110792
9-0.170718-1.32240.095531
10-0.297896-2.30750.012247
11-0.702908-5.44471e-06
120.32162.49110.007759
130.1312921.0170.156622
14-0.032644-0.25290.400622
15-0.110803-0.85830.197077
160.0201460.1560.43826
17-0.152577-1.18190.120963
18-0.002855-0.02210.491215
190.1648191.27670.103317
200.0091470.07090.471875
21-0.07372-0.5710.285054
220.0962890.74590.229334
230.0999650.77430.220889
24-0.20389-1.57930.05976
25-0.004491-0.03480.486183
260.0039540.03060.487834
270.0139350.10790.457201
28-0.106319-0.82350.206731
290.05870.45470.325488
300.0163070.12630.449952
31-0.080177-0.62110.268459
32-0.020516-0.15890.437133
33-0.003542-0.02740.489101
340.0015990.01240.495078
350.1078850.83570.203326
360.0167150.12950.448706


Parameters (Session):
par1 = 36 ; par2 = 1 ; par3 = 1 ; par4 = 0 ; par5 = 12 ; par6 = MA ; par7 = 0.95 ;
Parameters (R input):
par1 = 36 ; par2 = 1 ; par3 = 1 ; par4 = 0 ; par5 = 12 ; par6 = MA ; par7 = 0.95 ;
R code (references can be found in the software module):
if (par1 == 'Default') {
par1 = 10*log10(length(x))
} else {
par1 <- as.numeric(par1)
}
par2 <- as.numeric(par2)
par3 <- as.numeric(par3)
par4 <- as.numeric(par4)
par5 <- as.numeric(par5)
if (par6 == 'White Noise') par6 <- 'white' else par6 <- 'ma'
par7 <- as.numeric(par7)
if (par2 == 0) {
x <- log(x)
} else {
x <- (x ^ par2 - 1) / par2
}
if (par3 > 0) x <- diff(x,lag=1,difference=par3)
if (par4 > 0) x <- diff(x,lag=par5,difference=par4)
bitmap(file='pic1.png')
racf <- acf(x, par1, main='Autocorrelation', xlab='time lag', ylab='ACF', ci.type=par6, ci=par7, sub=paste('(lambda=',par2,', d=',par3,', D=',par4,', CI=', par7, ', CI type=',par6,')',sep=''))
dev.off()
bitmap(file='pic2.png')
rpacf <- pacf(x,par1,main='Partial Autocorrelation',xlab='lags',ylab='PACF')
dev.off()
(myacf <- c(racf$acf))
(mypacf <- c(rpacf$acf))
lengthx <- length(x)
sqrtn <- sqrt(lengthx)
load(file='createtable')
a<-table.start()
a<-table.row.start(a)
a<-table.element(a,'Autocorrelation Function',4,TRUE)
a<-table.row.end(a)
a<-table.row.start(a)
a<-table.element(a,'Time lag k',header=TRUE)
a<-table.element(a,hyperlink('basics.htm','ACF(k)','click here for more information about the Autocorrelation Function'),header=TRUE)
a<-table.element(a,'T-STAT',header=TRUE)
a<-table.element(a,'P-value',header=TRUE)
a<-table.row.end(a)
for (i in 2:(par1+1)) {
a<-table.row.start(a)
a<-table.element(a,i-1,header=TRUE)
a<-table.element(a,round(myacf[i],6))
mytstat <- myacf[i]*sqrtn
a<-table.element(a,round(mytstat,4))
a<-table.element(a,round(1-pt(abs(mytstat),lengthx),6))
a<-table.row.end(a)
}
a<-table.end(a)
table.save(a,file='mytable.tab')
a<-table.start()
a<-table.row.start(a)
a<-table.element(a,'Partial Autocorrelation Function',4,TRUE)
a<-table.row.end(a)
a<-table.row.start(a)
a<-table.element(a,'Time lag k',header=TRUE)
a<-table.element(a,hyperlink('basics.htm','PACF(k)','click here for more information about the Partial Autocorrelation Function'),header=TRUE)
a<-table.element(a,'T-STAT',header=TRUE)
a<-table.element(a,'P-value',header=TRUE)
a<-table.row.end(a)
for (i in 1:par1) {
a<-table.row.start(a)
a<-table.element(a,i,header=TRUE)
a<-table.element(a,round(mypacf[i],6))
mytstat <- mypacf[i]*sqrtn
a<-table.element(a,round(mytstat,4))
a<-table.element(a,round(1-pt(abs(mytstat),lengthx),6))
a<-table.row.end(a)
}
a<-table.end(a)
table.save(a,file='mytable1.tab')