Free Statistics

of Irreproducible Research!

Author's title

Author*The author of this computation has been verified*
R Software Modulerwasp_exponentialsmoothing.wasp
Title produced by softwareExponential Smoothing
Date of computationFri, 04 Dec 2009 05:26:58 -0700
Cite this page as followsStatistical Computations at FreeStatistics.org, Office for Research Development and Education, URL https://freestatistics.org/blog/index.php?v=date/2009/Dec/04/t1259929653d904n9lhrv9o3hx.htm/, Retrieved Sat, 27 Apr 2024 14:09:53 +0000
Statistical Computations at FreeStatistics.org, Office for Research Development and Education, URL https://freestatistics.org/blog/index.php?pk=63404, Retrieved Sat, 27 Apr 2024 14:09:53 +0000
QR Codes:

Original text written by user:
IsPrivate?No (this computation is public)
User-defined keywords
Estimated Impact111
Family? (F = Feedback message, R = changed R code, M = changed R Module, P = changed Parameters, D = changed Data)
-     [Univariate Data Series] [data set] [2008-12-01 19:54:57] [b98453cac15ba1066b407e146608df68]
- RMP   [Exponential Smoothing] [] [2009-11-27 15:04:36] [b98453cac15ba1066b407e146608df68]
-   PD      [Exponential Smoothing] [] [2009-12-04 12:26:58] [54f12ba6dfaf5b88c7c2745223d9c32f] [Current]
Feedback Forum

Post a new message
Dataseries X:
20366
22782
19169
13807
29743
25591
29096
26482
22405
27044
17970
18730
19684
19785
18479
10698
31956
29506
34506
27165
26736
23691
18157
17328
18205
20995
17382
9367
31124
26551
30651
25859
25100
25778
20418
18688
20424
24776
19814
12738
31566
30111
30019
31934
25826
26835
20205
17789
20520
22518
15572
11509
25447
24090
27786
26195
20516
22759
19028
16971
20036


Summary of computational transaction
Raw Inputview raw input (R code)
Raw Outputview raw output of R engine
Computing time1 seconds
R Server'Gwilym Jenkins' @ 72.249.127.135

\begin{tabular}{lllllllll}
\hline
Summary of computational transaction \tabularnewline
Raw Input & view raw input (R code)  \tabularnewline
Raw Output & view raw output of R engine  \tabularnewline
Computing time & 1 seconds \tabularnewline
R Server & 'Gwilym Jenkins' @ 72.249.127.135 \tabularnewline
\hline
\end{tabular}
%Source: https://freestatistics.org/blog/index.php?pk=63404&T=0

[TABLE]
[ROW][C]Summary of computational transaction[/C][/ROW]
[ROW][C]Raw Input[/C][C]view raw input (R code) [/C][/ROW]
[ROW][C]Raw Output[/C][C]view raw output of R engine [/C][/ROW]
[ROW][C]Computing time[/C][C]1 seconds[/C][/ROW]
[ROW][C]R Server[/C][C]'Gwilym Jenkins' @ 72.249.127.135[/C][/ROW]
[/TABLE]
Source: https://freestatistics.org/blog/index.php?pk=63404&T=0

Globally Unique Identifier (entire table): ba.freestatistics.org/blog/index.php?pk=63404&T=0

As an alternative you can also use a QR Code:  

The GUIDs for individual cells are displayed in the table below:

Summary of computational transaction
Raw Inputview raw input (R code)
Raw Outputview raw output of R engine
Computing time1 seconds
R Server'Gwilym Jenkins' @ 72.249.127.135


Estimated Parameters of Exponential Smoothing
ParameterValue
alpha0.272554654406546
beta0.00487076338884115
gamma0.70455888173589

\begin{tabular}{lllllllll}
\hline
Estimated Parameters of Exponential Smoothing \tabularnewline
Parameter & Value \tabularnewline
alpha & 0.272554654406546 \tabularnewline
beta & 0.00487076338884115 \tabularnewline
gamma & 0.70455888173589 \tabularnewline
\hline
\end{tabular}
%Source: https://freestatistics.org/blog/index.php?pk=63404&T=1

[TABLE]
[ROW][C]Estimated Parameters of Exponential Smoothing[/C][/ROW]
[ROW][C]Parameter[/C][C]Value[/C][/ROW]
[ROW][C]alpha[/C][C]0.272554654406546[/C][/ROW]
[ROW][C]beta[/C][C]0.00487076338884115[/C][/ROW]
[ROW][C]gamma[/C][C]0.70455888173589[/C][/ROW]
[/TABLE]
Source: https://freestatistics.org/blog/index.php?pk=63404&T=1

Globally Unique Identifier (entire table): ba.freestatistics.org/blog/index.php?pk=63404&T=1

As an alternative you can also use a QR Code:  

The GUIDs for individual cells are displayed in the table below:

Estimated Parameters of Exponential Smoothing
ParameterValue
alpha0.272554654406546
beta0.00487076338884115
gamma0.70455888173589


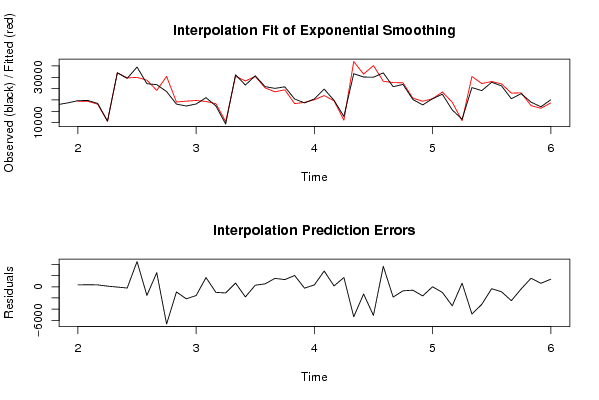
Interpolation Forecasts of Exponential Smoothing
tObservedFittedResiduals
131968419339.8654646862344.134535313824
141978519398.2650313627386.734968637258
151847918127.0426576304351.957342369627
161069810574.3386406903123.661359309668
173195631996.5879679259-40.5879679259233
182950629717.4998941825-211.499894182511
193450629962.68495119054543.31504880952
202716528706.3430014938-1541.34300149381
212673624192.20717586072543.79282413933
222369130373.4273873151-6682.42738731514
231815719079.1179697570-922.117969757048
241732819477.4696161048-2149.46961610479
251820519770.2684824669-1565.26848246688
262099519324.25097675841670.74902324159
271738218374.3927816361-992.39278163606
28936710461.7862917639-1094.78629176393
293112430444.8745887772679.125411222823
302655128364.7051988498-1813.70519884984
313065130358.3210085617292.678991438297
322585925323.6848347909535.315165209082
332510023576.05484305381523.94515694622
342577824479.41504152331298.58495847671
352041818378.53659591012039.46340408991
361868818917.0586264496-229.058626449591
372042420081.4043989695342.595601030476
382477621934.18631259732841.81368740273
391981419649.8670652997164.132934700316
401273811062.53420399171675.46579600831
413156636937.217983932-5371.21798393202
423011131395.3813805006-1284.38138050062
433001935153.946987579-5134.94698757902
443193428243.00727758513690.99272241495
452582627656.0316092446-1830.03160924464
462683527552.0915144511-717.091514451073
472020520803.1605363178-598.160536317813
481778919417.1863121286-1628.18631212860
492052020507.283568647512.7164313524845
502251823520.0257811739-1002.02578117390
511557218978.8641190882-3406.8641190882
521150910844.768605237664.231394763003
532544730338.2051874438-4891.20518744384
542409027230.2409035813-3140.24090358134
552778628121.3150033911-335.315003391053
562619527071.8651917856-876.86519178559
572051622997.6051509559-2481.60515095589
582275923130.5468843130-371.546884313033
591902817479.6379469041548.36205309599
601697116336.7594453119634.240554688129
612003618664.98861282681371.01138717317

\begin{tabular}{lllllllll}
\hline
Interpolation Forecasts of Exponential Smoothing \tabularnewline
t & Observed & Fitted & Residuals \tabularnewline
13 & 19684 & 19339.8654646862 & 344.134535313824 \tabularnewline
14 & 19785 & 19398.2650313627 & 386.734968637258 \tabularnewline
15 & 18479 & 18127.0426576304 & 351.957342369627 \tabularnewline
16 & 10698 & 10574.3386406903 & 123.661359309668 \tabularnewline
17 & 31956 & 31996.5879679259 & -40.5879679259233 \tabularnewline
18 & 29506 & 29717.4998941825 & -211.499894182511 \tabularnewline
19 & 34506 & 29962.6849511905 & 4543.31504880952 \tabularnewline
20 & 27165 & 28706.3430014938 & -1541.34300149381 \tabularnewline
21 & 26736 & 24192.2071758607 & 2543.79282413933 \tabularnewline
22 & 23691 & 30373.4273873151 & -6682.42738731514 \tabularnewline
23 & 18157 & 19079.1179697570 & -922.117969757048 \tabularnewline
24 & 17328 & 19477.4696161048 & -2149.46961610479 \tabularnewline
25 & 18205 & 19770.2684824669 & -1565.26848246688 \tabularnewline
26 & 20995 & 19324.2509767584 & 1670.74902324159 \tabularnewline
27 & 17382 & 18374.3927816361 & -992.39278163606 \tabularnewline
28 & 9367 & 10461.7862917639 & -1094.78629176393 \tabularnewline
29 & 31124 & 30444.8745887772 & 679.125411222823 \tabularnewline
30 & 26551 & 28364.7051988498 & -1813.70519884984 \tabularnewline
31 & 30651 & 30358.3210085617 & 292.678991438297 \tabularnewline
32 & 25859 & 25323.6848347909 & 535.315165209082 \tabularnewline
33 & 25100 & 23576.0548430538 & 1523.94515694622 \tabularnewline
34 & 25778 & 24479.4150415233 & 1298.58495847671 \tabularnewline
35 & 20418 & 18378.5365959101 & 2039.46340408991 \tabularnewline
36 & 18688 & 18917.0586264496 & -229.058626449591 \tabularnewline
37 & 20424 & 20081.4043989695 & 342.595601030476 \tabularnewline
38 & 24776 & 21934.1863125973 & 2841.81368740273 \tabularnewline
39 & 19814 & 19649.8670652997 & 164.132934700316 \tabularnewline
40 & 12738 & 11062.5342039917 & 1675.46579600831 \tabularnewline
41 & 31566 & 36937.217983932 & -5371.21798393202 \tabularnewline
42 & 30111 & 31395.3813805006 & -1284.38138050062 \tabularnewline
43 & 30019 & 35153.946987579 & -5134.94698757902 \tabularnewline
44 & 31934 & 28243.0072775851 & 3690.99272241495 \tabularnewline
45 & 25826 & 27656.0316092446 & -1830.03160924464 \tabularnewline
46 & 26835 & 27552.0915144511 & -717.091514451073 \tabularnewline
47 & 20205 & 20803.1605363178 & -598.160536317813 \tabularnewline
48 & 17789 & 19417.1863121286 & -1628.18631212860 \tabularnewline
49 & 20520 & 20507.2835686475 & 12.7164313524845 \tabularnewline
50 & 22518 & 23520.0257811739 & -1002.02578117390 \tabularnewline
51 & 15572 & 18978.8641190882 & -3406.8641190882 \tabularnewline
52 & 11509 & 10844.768605237 & 664.231394763003 \tabularnewline
53 & 25447 & 30338.2051874438 & -4891.20518744384 \tabularnewline
54 & 24090 & 27230.2409035813 & -3140.24090358134 \tabularnewline
55 & 27786 & 28121.3150033911 & -335.315003391053 \tabularnewline
56 & 26195 & 27071.8651917856 & -876.86519178559 \tabularnewline
57 & 20516 & 22997.6051509559 & -2481.60515095589 \tabularnewline
58 & 22759 & 23130.5468843130 & -371.546884313033 \tabularnewline
59 & 19028 & 17479.637946904 & 1548.36205309599 \tabularnewline
60 & 16971 & 16336.7594453119 & 634.240554688129 \tabularnewline
61 & 20036 & 18664.9886128268 & 1371.01138717317 \tabularnewline
\hline
\end{tabular}
%Source: https://freestatistics.org/blog/index.php?pk=63404&T=2

[TABLE]
[ROW][C]Interpolation Forecasts of Exponential Smoothing[/C][/ROW]
[ROW][C]t[/C][C]Observed[/C][C]Fitted[/C][C]Residuals[/C][/ROW]
[ROW][C]13[/C][C]19684[/C][C]19339.8654646862[/C][C]344.134535313824[/C][/ROW]
[ROW][C]14[/C][C]19785[/C][C]19398.2650313627[/C][C]386.734968637258[/C][/ROW]
[ROW][C]15[/C][C]18479[/C][C]18127.0426576304[/C][C]351.957342369627[/C][/ROW]
[ROW][C]16[/C][C]10698[/C][C]10574.3386406903[/C][C]123.661359309668[/C][/ROW]
[ROW][C]17[/C][C]31956[/C][C]31996.5879679259[/C][C]-40.5879679259233[/C][/ROW]
[ROW][C]18[/C][C]29506[/C][C]29717.4998941825[/C][C]-211.499894182511[/C][/ROW]
[ROW][C]19[/C][C]34506[/C][C]29962.6849511905[/C][C]4543.31504880952[/C][/ROW]
[ROW][C]20[/C][C]27165[/C][C]28706.3430014938[/C][C]-1541.34300149381[/C][/ROW]
[ROW][C]21[/C][C]26736[/C][C]24192.2071758607[/C][C]2543.79282413933[/C][/ROW]
[ROW][C]22[/C][C]23691[/C][C]30373.4273873151[/C][C]-6682.42738731514[/C][/ROW]
[ROW][C]23[/C][C]18157[/C][C]19079.1179697570[/C][C]-922.117969757048[/C][/ROW]
[ROW][C]24[/C][C]17328[/C][C]19477.4696161048[/C][C]-2149.46961610479[/C][/ROW]
[ROW][C]25[/C][C]18205[/C][C]19770.2684824669[/C][C]-1565.26848246688[/C][/ROW]
[ROW][C]26[/C][C]20995[/C][C]19324.2509767584[/C][C]1670.74902324159[/C][/ROW]
[ROW][C]27[/C][C]17382[/C][C]18374.3927816361[/C][C]-992.39278163606[/C][/ROW]
[ROW][C]28[/C][C]9367[/C][C]10461.7862917639[/C][C]-1094.78629176393[/C][/ROW]
[ROW][C]29[/C][C]31124[/C][C]30444.8745887772[/C][C]679.125411222823[/C][/ROW]
[ROW][C]30[/C][C]26551[/C][C]28364.7051988498[/C][C]-1813.70519884984[/C][/ROW]
[ROW][C]31[/C][C]30651[/C][C]30358.3210085617[/C][C]292.678991438297[/C][/ROW]
[ROW][C]32[/C][C]25859[/C][C]25323.6848347909[/C][C]535.315165209082[/C][/ROW]
[ROW][C]33[/C][C]25100[/C][C]23576.0548430538[/C][C]1523.94515694622[/C][/ROW]
[ROW][C]34[/C][C]25778[/C][C]24479.4150415233[/C][C]1298.58495847671[/C][/ROW]
[ROW][C]35[/C][C]20418[/C][C]18378.5365959101[/C][C]2039.46340408991[/C][/ROW]
[ROW][C]36[/C][C]18688[/C][C]18917.0586264496[/C][C]-229.058626449591[/C][/ROW]
[ROW][C]37[/C][C]20424[/C][C]20081.4043989695[/C][C]342.595601030476[/C][/ROW]
[ROW][C]38[/C][C]24776[/C][C]21934.1863125973[/C][C]2841.81368740273[/C][/ROW]
[ROW][C]39[/C][C]19814[/C][C]19649.8670652997[/C][C]164.132934700316[/C][/ROW]
[ROW][C]40[/C][C]12738[/C][C]11062.5342039917[/C][C]1675.46579600831[/C][/ROW]
[ROW][C]41[/C][C]31566[/C][C]36937.217983932[/C][C]-5371.21798393202[/C][/ROW]
[ROW][C]42[/C][C]30111[/C][C]31395.3813805006[/C][C]-1284.38138050062[/C][/ROW]
[ROW][C]43[/C][C]30019[/C][C]35153.946987579[/C][C]-5134.94698757902[/C][/ROW]
[ROW][C]44[/C][C]31934[/C][C]28243.0072775851[/C][C]3690.99272241495[/C][/ROW]
[ROW][C]45[/C][C]25826[/C][C]27656.0316092446[/C][C]-1830.03160924464[/C][/ROW]
[ROW][C]46[/C][C]26835[/C][C]27552.0915144511[/C][C]-717.091514451073[/C][/ROW]
[ROW][C]47[/C][C]20205[/C][C]20803.1605363178[/C][C]-598.160536317813[/C][/ROW]
[ROW][C]48[/C][C]17789[/C][C]19417.1863121286[/C][C]-1628.18631212860[/C][/ROW]
[ROW][C]49[/C][C]20520[/C][C]20507.2835686475[/C][C]12.7164313524845[/C][/ROW]
[ROW][C]50[/C][C]22518[/C][C]23520.0257811739[/C][C]-1002.02578117390[/C][/ROW]
[ROW][C]51[/C][C]15572[/C][C]18978.8641190882[/C][C]-3406.8641190882[/C][/ROW]
[ROW][C]52[/C][C]11509[/C][C]10844.768605237[/C][C]664.231394763003[/C][/ROW]
[ROW][C]53[/C][C]25447[/C][C]30338.2051874438[/C][C]-4891.20518744384[/C][/ROW]
[ROW][C]54[/C][C]24090[/C][C]27230.2409035813[/C][C]-3140.24090358134[/C][/ROW]
[ROW][C]55[/C][C]27786[/C][C]28121.3150033911[/C][C]-335.315003391053[/C][/ROW]
[ROW][C]56[/C][C]26195[/C][C]27071.8651917856[/C][C]-876.86519178559[/C][/ROW]
[ROW][C]57[/C][C]20516[/C][C]22997.6051509559[/C][C]-2481.60515095589[/C][/ROW]
[ROW][C]58[/C][C]22759[/C][C]23130.5468843130[/C][C]-371.546884313033[/C][/ROW]
[ROW][C]59[/C][C]19028[/C][C]17479.637946904[/C][C]1548.36205309599[/C][/ROW]
[ROW][C]60[/C][C]16971[/C][C]16336.7594453119[/C][C]634.240554688129[/C][/ROW]
[ROW][C]61[/C][C]20036[/C][C]18664.9886128268[/C][C]1371.01138717317[/C][/ROW]
[/TABLE]
Source: https://freestatistics.org/blog/index.php?pk=63404&T=2

Globally Unique Identifier (entire table): ba.freestatistics.org/blog/index.php?pk=63404&T=2

As an alternative you can also use a QR Code:  

The GUIDs for individual cells are displayed in the table below:

Interpolation Forecasts of Exponential Smoothing
tObservedFittedResiduals
131968419339.8654646862344.134535313824
141978519398.2650313627386.734968637258
151847918127.0426576304351.957342369627
161069810574.3386406903123.661359309668
173195631996.5879679259-40.5879679259233
182950629717.4998941825-211.499894182511
193450629962.68495119054543.31504880952
202716528706.3430014938-1541.34300149381
212673624192.20717586072543.79282413933
222369130373.4273873151-6682.42738731514
231815719079.1179697570-922.117969757048
241732819477.4696161048-2149.46961610479
251820519770.2684824669-1565.26848246688
262099519324.25097675841670.74902324159
271738218374.3927816361-992.39278163606
28936710461.7862917639-1094.78629176393
293112430444.8745887772679.125411222823
302655128364.7051988498-1813.70519884984
313065130358.3210085617292.678991438297
322585925323.6848347909535.315165209082
332510023576.05484305381523.94515694622
342577824479.41504152331298.58495847671
352041818378.53659591012039.46340408991
361868818917.0586264496-229.058626449591
372042420081.4043989695342.595601030476
382477621934.18631259732841.81368740273
391981419649.8670652997164.132934700316
401273811062.53420399171675.46579600831
413156636937.217983932-5371.21798393202
423011131395.3813805006-1284.38138050062
433001935153.946987579-5134.94698757902
443193428243.00727758513690.99272241495
452582627656.0316092446-1830.03160924464
462683527552.0915144511-717.091514451073
472020520803.1605363178-598.160536317813
481778919417.1863121286-1628.18631212860
492052020507.283568647512.7164313524845
502251823520.0257811739-1002.02578117390
511557218978.8641190882-3406.8641190882
521150910844.768605237664.231394763003
532544730338.2051874438-4891.20518744384
542409027230.2409035813-3140.24090358134
552778628121.3150033911-335.315003391053
562619527071.8651917856-876.86519178559
572051622997.6051509559-2481.60515095589
582275923130.5468843130-371.546884313033
591902817479.6379469041548.36205309599
601697116336.7594453119634.240554688129
612003618664.98861282681371.01138717317


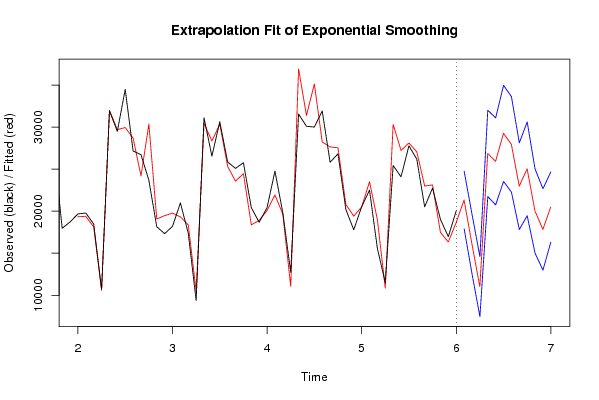
Extrapolation Forecasts of Exponential Smoothing
tForecast95% Lower Bound95% Upper Bound
6221336.541855371517910.975851171824762.1078595713
6316085.127720321412543.805144011019626.4502966318
6411027.14459391287451.9961421833714602.2930456422
6526883.096153937821743.751599190032022.4407086856
6625935.814131864020762.540474799631109.0877889283
6729267.2064843323545.185140695634989.2278279644
6827962.032042874522281.545471333333642.5186144158
6922982.766377706417824.263871679728141.268883733
7025045.391014859119464.819600582230625.9624291359
7120017.565181844615009.636143847525025.4942198416
7217835.458083185712988.867990652622682.0481757187
7320502.631718813116323.994335058724681.2691025675

\begin{tabular}{lllllllll}
\hline
Extrapolation Forecasts of Exponential Smoothing \tabularnewline
t & Forecast & 95% Lower Bound & 95% Upper Bound \tabularnewline
62 & 21336.5418553715 & 17910.9758511718 & 24762.1078595713 \tabularnewline
63 & 16085.1277203214 & 12543.8051440110 & 19626.4502966318 \tabularnewline
64 & 11027.1445939128 & 7451.99614218337 & 14602.2930456422 \tabularnewline
65 & 26883.0961539378 & 21743.7515991900 & 32022.4407086856 \tabularnewline
66 & 25935.8141318640 & 20762.5404747996 & 31109.0877889283 \tabularnewline
67 & 29267.20648433 & 23545.1851406956 & 34989.2278279644 \tabularnewline
68 & 27962.0320428745 & 22281.5454713333 & 33642.5186144158 \tabularnewline
69 & 22982.7663777064 & 17824.2638716797 & 28141.268883733 \tabularnewline
70 & 25045.3910148591 & 19464.8196005822 & 30625.9624291359 \tabularnewline
71 & 20017.5651818446 & 15009.6361438475 & 25025.4942198416 \tabularnewline
72 & 17835.4580831857 & 12988.8679906526 & 22682.0481757187 \tabularnewline
73 & 20502.6317188131 & 16323.9943350587 & 24681.2691025675 \tabularnewline
\hline
\end{tabular}
%Source: https://freestatistics.org/blog/index.php?pk=63404&T=3

[TABLE]
[ROW][C]Extrapolation Forecasts of Exponential Smoothing[/C][/ROW]
[ROW][C]t[/C][C]Forecast[/C][C]95% Lower Bound[/C][C]95% Upper Bound[/C][/ROW]
[ROW][C]62[/C][C]21336.5418553715[/C][C]17910.9758511718[/C][C]24762.1078595713[/C][/ROW]
[ROW][C]63[/C][C]16085.1277203214[/C][C]12543.8051440110[/C][C]19626.4502966318[/C][/ROW]
[ROW][C]64[/C][C]11027.1445939128[/C][C]7451.99614218337[/C][C]14602.2930456422[/C][/ROW]
[ROW][C]65[/C][C]26883.0961539378[/C][C]21743.7515991900[/C][C]32022.4407086856[/C][/ROW]
[ROW][C]66[/C][C]25935.8141318640[/C][C]20762.5404747996[/C][C]31109.0877889283[/C][/ROW]
[ROW][C]67[/C][C]29267.20648433[/C][C]23545.1851406956[/C][C]34989.2278279644[/C][/ROW]
[ROW][C]68[/C][C]27962.0320428745[/C][C]22281.5454713333[/C][C]33642.5186144158[/C][/ROW]
[ROW][C]69[/C][C]22982.7663777064[/C][C]17824.2638716797[/C][C]28141.268883733[/C][/ROW]
[ROW][C]70[/C][C]25045.3910148591[/C][C]19464.8196005822[/C][C]30625.9624291359[/C][/ROW]
[ROW][C]71[/C][C]20017.5651818446[/C][C]15009.6361438475[/C][C]25025.4942198416[/C][/ROW]
[ROW][C]72[/C][C]17835.4580831857[/C][C]12988.8679906526[/C][C]22682.0481757187[/C][/ROW]
[ROW][C]73[/C][C]20502.6317188131[/C][C]16323.9943350587[/C][C]24681.2691025675[/C][/ROW]
[/TABLE]
Source: https://freestatistics.org/blog/index.php?pk=63404&T=3

Globally Unique Identifier (entire table): ba.freestatistics.org/blog/index.php?pk=63404&T=3

As an alternative you can also use a QR Code:  

The GUIDs for individual cells are displayed in the table below:

Extrapolation Forecasts of Exponential Smoothing
tForecast95% Lower Bound95% Upper Bound
6221336.541855371517910.975851171824762.1078595713
6316085.127720321412543.805144011019626.4502966318
6411027.14459391287451.9961421833714602.2930456422
6526883.096153937821743.751599190032022.4407086856
6625935.814131864020762.540474799631109.0877889283
6729267.2064843323545.185140695634989.2278279644
6827962.032042874522281.545471333333642.5186144158
6922982.766377706417824.263871679728141.268883733
7025045.391014859119464.819600582230625.9624291359
7120017.565181844615009.636143847525025.4942198416
7217835.458083185712988.867990652622682.0481757187
7320502.631718813116323.994335058724681.2691025675


Parameters (Session):
par1 = 12 ;
Parameters (R input):
par1 = 12 ; par2 = Triple ; par3 = multiplicative ;
R code (references can be found in the software module):
par1 <- as.numeric(par1)
if (par2 == 'Single') K <- 1
if (par2 == 'Double') K <- 2
if (par2 == 'Triple') K <- par1
nx <- length(x)
nxmK <- nx - K
x <- ts(x, frequency = par1)
if (par2 == 'Single') fit <- HoltWinters(x, gamma=0, beta=0)
if (par2 == 'Double') fit <- HoltWinters(x, gamma=0)
if (par2 == 'Triple') fit <- HoltWinters(x, seasonal=par3)
fit
myresid <- x - fit$fitted[,'xhat']
bitmap(file='test1.png')
op <- par(mfrow=c(2,1))
plot(fit,ylab='Observed (black) / Fitted (red)',main='Interpolation Fit of Exponential Smoothing')
plot(myresid,ylab='Residuals',main='Interpolation Prediction Errors')
par(op)
dev.off()
bitmap(file='test2.png')
p <- predict(fit, par1, prediction.interval=TRUE)
np <- length(p[,1])
plot(fit,p,ylab='Observed (black) / Fitted (red)',main='Extrapolation Fit of Exponential Smoothing')
dev.off()
bitmap(file='test3.png')
op <- par(mfrow = c(2,2))
acf(as.numeric(myresid),lag.max = nx/2,main='Residual ACF')
spectrum(myresid,main='Residals Periodogram')
cpgram(myresid,main='Residal Cumulative Periodogram')
qqnorm(myresid,main='Residual Normal QQ Plot')
qqline(myresid)
par(op)
dev.off()
load(file='createtable')
a<-table.start()
a<-table.row.start(a)
a<-table.element(a,'Estimated Parameters of Exponential Smoothing',2,TRUE)
a<-table.row.end(a)
a<-table.row.start(a)
a<-table.element(a,'Parameter',header=TRUE)
a<-table.element(a,'Value',header=TRUE)
a<-table.row.end(a)
a<-table.row.start(a)
a<-table.element(a,'alpha',header=TRUE)
a<-table.element(a,fit$alpha)
a<-table.row.end(a)
a<-table.row.start(a)
a<-table.element(a,'beta',header=TRUE)
a<-table.element(a,fit$beta)
a<-table.row.end(a)
a<-table.row.start(a)
a<-table.element(a,'gamma',header=TRUE)
a<-table.element(a,fit$gamma)
a<-table.row.end(a)
a<-table.end(a)
table.save(a,file='mytable.tab')
a<-table.start()
a<-table.row.start(a)
a<-table.element(a,'Interpolation Forecasts of Exponential Smoothing',4,TRUE)
a<-table.row.end(a)
a<-table.row.start(a)
a<-table.element(a,'t',header=TRUE)
a<-table.element(a,'Observed',header=TRUE)
a<-table.element(a,'Fitted',header=TRUE)
a<-table.element(a,'Residuals',header=TRUE)
a<-table.row.end(a)
for (i in 1:nxmK) {
a<-table.row.start(a)
a<-table.element(a,i+K,header=TRUE)
a<-table.element(a,x[i+K])
a<-table.element(a,fit$fitted[i,'xhat'])
a<-table.element(a,myresid[i])
a<-table.row.end(a)
}
a<-table.end(a)
table.save(a,file='mytable1.tab')
a<-table.start()
a<-table.row.start(a)
a<-table.element(a,'Extrapolation Forecasts of Exponential Smoothing',4,TRUE)
a<-table.row.end(a)
a<-table.row.start(a)
a<-table.element(a,'t',header=TRUE)
a<-table.element(a,'Forecast',header=TRUE)
a<-table.element(a,'95% Lower Bound',header=TRUE)
a<-table.element(a,'95% Upper Bound',header=TRUE)
a<-table.row.end(a)
for (i in 1:np) {
a<-table.row.start(a)
a<-table.element(a,nx+i,header=TRUE)
a<-table.element(a,p[i,'fit'])
a<-table.element(a,p[i,'lwr'])
a<-table.element(a,p[i,'upr'])
a<-table.row.end(a)
}
a<-table.end(a)
table.save(a,file='mytable2.tab')