Free Statistics

of Irreproducible Research!

Author's title

Author*The author of this computation has been verified*
R Software Modulerwasp_exponentialsmoothing.wasp
Title produced by softwareExponential Smoothing
Date of computationFri, 04 Dec 2009 05:30:03 -0700
Cite this page as followsStatistical Computations at FreeStatistics.org, Office for Research Development and Education, URL https://freestatistics.org/blog/index.php?v=date/2009/Dec/04/t1259929874pfmt8jcn53ng6ap.htm/, Retrieved Sat, 27 Apr 2024 13:48:24 +0000
Statistical Computations at FreeStatistics.org, Office for Research Development and Education, URL https://freestatistics.org/blog/index.php?pk=63410, Retrieved Sat, 27 Apr 2024 13:48:24 +0000
QR Codes:

Original text written by user:
IsPrivate?No (this computation is public)
User-defined keywords
Estimated Impact96
Family? (F = Feedback message, R = changed R code, M = changed R Module, P = changed Parameters, D = changed Data)
-     [Univariate Data Series] [data set] [2008-12-01 19:54:57] [b98453cac15ba1066b407e146608df68]
- RMP   [Exponential Smoothing] [] [2009-11-27 15:04:36] [b98453cac15ba1066b407e146608df68]
-    D      [Exponential Smoothing] [] [2009-12-04 12:30:03] [1c773da0103d9327c2f1f790e2d74438] [Current]
Feedback Forum

Post a new message
Dataseries X:
1,4816
1,4562
1,4268
1,4088
1,4016
1,3650
1,3190
1,3050
1,2785
1,3239
1,3449
1,2732
1,3322
1,4369
1,4975
1,5770
1,5553
1,5557
1,5750
1,5527
1,4748
1,4718
1,4570
1,4684
1,4227
1,3896
1,3622
1,3716
1,3419
1,3511
1,3516
1,3242
1,3074
1,2999
1,3213
1,2881
1,2611
1,2727
1,2811
1,2684
1,2650
1,2770
1,2271
1,2020
1,1938
1,2103
1,1856
1,1786
1,2015
1,2256
1,2292
1,2037
1,2165
1,2694
1,2938
1,3201
1,3014
1,3119
1,3408
1,2991


Summary of computational transaction
Raw Inputview raw input (R code)
Raw Outputview raw output of R engine
Computing time4 seconds
R Server'Gwilym Jenkins' @ 72.249.127.135

\begin{tabular}{lllllllll}
\hline
Summary of computational transaction \tabularnewline
Raw Input & view raw input (R code)  \tabularnewline
Raw Output & view raw output of R engine  \tabularnewline
Computing time & 4 seconds \tabularnewline
R Server & 'Gwilym Jenkins' @ 72.249.127.135 \tabularnewline
\hline
\end{tabular}
%Source: https://freestatistics.org/blog/index.php?pk=63410&T=0

[TABLE]
[ROW][C]Summary of computational transaction[/C][/ROW]
[ROW][C]Raw Input[/C][C]view raw input (R code) [/C][/ROW]
[ROW][C]Raw Output[/C][C]view raw output of R engine [/C][/ROW]
[ROW][C]Computing time[/C][C]4 seconds[/C][/ROW]
[ROW][C]R Server[/C][C]'Gwilym Jenkins' @ 72.249.127.135[/C][/ROW]
[/TABLE]
Source: https://freestatistics.org/blog/index.php?pk=63410&T=0

Globally Unique Identifier (entire table): ba.freestatistics.org/blog/index.php?pk=63410&T=0

As an alternative you can also use a QR Code:  

The GUIDs for individual cells are displayed in the table below:

Summary of computational transaction
Raw Inputview raw input (R code)
Raw Outputview raw output of R engine
Computing time4 seconds
R Server'Gwilym Jenkins' @ 72.249.127.135


Estimated Parameters of Exponential Smoothing
ParameterValue
alpha1
beta0.0339504410338378
gamma0.266247991357555

\begin{tabular}{lllllllll}
\hline
Estimated Parameters of Exponential Smoothing \tabularnewline
Parameter & Value \tabularnewline
alpha & 1 \tabularnewline
beta & 0.0339504410338378 \tabularnewline
gamma & 0.266247991357555 \tabularnewline
\hline
\end{tabular}
%Source: https://freestatistics.org/blog/index.php?pk=63410&T=1

[TABLE]
[ROW][C]Estimated Parameters of Exponential Smoothing[/C][/ROW]
[ROW][C]Parameter[/C][C]Value[/C][/ROW]
[ROW][C]alpha[/C][C]1[/C][/ROW]
[ROW][C]beta[/C][C]0.0339504410338378[/C][/ROW]
[ROW][C]gamma[/C][C]0.266247991357555[/C][/ROW]
[/TABLE]
Source: https://freestatistics.org/blog/index.php?pk=63410&T=1

Globally Unique Identifier (entire table): ba.freestatistics.org/blog/index.php?pk=63410&T=1

As an alternative you can also use a QR Code:  

The GUIDs for individual cells are displayed in the table below:

Estimated Parameters of Exponential Smoothing
ParameterValue
alpha1
beta0.0339504410338378
gamma0.266247991357555


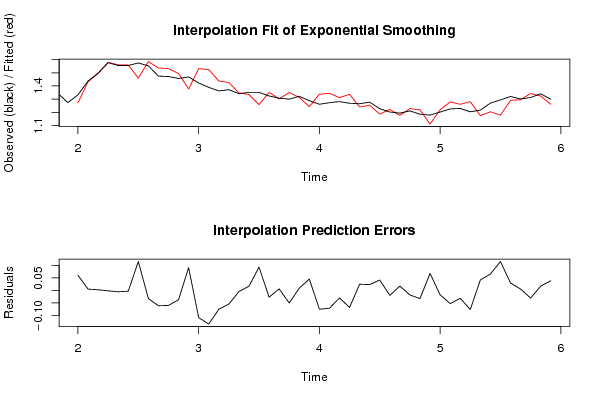
Interpolation Forecasts of Exponential Smoothing
tObservedFittedResiduals
131.33221.271386827277230.060813172722769
141.43691.431857634947780.00504236505221511
151.49751.495057001789490.00244299821050853
161.5771.57901700119157-0.00201700119156634
171.55531.56090629104503-0.00560629104503274
181.55571.55901031353179-0.00331031353178934
191.5751.459494759285850.115505240714154
201.55271.58559394354555-0.0328939435455491
211.47481.53646247493622-0.0616624749362209
221.47181.53206827304489-0.0602682730448914
231.4571.49466759529134-0.0376675952913359
241.46841.377096228071950.0913037719280496
251.42271.53175532803572-0.109055328035721
261.38961.52464227472821-0.13504227472821
271.36221.43800281111357-0.0758028111135665
281.37161.42641234790238-0.0548123479023817
291.34191.34679016706208-0.00489016706207801
301.35111.334494969937680.0166050300623219
311.35161.258227608531770.0933723914682347
321.32421.35138650493592-0.0271865049359226
331.30741.301379399461580.00602060053842113
341.29991.35045000608958-0.0505500060895849
351.32131.312477318312480.00882268168751876
361.28811.242754476676770.0453455233232307
371.26111.33654356203417-0.075443562034172
381.27271.34449608090303-0.0717960809030334
391.28111.31129252311742-0.0301925231174185
401.26841.33674834225979-0.068348342259788
411.2651.240319803616130.0246801963838688
421.2771.253840171443580.0231598285564221
431.22711.185568349065260.0415316509347436
441.2021.22196351579028-0.0199635157902824
451.19381.176608441554950.0171915584450475
461.21031.22867594897188-0.0183759489718773
471.18561.21841282635249-0.0328128263524943
481.17861.110607377489610.0679926225103893
491.20151.21910619052557-0.0176061905255722
501.22561.27859172630983-0.0529917263098263
511.22921.26085249615482-0.031652496154819
521.20371.28051206921857-0.0768120692185719
531.21651.174625565554720.0418744344452815
541.26941.203990546612120.0654094533878815
551.29381.178216322663300.115583677336695
561.32011.290503374171450.0295966258285536
571.30141.295929647274580.00547035272541962
581.31191.34278347696348-0.0308834769634840
591.34081.323712903422790.0170870965772083
601.29911.260504112743050.0385958872569487

\begin{tabular}{lllllllll}
\hline
Interpolation Forecasts of Exponential Smoothing \tabularnewline
t & Observed & Fitted & Residuals \tabularnewline
13 & 1.3322 & 1.27138682727723 & 0.060813172722769 \tabularnewline
14 & 1.4369 & 1.43185763494778 & 0.00504236505221511 \tabularnewline
15 & 1.4975 & 1.49505700178949 & 0.00244299821050853 \tabularnewline
16 & 1.577 & 1.57901700119157 & -0.00201700119156634 \tabularnewline
17 & 1.5553 & 1.56090629104503 & -0.00560629104503274 \tabularnewline
18 & 1.5557 & 1.55901031353179 & -0.00331031353178934 \tabularnewline
19 & 1.575 & 1.45949475928585 & 0.115505240714154 \tabularnewline
20 & 1.5527 & 1.58559394354555 & -0.0328939435455491 \tabularnewline
21 & 1.4748 & 1.53646247493622 & -0.0616624749362209 \tabularnewline
22 & 1.4718 & 1.53206827304489 & -0.0602682730448914 \tabularnewline
23 & 1.457 & 1.49466759529134 & -0.0376675952913359 \tabularnewline
24 & 1.4684 & 1.37709622807195 & 0.0913037719280496 \tabularnewline
25 & 1.4227 & 1.53175532803572 & -0.109055328035721 \tabularnewline
26 & 1.3896 & 1.52464227472821 & -0.13504227472821 \tabularnewline
27 & 1.3622 & 1.43800281111357 & -0.0758028111135665 \tabularnewline
28 & 1.3716 & 1.42641234790238 & -0.0548123479023817 \tabularnewline
29 & 1.3419 & 1.34679016706208 & -0.00489016706207801 \tabularnewline
30 & 1.3511 & 1.33449496993768 & 0.0166050300623219 \tabularnewline
31 & 1.3516 & 1.25822760853177 & 0.0933723914682347 \tabularnewline
32 & 1.3242 & 1.35138650493592 & -0.0271865049359226 \tabularnewline
33 & 1.3074 & 1.30137939946158 & 0.00602060053842113 \tabularnewline
34 & 1.2999 & 1.35045000608958 & -0.0505500060895849 \tabularnewline
35 & 1.3213 & 1.31247731831248 & 0.00882268168751876 \tabularnewline
36 & 1.2881 & 1.24275447667677 & 0.0453455233232307 \tabularnewline
37 & 1.2611 & 1.33654356203417 & -0.075443562034172 \tabularnewline
38 & 1.2727 & 1.34449608090303 & -0.0717960809030334 \tabularnewline
39 & 1.2811 & 1.31129252311742 & -0.0301925231174185 \tabularnewline
40 & 1.2684 & 1.33674834225979 & -0.068348342259788 \tabularnewline
41 & 1.265 & 1.24031980361613 & 0.0246801963838688 \tabularnewline
42 & 1.277 & 1.25384017144358 & 0.0231598285564221 \tabularnewline
43 & 1.2271 & 1.18556834906526 & 0.0415316509347436 \tabularnewline
44 & 1.202 & 1.22196351579028 & -0.0199635157902824 \tabularnewline
45 & 1.1938 & 1.17660844155495 & 0.0171915584450475 \tabularnewline
46 & 1.2103 & 1.22867594897188 & -0.0183759489718773 \tabularnewline
47 & 1.1856 & 1.21841282635249 & -0.0328128263524943 \tabularnewline
48 & 1.1786 & 1.11060737748961 & 0.0679926225103893 \tabularnewline
49 & 1.2015 & 1.21910619052557 & -0.0176061905255722 \tabularnewline
50 & 1.2256 & 1.27859172630983 & -0.0529917263098263 \tabularnewline
51 & 1.2292 & 1.26085249615482 & -0.031652496154819 \tabularnewline
52 & 1.2037 & 1.28051206921857 & -0.0768120692185719 \tabularnewline
53 & 1.2165 & 1.17462556555472 & 0.0418744344452815 \tabularnewline
54 & 1.2694 & 1.20399054661212 & 0.0654094533878815 \tabularnewline
55 & 1.2938 & 1.17821632266330 & 0.115583677336695 \tabularnewline
56 & 1.3201 & 1.29050337417145 & 0.0295966258285536 \tabularnewline
57 & 1.3014 & 1.29592964727458 & 0.00547035272541962 \tabularnewline
58 & 1.3119 & 1.34278347696348 & -0.0308834769634840 \tabularnewline
59 & 1.3408 & 1.32371290342279 & 0.0170870965772083 \tabularnewline
60 & 1.2991 & 1.26050411274305 & 0.0385958872569487 \tabularnewline
\hline
\end{tabular}
%Source: https://freestatistics.org/blog/index.php?pk=63410&T=2

[TABLE]
[ROW][C]Interpolation Forecasts of Exponential Smoothing[/C][/ROW]
[ROW][C]t[/C][C]Observed[/C][C]Fitted[/C][C]Residuals[/C][/ROW]
[ROW][C]13[/C][C]1.3322[/C][C]1.27138682727723[/C][C]0.060813172722769[/C][/ROW]
[ROW][C]14[/C][C]1.4369[/C][C]1.43185763494778[/C][C]0.00504236505221511[/C][/ROW]
[ROW][C]15[/C][C]1.4975[/C][C]1.49505700178949[/C][C]0.00244299821050853[/C][/ROW]
[ROW][C]16[/C][C]1.577[/C][C]1.57901700119157[/C][C]-0.00201700119156634[/C][/ROW]
[ROW][C]17[/C][C]1.5553[/C][C]1.56090629104503[/C][C]-0.00560629104503274[/C][/ROW]
[ROW][C]18[/C][C]1.5557[/C][C]1.55901031353179[/C][C]-0.00331031353178934[/C][/ROW]
[ROW][C]19[/C][C]1.575[/C][C]1.45949475928585[/C][C]0.115505240714154[/C][/ROW]
[ROW][C]20[/C][C]1.5527[/C][C]1.58559394354555[/C][C]-0.0328939435455491[/C][/ROW]
[ROW][C]21[/C][C]1.4748[/C][C]1.53646247493622[/C][C]-0.0616624749362209[/C][/ROW]
[ROW][C]22[/C][C]1.4718[/C][C]1.53206827304489[/C][C]-0.0602682730448914[/C][/ROW]
[ROW][C]23[/C][C]1.457[/C][C]1.49466759529134[/C][C]-0.0376675952913359[/C][/ROW]
[ROW][C]24[/C][C]1.4684[/C][C]1.37709622807195[/C][C]0.0913037719280496[/C][/ROW]
[ROW][C]25[/C][C]1.4227[/C][C]1.53175532803572[/C][C]-0.109055328035721[/C][/ROW]
[ROW][C]26[/C][C]1.3896[/C][C]1.52464227472821[/C][C]-0.13504227472821[/C][/ROW]
[ROW][C]27[/C][C]1.3622[/C][C]1.43800281111357[/C][C]-0.0758028111135665[/C][/ROW]
[ROW][C]28[/C][C]1.3716[/C][C]1.42641234790238[/C][C]-0.0548123479023817[/C][/ROW]
[ROW][C]29[/C][C]1.3419[/C][C]1.34679016706208[/C][C]-0.00489016706207801[/C][/ROW]
[ROW][C]30[/C][C]1.3511[/C][C]1.33449496993768[/C][C]0.0166050300623219[/C][/ROW]
[ROW][C]31[/C][C]1.3516[/C][C]1.25822760853177[/C][C]0.0933723914682347[/C][/ROW]
[ROW][C]32[/C][C]1.3242[/C][C]1.35138650493592[/C][C]-0.0271865049359226[/C][/ROW]
[ROW][C]33[/C][C]1.3074[/C][C]1.30137939946158[/C][C]0.00602060053842113[/C][/ROW]
[ROW][C]34[/C][C]1.2999[/C][C]1.35045000608958[/C][C]-0.0505500060895849[/C][/ROW]
[ROW][C]35[/C][C]1.3213[/C][C]1.31247731831248[/C][C]0.00882268168751876[/C][/ROW]
[ROW][C]36[/C][C]1.2881[/C][C]1.24275447667677[/C][C]0.0453455233232307[/C][/ROW]
[ROW][C]37[/C][C]1.2611[/C][C]1.33654356203417[/C][C]-0.075443562034172[/C][/ROW]
[ROW][C]38[/C][C]1.2727[/C][C]1.34449608090303[/C][C]-0.0717960809030334[/C][/ROW]
[ROW][C]39[/C][C]1.2811[/C][C]1.31129252311742[/C][C]-0.0301925231174185[/C][/ROW]
[ROW][C]40[/C][C]1.2684[/C][C]1.33674834225979[/C][C]-0.068348342259788[/C][/ROW]
[ROW][C]41[/C][C]1.265[/C][C]1.24031980361613[/C][C]0.0246801963838688[/C][/ROW]
[ROW][C]42[/C][C]1.277[/C][C]1.25384017144358[/C][C]0.0231598285564221[/C][/ROW]
[ROW][C]43[/C][C]1.2271[/C][C]1.18556834906526[/C][C]0.0415316509347436[/C][/ROW]
[ROW][C]44[/C][C]1.202[/C][C]1.22196351579028[/C][C]-0.0199635157902824[/C][/ROW]
[ROW][C]45[/C][C]1.1938[/C][C]1.17660844155495[/C][C]0.0171915584450475[/C][/ROW]
[ROW][C]46[/C][C]1.2103[/C][C]1.22867594897188[/C][C]-0.0183759489718773[/C][/ROW]
[ROW][C]47[/C][C]1.1856[/C][C]1.21841282635249[/C][C]-0.0328128263524943[/C][/ROW]
[ROW][C]48[/C][C]1.1786[/C][C]1.11060737748961[/C][C]0.0679926225103893[/C][/ROW]
[ROW][C]49[/C][C]1.2015[/C][C]1.21910619052557[/C][C]-0.0176061905255722[/C][/ROW]
[ROW][C]50[/C][C]1.2256[/C][C]1.27859172630983[/C][C]-0.0529917263098263[/C][/ROW]
[ROW][C]51[/C][C]1.2292[/C][C]1.26085249615482[/C][C]-0.031652496154819[/C][/ROW]
[ROW][C]52[/C][C]1.2037[/C][C]1.28051206921857[/C][C]-0.0768120692185719[/C][/ROW]
[ROW][C]53[/C][C]1.2165[/C][C]1.17462556555472[/C][C]0.0418744344452815[/C][/ROW]
[ROW][C]54[/C][C]1.2694[/C][C]1.20399054661212[/C][C]0.0654094533878815[/C][/ROW]
[ROW][C]55[/C][C]1.2938[/C][C]1.17821632266330[/C][C]0.115583677336695[/C][/ROW]
[ROW][C]56[/C][C]1.3201[/C][C]1.29050337417145[/C][C]0.0295966258285536[/C][/ROW]
[ROW][C]57[/C][C]1.3014[/C][C]1.29592964727458[/C][C]0.00547035272541962[/C][/ROW]
[ROW][C]58[/C][C]1.3119[/C][C]1.34278347696348[/C][C]-0.0308834769634840[/C][/ROW]
[ROW][C]59[/C][C]1.3408[/C][C]1.32371290342279[/C][C]0.0170870965772083[/C][/ROW]
[ROW][C]60[/C][C]1.2991[/C][C]1.26050411274305[/C][C]0.0385958872569487[/C][/ROW]
[/TABLE]
Source: https://freestatistics.org/blog/index.php?pk=63410&T=2

Globally Unique Identifier (entire table): ba.freestatistics.org/blog/index.php?pk=63410&T=2

As an alternative you can also use a QR Code:  

The GUIDs for individual cells are displayed in the table below:

Interpolation Forecasts of Exponential Smoothing
tObservedFittedResiduals
131.33221.271386827277230.060813172722769
141.43691.431857634947780.00504236505221511
151.49751.495057001789490.00244299821050853
161.5771.57901700119157-0.00201700119156634
171.55531.56090629104503-0.00560629104503274
181.55571.55901031353179-0.00331031353178934
191.5751.459494759285850.115505240714154
201.55271.58559394354555-0.0328939435455491
211.47481.53646247493622-0.0616624749362209
221.47181.53206827304489-0.0602682730448914
231.4571.49466759529134-0.0376675952913359
241.46841.377096228071950.0913037719280496
251.42271.53175532803572-0.109055328035721
261.38961.52464227472821-0.13504227472821
271.36221.43800281111357-0.0758028111135665
281.37161.42641234790238-0.0548123479023817
291.34191.34679016706208-0.00489016706207801
301.35111.334494969937680.0166050300623219
311.35161.258227608531770.0933723914682347
321.32421.35138650493592-0.0271865049359226
331.30741.301379399461580.00602060053842113
341.29991.35045000608958-0.0505500060895849
351.32131.312477318312480.00882268168751876
361.28811.242754476676770.0453455233232307
371.26111.33654356203417-0.075443562034172
381.27271.34449608090303-0.0717960809030334
391.28111.31129252311742-0.0301925231174185
401.26841.33674834225979-0.068348342259788
411.2651.240319803616130.0246801963838688
421.2771.253840171443580.0231598285564221
431.22711.185568349065260.0415316509347436
441.2021.22196351579028-0.0199635157902824
451.19381.176608441554950.0171915584450475
461.21031.22867594897188-0.0183759489718773
471.18561.21841282635249-0.0328128263524943
481.17861.110607377489610.0679926225103893
491.20151.21910619052557-0.0176061905255722
501.22561.27859172630983-0.0529917263098263
511.22921.26085249615482-0.031652496154819
521.20371.28051206921857-0.0768120692185719
531.21651.174625565554720.0418744344452815
541.26941.203990546612120.0654094533878815
551.29381.178216322663300.115583677336695
561.32011.290503374171450.0295966258285536
571.30141.295929647274580.00547035272541962
581.31191.34278347696348-0.0308834769634840
591.34081.323712903422790.0170870965772083
601.29911.260504112743050.0385958872569487


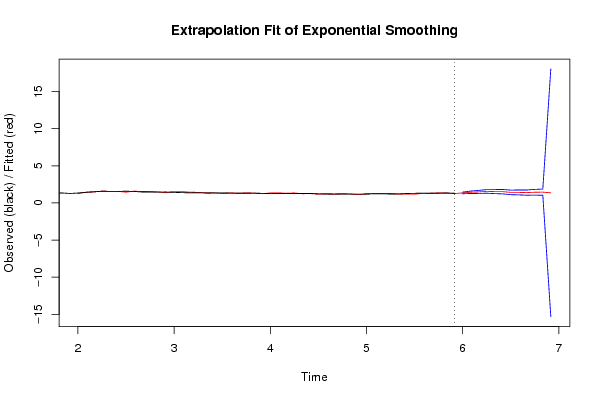
Extrapolation Forecasts of Exponential Smoothing
tForecast95% Lower Bound95% Upper Bound
611.347127431127591.237705821673221.45654904058196
621.437823797061151.275249073606531.60039852051578
631.485647093026811.281076823560501.69021736249312
641.555767045155891.309783160076331.80175093023546
651.529525004162831.25794529450921.80110471381646
661.523133455093291.224537513275171.82172939691141
671.419791763323911.113768432793921.72581509385389
681.417913974046601.085702656523501.75012529156970
691.392684978844311.040495077615511.74487488007311
701.437538712375161.049003865457181.82607355929314
711.452080584541131.035156808041091.86900436104118
721.36607635851613-15.321661373699418.0538140907316

\begin{tabular}{lllllllll}
\hline
Extrapolation Forecasts of Exponential Smoothing \tabularnewline
t & Forecast & 95% Lower Bound & 95% Upper Bound \tabularnewline
61 & 1.34712743112759 & 1.23770582167322 & 1.45654904058196 \tabularnewline
62 & 1.43782379706115 & 1.27524907360653 & 1.60039852051578 \tabularnewline
63 & 1.48564709302681 & 1.28107682356050 & 1.69021736249312 \tabularnewline
64 & 1.55576704515589 & 1.30978316007633 & 1.80175093023546 \tabularnewline
65 & 1.52952500416283 & 1.2579452945092 & 1.80110471381646 \tabularnewline
66 & 1.52313345509329 & 1.22453751327517 & 1.82172939691141 \tabularnewline
67 & 1.41979176332391 & 1.11376843279392 & 1.72581509385389 \tabularnewline
68 & 1.41791397404660 & 1.08570265652350 & 1.75012529156970 \tabularnewline
69 & 1.39268497884431 & 1.04049507761551 & 1.74487488007311 \tabularnewline
70 & 1.43753871237516 & 1.04900386545718 & 1.82607355929314 \tabularnewline
71 & 1.45208058454113 & 1.03515680804109 & 1.86900436104118 \tabularnewline
72 & 1.36607635851613 & -15.3216613736994 & 18.0538140907316 \tabularnewline
\hline
\end{tabular}
%Source: https://freestatistics.org/blog/index.php?pk=63410&T=3

[TABLE]
[ROW][C]Extrapolation Forecasts of Exponential Smoothing[/C][/ROW]
[ROW][C]t[/C][C]Forecast[/C][C]95% Lower Bound[/C][C]95% Upper Bound[/C][/ROW]
[ROW][C]61[/C][C]1.34712743112759[/C][C]1.23770582167322[/C][C]1.45654904058196[/C][/ROW]
[ROW][C]62[/C][C]1.43782379706115[/C][C]1.27524907360653[/C][C]1.60039852051578[/C][/ROW]
[ROW][C]63[/C][C]1.48564709302681[/C][C]1.28107682356050[/C][C]1.69021736249312[/C][/ROW]
[ROW][C]64[/C][C]1.55576704515589[/C][C]1.30978316007633[/C][C]1.80175093023546[/C][/ROW]
[ROW][C]65[/C][C]1.52952500416283[/C][C]1.2579452945092[/C][C]1.80110471381646[/C][/ROW]
[ROW][C]66[/C][C]1.52313345509329[/C][C]1.22453751327517[/C][C]1.82172939691141[/C][/ROW]
[ROW][C]67[/C][C]1.41979176332391[/C][C]1.11376843279392[/C][C]1.72581509385389[/C][/ROW]
[ROW][C]68[/C][C]1.41791397404660[/C][C]1.08570265652350[/C][C]1.75012529156970[/C][/ROW]
[ROW][C]69[/C][C]1.39268497884431[/C][C]1.04049507761551[/C][C]1.74487488007311[/C][/ROW]
[ROW][C]70[/C][C]1.43753871237516[/C][C]1.04900386545718[/C][C]1.82607355929314[/C][/ROW]
[ROW][C]71[/C][C]1.45208058454113[/C][C]1.03515680804109[/C][C]1.86900436104118[/C][/ROW]
[ROW][C]72[/C][C]1.36607635851613[/C][C]-15.3216613736994[/C][C]18.0538140907316[/C][/ROW]
[/TABLE]
Source: https://freestatistics.org/blog/index.php?pk=63410&T=3

Globally Unique Identifier (entire table): ba.freestatistics.org/blog/index.php?pk=63410&T=3

As an alternative you can also use a QR Code:  

The GUIDs for individual cells are displayed in the table below:

Extrapolation Forecasts of Exponential Smoothing
tForecast95% Lower Bound95% Upper Bound
611.347127431127591.237705821673221.45654904058196
621.437823797061151.275249073606531.60039852051578
631.485647093026811.281076823560501.69021736249312
641.555767045155891.309783160076331.80175093023546
651.529525004162831.25794529450921.80110471381646
661.523133455093291.224537513275171.82172939691141
671.419791763323911.113768432793921.72581509385389
681.417913974046601.085702656523501.75012529156970
691.392684978844311.040495077615511.74487488007311
701.437538712375161.049003865457181.82607355929314
711.452080584541131.035156808041091.86900436104118
721.36607635851613-15.321661373699418.0538140907316


Parameters (Session):
par1 = 12 ; par2 = Triple ; par3 = multiplicative ;
Parameters (R input):
par1 = 12 ; par2 = Triple ; par3 = multiplicative ;
R code (references can be found in the software module):
par1 <- as.numeric(par1)
if (par2 == 'Single') K <- 1
if (par2 == 'Double') K <- 2
if (par2 == 'Triple') K <- par1
nx <- length(x)
nxmK <- nx - K
x <- ts(x, frequency = par1)
if (par2 == 'Single') fit <- HoltWinters(x, gamma=0, beta=0)
if (par2 == 'Double') fit <- HoltWinters(x, gamma=0)
if (par2 == 'Triple') fit <- HoltWinters(x, seasonal=par3)
fit
myresid <- x - fit$fitted[,'xhat']
bitmap(file='test1.png')
op <- par(mfrow=c(2,1))
plot(fit,ylab='Observed (black) / Fitted (red)',main='Interpolation Fit of Exponential Smoothing')
plot(myresid,ylab='Residuals',main='Interpolation Prediction Errors')
par(op)
dev.off()
bitmap(file='test2.png')
p <- predict(fit, par1, prediction.interval=TRUE)
np <- length(p[,1])
plot(fit,p,ylab='Observed (black) / Fitted (red)',main='Extrapolation Fit of Exponential Smoothing')
dev.off()
bitmap(file='test3.png')
op <- par(mfrow = c(2,2))
acf(as.numeric(myresid),lag.max = nx/2,main='Residual ACF')
spectrum(myresid,main='Residals Periodogram')
cpgram(myresid,main='Residal Cumulative Periodogram')
qqnorm(myresid,main='Residual Normal QQ Plot')
qqline(myresid)
par(op)
dev.off()
load(file='createtable')
a<-table.start()
a<-table.row.start(a)
a<-table.element(a,'Estimated Parameters of Exponential Smoothing',2,TRUE)
a<-table.row.end(a)
a<-table.row.start(a)
a<-table.element(a,'Parameter',header=TRUE)
a<-table.element(a,'Value',header=TRUE)
a<-table.row.end(a)
a<-table.row.start(a)
a<-table.element(a,'alpha',header=TRUE)
a<-table.element(a,fit$alpha)
a<-table.row.end(a)
a<-table.row.start(a)
a<-table.element(a,'beta',header=TRUE)
a<-table.element(a,fit$beta)
a<-table.row.end(a)
a<-table.row.start(a)
a<-table.element(a,'gamma',header=TRUE)
a<-table.element(a,fit$gamma)
a<-table.row.end(a)
a<-table.end(a)
table.save(a,file='mytable.tab')
a<-table.start()
a<-table.row.start(a)
a<-table.element(a,'Interpolation Forecasts of Exponential Smoothing',4,TRUE)
a<-table.row.end(a)
a<-table.row.start(a)
a<-table.element(a,'t',header=TRUE)
a<-table.element(a,'Observed',header=TRUE)
a<-table.element(a,'Fitted',header=TRUE)
a<-table.element(a,'Residuals',header=TRUE)
a<-table.row.end(a)
for (i in 1:nxmK) {
a<-table.row.start(a)
a<-table.element(a,i+K,header=TRUE)
a<-table.element(a,x[i+K])
a<-table.element(a,fit$fitted[i,'xhat'])
a<-table.element(a,myresid[i])
a<-table.row.end(a)
}
a<-table.end(a)
table.save(a,file='mytable1.tab')
a<-table.start()
a<-table.row.start(a)
a<-table.element(a,'Extrapolation Forecasts of Exponential Smoothing',4,TRUE)
a<-table.row.end(a)
a<-table.row.start(a)
a<-table.element(a,'t',header=TRUE)
a<-table.element(a,'Forecast',header=TRUE)
a<-table.element(a,'95% Lower Bound',header=TRUE)
a<-table.element(a,'95% Upper Bound',header=TRUE)
a<-table.row.end(a)
for (i in 1:np) {
a<-table.row.start(a)
a<-table.element(a,nx+i,header=TRUE)
a<-table.element(a,p[i,'fit'])
a<-table.element(a,p[i,'lwr'])
a<-table.element(a,p[i,'upr'])
a<-table.row.end(a)
}
a<-table.end(a)
table.save(a,file='mytable2.tab')