Free Statistics

of Irreproducible Research!

Author's title

Author*The author of this computation has been verified*
R Software Modulerwasp_autocorrelation.wasp
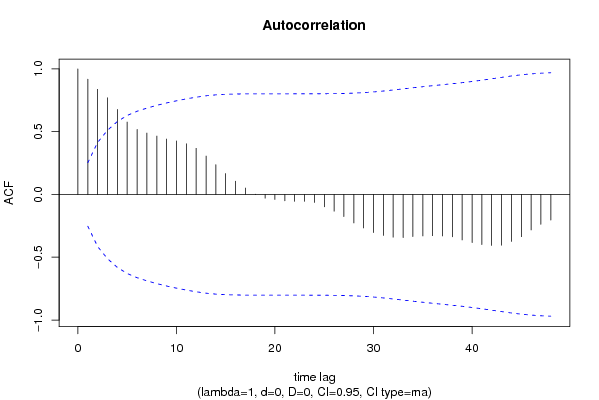
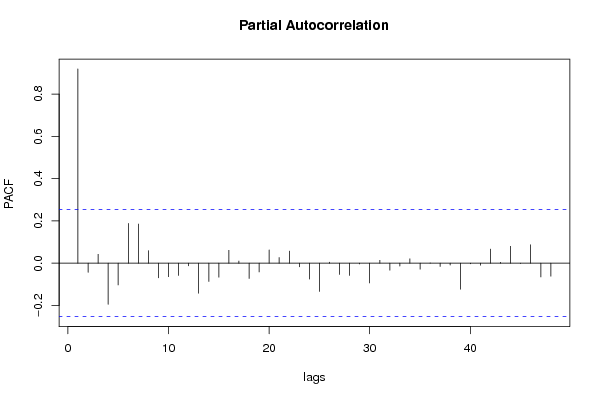
Title produced by software(Partial) Autocorrelation Function
Date of computationFri, 04 Dec 2009 05:31:56 -0700
Cite this page as followsStatistical Computations at FreeStatistics.org, Office for Research Development and Education, URL https://freestatistics.org/blog/index.php?v=date/2009/Dec/04/t1259930043a0oxrhb9dhz0fwv.htm/, Retrieved Sun, 28 Apr 2024 04:40:54 +0000
Statistical Computations at FreeStatistics.org, Office for Research Development and Education, URL https://freestatistics.org/blog/index.php?pk=63415, Retrieved Sun, 28 Apr 2024 04:40:54 +0000
QR Codes:

Original text written by user:
IsPrivate?No (this computation is public)
User-defined keywords
Estimated Impact106
Family? (F = Feedback message, R = changed R code, M = changed R Module, P = changed Parameters, D = changed Data)
-     [Univariate Data Series] [data set] [2008-12-01 19:54:57] [b98453cac15ba1066b407e146608df68]
- RMP   [(Partial) Autocorrelation Function] [] [2009-11-27 14:46:03] [b98453cac15ba1066b407e146608df68]
- R PD      [(Partial) Autocorrelation Function] [ws9] [2009-12-04 12:31:56] [b243db81ea3e1f02fb3382887fb0f701] [Current]
Feedback Forum

Post a new message
Dataseries X:
5594
5585
5710
5511
5403
5826
5884
5965
5960
6064
6046
5954
5952
5960
5983
5996
6021
6094
6202
6276
6306
6342
6345
6328
6191
6261
6253
6198
6247
6293
6381
6448
6470
6516
6532
6526
6533
6498
6507
6464
6453
6468
6497
6808
6793
6907
6792
6757
6734
6654
6589
6469
6521
6448
6410
6528
6445
6458
6215
6167


Summary of computational transaction
Raw Inputview raw input (R code)
Raw Outputview raw output of R engine
Computing time1 seconds
R Server'Gwilym Jenkins' @ 72.249.127.135

\begin{tabular}{lllllllll}
\hline
Summary of computational transaction \tabularnewline
Raw Input & view raw input (R code)  \tabularnewline
Raw Output & view raw output of R engine  \tabularnewline
Computing time & 1 seconds \tabularnewline
R Server & 'Gwilym Jenkins' @ 72.249.127.135 \tabularnewline
\hline
\end{tabular}
%Source: https://freestatistics.org/blog/index.php?pk=63415&T=0

[TABLE]
[ROW][C]Summary of computational transaction[/C][/ROW]
[ROW][C]Raw Input[/C][C]view raw input (R code) [/C][/ROW]
[ROW][C]Raw Output[/C][C]view raw output of R engine [/C][/ROW]
[ROW][C]Computing time[/C][C]1 seconds[/C][/ROW]
[ROW][C]R Server[/C][C]'Gwilym Jenkins' @ 72.249.127.135[/C][/ROW]
[/TABLE]
Source: https://freestatistics.org/blog/index.php?pk=63415&T=0

Globally Unique Identifier (entire table): ba.freestatistics.org/blog/index.php?pk=63415&T=0

As an alternative you can also use a QR Code:  

The GUIDs for individual cells are displayed in the table below:

Summary of computational transaction
Raw Inputview raw input (R code)
Raw Outputview raw output of R engine
Computing time1 seconds
R Server'Gwilym Jenkins' @ 72.249.127.135


Autocorrelation Function
Time lag kACF(k)T-STATP-value
10.9188727.11760
20.8376216.48820
30.7697415.96240
40.6777365.24971e-06
50.5772294.47121.8e-05
60.517924.01188.5e-05
70.4894263.79110.000175
80.4650653.60240.000321
90.4416043.42070.000565
100.4263383.30240.000809
110.4035563.12590.001366
120.3672982.84510.003033
130.3061312.37130.010477
140.2378011.8420.035209
150.1670851.29420.100271
160.1062570.82310.206865
170.0513510.39780.346107
180.0026340.02040.491895
19-0.029531-0.22870.409923
20-0.039984-0.30970.378925
21-0.050225-0.3890.349311
22-0.054321-0.42080.337714
23-0.054326-0.42080.3377
24-0.063803-0.49420.311478
25-0.098521-0.76310.224184
26-0.13317-1.03150.153216
27-0.175517-1.35960.08953
28-0.226298-1.75290.042364
29-0.267031-2.06840.021459
30-0.303311-2.34940.011056
31-0.326674-2.53040.007017
32-0.339795-2.6320.005387
33-0.34332-2.65930.005012
34-0.335485-2.59870.00588
35-0.330699-2.56160.006475
36-0.327863-2.53960.006853
37-0.330532-2.56030.006497
38-0.337355-2.61310.005661
39-0.362536-2.80820.003356
40-0.383135-2.96780.002152
41-0.39859-3.08750.001527
42-0.4057-3.14250.001301
43-0.403461-3.12520.001369
44-0.374445-2.90040.002601
45-0.335753-2.60070.005848
46-0.282262-2.18640.016349
47-0.237959-1.84320.035119
48-0.204007-1.58020.059656

\begin{tabular}{lllllllll}
\hline
Autocorrelation Function \tabularnewline
Time lag k & ACF(k) & T-STAT & P-value \tabularnewline
1 & 0.918872 & 7.1176 & 0 \tabularnewline
2 & 0.837621 & 6.4882 & 0 \tabularnewline
3 & 0.769741 & 5.9624 & 0 \tabularnewline
4 & 0.677736 & 5.2497 & 1e-06 \tabularnewline
5 & 0.577229 & 4.4712 & 1.8e-05 \tabularnewline
6 & 0.51792 & 4.0118 & 8.5e-05 \tabularnewline
7 & 0.489426 & 3.7911 & 0.000175 \tabularnewline
8 & 0.465065 & 3.6024 & 0.000321 \tabularnewline
9 & 0.441604 & 3.4207 & 0.000565 \tabularnewline
10 & 0.426338 & 3.3024 & 0.000809 \tabularnewline
11 & 0.403556 & 3.1259 & 0.001366 \tabularnewline
12 & 0.367298 & 2.8451 & 0.003033 \tabularnewline
13 & 0.306131 & 2.3713 & 0.010477 \tabularnewline
14 & 0.237801 & 1.842 & 0.035209 \tabularnewline
15 & 0.167085 & 1.2942 & 0.100271 \tabularnewline
16 & 0.106257 & 0.8231 & 0.206865 \tabularnewline
17 & 0.051351 & 0.3978 & 0.346107 \tabularnewline
18 & 0.002634 & 0.0204 & 0.491895 \tabularnewline
19 & -0.029531 & -0.2287 & 0.409923 \tabularnewline
20 & -0.039984 & -0.3097 & 0.378925 \tabularnewline
21 & -0.050225 & -0.389 & 0.349311 \tabularnewline
22 & -0.054321 & -0.4208 & 0.337714 \tabularnewline
23 & -0.054326 & -0.4208 & 0.3377 \tabularnewline
24 & -0.063803 & -0.4942 & 0.311478 \tabularnewline
25 & -0.098521 & -0.7631 & 0.224184 \tabularnewline
26 & -0.13317 & -1.0315 & 0.153216 \tabularnewline
27 & -0.175517 & -1.3596 & 0.08953 \tabularnewline
28 & -0.226298 & -1.7529 & 0.042364 \tabularnewline
29 & -0.267031 & -2.0684 & 0.021459 \tabularnewline
30 & -0.303311 & -2.3494 & 0.011056 \tabularnewline
31 & -0.326674 & -2.5304 & 0.007017 \tabularnewline
32 & -0.339795 & -2.632 & 0.005387 \tabularnewline
33 & -0.34332 & -2.6593 & 0.005012 \tabularnewline
34 & -0.335485 & -2.5987 & 0.00588 \tabularnewline
35 & -0.330699 & -2.5616 & 0.006475 \tabularnewline
36 & -0.327863 & -2.5396 & 0.006853 \tabularnewline
37 & -0.330532 & -2.5603 & 0.006497 \tabularnewline
38 & -0.337355 & -2.6131 & 0.005661 \tabularnewline
39 & -0.362536 & -2.8082 & 0.003356 \tabularnewline
40 & -0.383135 & -2.9678 & 0.002152 \tabularnewline
41 & -0.39859 & -3.0875 & 0.001527 \tabularnewline
42 & -0.4057 & -3.1425 & 0.001301 \tabularnewline
43 & -0.403461 & -3.1252 & 0.001369 \tabularnewline
44 & -0.374445 & -2.9004 & 0.002601 \tabularnewline
45 & -0.335753 & -2.6007 & 0.005848 \tabularnewline
46 & -0.282262 & -2.1864 & 0.016349 \tabularnewline
47 & -0.237959 & -1.8432 & 0.035119 \tabularnewline
48 & -0.204007 & -1.5802 & 0.059656 \tabularnewline
\hline
\end{tabular}
%Source: https://freestatistics.org/blog/index.php?pk=63415&T=1

[TABLE]
[ROW][C]Autocorrelation Function[/C][/ROW]
[ROW][C]Time lag k[/C][C]ACF(k)[/C][C]T-STAT[/C][C]P-value[/C][/ROW]
[ROW][C]1[/C][C]0.918872[/C][C]7.1176[/C][C]0[/C][/ROW]
[ROW][C]2[/C][C]0.837621[/C][C]6.4882[/C][C]0[/C][/ROW]
[ROW][C]3[/C][C]0.769741[/C][C]5.9624[/C][C]0[/C][/ROW]
[ROW][C]4[/C][C]0.677736[/C][C]5.2497[/C][C]1e-06[/C][/ROW]
[ROW][C]5[/C][C]0.577229[/C][C]4.4712[/C][C]1.8e-05[/C][/ROW]
[ROW][C]6[/C][C]0.51792[/C][C]4.0118[/C][C]8.5e-05[/C][/ROW]
[ROW][C]7[/C][C]0.489426[/C][C]3.7911[/C][C]0.000175[/C][/ROW]
[ROW][C]8[/C][C]0.465065[/C][C]3.6024[/C][C]0.000321[/C][/ROW]
[ROW][C]9[/C][C]0.441604[/C][C]3.4207[/C][C]0.000565[/C][/ROW]
[ROW][C]10[/C][C]0.426338[/C][C]3.3024[/C][C]0.000809[/C][/ROW]
[ROW][C]11[/C][C]0.403556[/C][C]3.1259[/C][C]0.001366[/C][/ROW]
[ROW][C]12[/C][C]0.367298[/C][C]2.8451[/C][C]0.003033[/C][/ROW]
[ROW][C]13[/C][C]0.306131[/C][C]2.3713[/C][C]0.010477[/C][/ROW]
[ROW][C]14[/C][C]0.237801[/C][C]1.842[/C][C]0.035209[/C][/ROW]
[ROW][C]15[/C][C]0.167085[/C][C]1.2942[/C][C]0.100271[/C][/ROW]
[ROW][C]16[/C][C]0.106257[/C][C]0.8231[/C][C]0.206865[/C][/ROW]
[ROW][C]17[/C][C]0.051351[/C][C]0.3978[/C][C]0.346107[/C][/ROW]
[ROW][C]18[/C][C]0.002634[/C][C]0.0204[/C][C]0.491895[/C][/ROW]
[ROW][C]19[/C][C]-0.029531[/C][C]-0.2287[/C][C]0.409923[/C][/ROW]
[ROW][C]20[/C][C]-0.039984[/C][C]-0.3097[/C][C]0.378925[/C][/ROW]
[ROW][C]21[/C][C]-0.050225[/C][C]-0.389[/C][C]0.349311[/C][/ROW]
[ROW][C]22[/C][C]-0.054321[/C][C]-0.4208[/C][C]0.337714[/C][/ROW]
[ROW][C]23[/C][C]-0.054326[/C][C]-0.4208[/C][C]0.3377[/C][/ROW]
[ROW][C]24[/C][C]-0.063803[/C][C]-0.4942[/C][C]0.311478[/C][/ROW]
[ROW][C]25[/C][C]-0.098521[/C][C]-0.7631[/C][C]0.224184[/C][/ROW]
[ROW][C]26[/C][C]-0.13317[/C][C]-1.0315[/C][C]0.153216[/C][/ROW]
[ROW][C]27[/C][C]-0.175517[/C][C]-1.3596[/C][C]0.08953[/C][/ROW]
[ROW][C]28[/C][C]-0.226298[/C][C]-1.7529[/C][C]0.042364[/C][/ROW]
[ROW][C]29[/C][C]-0.267031[/C][C]-2.0684[/C][C]0.021459[/C][/ROW]
[ROW][C]30[/C][C]-0.303311[/C][C]-2.3494[/C][C]0.011056[/C][/ROW]
[ROW][C]31[/C][C]-0.326674[/C][C]-2.5304[/C][C]0.007017[/C][/ROW]
[ROW][C]32[/C][C]-0.339795[/C][C]-2.632[/C][C]0.005387[/C][/ROW]
[ROW][C]33[/C][C]-0.34332[/C][C]-2.6593[/C][C]0.005012[/C][/ROW]
[ROW][C]34[/C][C]-0.335485[/C][C]-2.5987[/C][C]0.00588[/C][/ROW]
[ROW][C]35[/C][C]-0.330699[/C][C]-2.5616[/C][C]0.006475[/C][/ROW]
[ROW][C]36[/C][C]-0.327863[/C][C]-2.5396[/C][C]0.006853[/C][/ROW]
[ROW][C]37[/C][C]-0.330532[/C][C]-2.5603[/C][C]0.006497[/C][/ROW]
[ROW][C]38[/C][C]-0.337355[/C][C]-2.6131[/C][C]0.005661[/C][/ROW]
[ROW][C]39[/C][C]-0.362536[/C][C]-2.8082[/C][C]0.003356[/C][/ROW]
[ROW][C]40[/C][C]-0.383135[/C][C]-2.9678[/C][C]0.002152[/C][/ROW]
[ROW][C]41[/C][C]-0.39859[/C][C]-3.0875[/C][C]0.001527[/C][/ROW]
[ROW][C]42[/C][C]-0.4057[/C][C]-3.1425[/C][C]0.001301[/C][/ROW]
[ROW][C]43[/C][C]-0.403461[/C][C]-3.1252[/C][C]0.001369[/C][/ROW]
[ROW][C]44[/C][C]-0.374445[/C][C]-2.9004[/C][C]0.002601[/C][/ROW]
[ROW][C]45[/C][C]-0.335753[/C][C]-2.6007[/C][C]0.005848[/C][/ROW]
[ROW][C]46[/C][C]-0.282262[/C][C]-2.1864[/C][C]0.016349[/C][/ROW]
[ROW][C]47[/C][C]-0.237959[/C][C]-1.8432[/C][C]0.035119[/C][/ROW]
[ROW][C]48[/C][C]-0.204007[/C][C]-1.5802[/C][C]0.059656[/C][/ROW]
[/TABLE]
Source: https://freestatistics.org/blog/index.php?pk=63415&T=1

Globally Unique Identifier (entire table): ba.freestatistics.org/blog/index.php?pk=63415&T=1

As an alternative you can also use a QR Code:  

The GUIDs for individual cells are displayed in the table below:

Autocorrelation Function
Time lag kACF(k)T-STATP-value
10.9188727.11760
20.8376216.48820
30.7697415.96240
40.6777365.24971e-06
50.5772294.47121.8e-05
60.517924.01188.5e-05
70.4894263.79110.000175
80.4650653.60240.000321
90.4416043.42070.000565
100.4263383.30240.000809
110.4035563.12590.001366
120.3672982.84510.003033
130.3061312.37130.010477
140.2378011.8420.035209
150.1670851.29420.100271
160.1062570.82310.206865
170.0513510.39780.346107
180.0026340.02040.491895
19-0.029531-0.22870.409923
20-0.039984-0.30970.378925
21-0.050225-0.3890.349311
22-0.054321-0.42080.337714
23-0.054326-0.42080.3377
24-0.063803-0.49420.311478
25-0.098521-0.76310.224184
26-0.13317-1.03150.153216
27-0.175517-1.35960.08953
28-0.226298-1.75290.042364
29-0.267031-2.06840.021459
30-0.303311-2.34940.011056
31-0.326674-2.53040.007017
32-0.339795-2.6320.005387
33-0.34332-2.65930.005012
34-0.335485-2.59870.00588
35-0.330699-2.56160.006475
36-0.327863-2.53960.006853
37-0.330532-2.56030.006497
38-0.337355-2.61310.005661
39-0.362536-2.80820.003356
40-0.383135-2.96780.002152
41-0.39859-3.08750.001527
42-0.4057-3.14250.001301
43-0.403461-3.12520.001369
44-0.374445-2.90040.002601
45-0.335753-2.60070.005848
46-0.282262-2.18640.016349
47-0.237959-1.84320.035119
48-0.204007-1.58020.059656


Partial Autocorrelation Function
Time lag kPACF(k)T-STATP-value
10.9188727.11760
2-0.043069-0.33360.369919
30.0418340.3240.373516
4-0.194606-1.50740.068476
5-0.102919-0.79720.214236
60.1882661.45830.074986
70.1848271.43170.078715
80.0591560.45820.324226
9-0.069466-0.53810.296256
10-0.064102-0.49650.310667
11-0.058241-0.45110.32676
12-0.012776-0.0990.460749
13-0.142292-1.10220.13739
14-0.086285-0.66840.253233
15-0.066404-0.51440.304444
160.0609670.47230.31923
170.0102450.07940.468505
18-0.072178-0.55910.289092
19-0.041472-0.32120.374572
200.0625760.48470.314822
210.0267210.2070.418364
220.0569970.44150.33022
23-0.017058-0.13210.447661
24-0.074943-0.58050.281873
25-0.133693-1.03560.152276
260.0047390.03670.485418
27-0.053356-0.41330.340432
28-0.058084-0.44990.327195
29-0.003535-0.02740.489123
30-0.093474-0.7240.235927
310.0136470.10570.458084
32-0.033179-0.2570.399026
33-0.013971-0.10820.457093
340.0206130.15970.436839
35-0.02851-0.22080.412984
360.0008960.00690.497242
37-0.015243-0.11810.453203
38-0.008847-0.06850.472796
39-0.123113-0.95360.172049
40-0.003027-0.02340.490686
41-0.009613-0.07450.470446
420.0664550.51480.304306
430.0039260.03040.487921
440.0799960.61960.268918
45-0.001512-0.01170.495347
460.0867570.6720.252077
47-0.064892-0.50270.308524
48-0.061629-0.47740.317413

\begin{tabular}{lllllllll}
\hline
Partial Autocorrelation Function \tabularnewline
Time lag k & PACF(k) & T-STAT & P-value \tabularnewline
1 & 0.918872 & 7.1176 & 0 \tabularnewline
2 & -0.043069 & -0.3336 & 0.369919 \tabularnewline
3 & 0.041834 & 0.324 & 0.373516 \tabularnewline
4 & -0.194606 & -1.5074 & 0.068476 \tabularnewline
5 & -0.102919 & -0.7972 & 0.214236 \tabularnewline
6 & 0.188266 & 1.4583 & 0.074986 \tabularnewline
7 & 0.184827 & 1.4317 & 0.078715 \tabularnewline
8 & 0.059156 & 0.4582 & 0.324226 \tabularnewline
9 & -0.069466 & -0.5381 & 0.296256 \tabularnewline
10 & -0.064102 & -0.4965 & 0.310667 \tabularnewline
11 & -0.058241 & -0.4511 & 0.32676 \tabularnewline
12 & -0.012776 & -0.099 & 0.460749 \tabularnewline
13 & -0.142292 & -1.1022 & 0.13739 \tabularnewline
14 & -0.086285 & -0.6684 & 0.253233 \tabularnewline
15 & -0.066404 & -0.5144 & 0.304444 \tabularnewline
16 & 0.060967 & 0.4723 & 0.31923 \tabularnewline
17 & 0.010245 & 0.0794 & 0.468505 \tabularnewline
18 & -0.072178 & -0.5591 & 0.289092 \tabularnewline
19 & -0.041472 & -0.3212 & 0.374572 \tabularnewline
20 & 0.062576 & 0.4847 & 0.314822 \tabularnewline
21 & 0.026721 & 0.207 & 0.418364 \tabularnewline
22 & 0.056997 & 0.4415 & 0.33022 \tabularnewline
23 & -0.017058 & -0.1321 & 0.447661 \tabularnewline
24 & -0.074943 & -0.5805 & 0.281873 \tabularnewline
25 & -0.133693 & -1.0356 & 0.152276 \tabularnewline
26 & 0.004739 & 0.0367 & 0.485418 \tabularnewline
27 & -0.053356 & -0.4133 & 0.340432 \tabularnewline
28 & -0.058084 & -0.4499 & 0.327195 \tabularnewline
29 & -0.003535 & -0.0274 & 0.489123 \tabularnewline
30 & -0.093474 & -0.724 & 0.235927 \tabularnewline
31 & 0.013647 & 0.1057 & 0.458084 \tabularnewline
32 & -0.033179 & -0.257 & 0.399026 \tabularnewline
33 & -0.013971 & -0.1082 & 0.457093 \tabularnewline
34 & 0.020613 & 0.1597 & 0.436839 \tabularnewline
35 & -0.02851 & -0.2208 & 0.412984 \tabularnewline
36 & 0.000896 & 0.0069 & 0.497242 \tabularnewline
37 & -0.015243 & -0.1181 & 0.453203 \tabularnewline
38 & -0.008847 & -0.0685 & 0.472796 \tabularnewline
39 & -0.123113 & -0.9536 & 0.172049 \tabularnewline
40 & -0.003027 & -0.0234 & 0.490686 \tabularnewline
41 & -0.009613 & -0.0745 & 0.470446 \tabularnewline
42 & 0.066455 & 0.5148 & 0.304306 \tabularnewline
43 & 0.003926 & 0.0304 & 0.487921 \tabularnewline
44 & 0.079996 & 0.6196 & 0.268918 \tabularnewline
45 & -0.001512 & -0.0117 & 0.495347 \tabularnewline
46 & 0.086757 & 0.672 & 0.252077 \tabularnewline
47 & -0.064892 & -0.5027 & 0.308524 \tabularnewline
48 & -0.061629 & -0.4774 & 0.317413 \tabularnewline
\hline
\end{tabular}
%Source: https://freestatistics.org/blog/index.php?pk=63415&T=2

[TABLE]
[ROW][C]Partial Autocorrelation Function[/C][/ROW]
[ROW][C]Time lag k[/C][C]PACF(k)[/C][C]T-STAT[/C][C]P-value[/C][/ROW]
[ROW][C]1[/C][C]0.918872[/C][C]7.1176[/C][C]0[/C][/ROW]
[ROW][C]2[/C][C]-0.043069[/C][C]-0.3336[/C][C]0.369919[/C][/ROW]
[ROW][C]3[/C][C]0.041834[/C][C]0.324[/C][C]0.373516[/C][/ROW]
[ROW][C]4[/C][C]-0.194606[/C][C]-1.5074[/C][C]0.068476[/C][/ROW]
[ROW][C]5[/C][C]-0.102919[/C][C]-0.7972[/C][C]0.214236[/C][/ROW]
[ROW][C]6[/C][C]0.188266[/C][C]1.4583[/C][C]0.074986[/C][/ROW]
[ROW][C]7[/C][C]0.184827[/C][C]1.4317[/C][C]0.078715[/C][/ROW]
[ROW][C]8[/C][C]0.059156[/C][C]0.4582[/C][C]0.324226[/C][/ROW]
[ROW][C]9[/C][C]-0.069466[/C][C]-0.5381[/C][C]0.296256[/C][/ROW]
[ROW][C]10[/C][C]-0.064102[/C][C]-0.4965[/C][C]0.310667[/C][/ROW]
[ROW][C]11[/C][C]-0.058241[/C][C]-0.4511[/C][C]0.32676[/C][/ROW]
[ROW][C]12[/C][C]-0.012776[/C][C]-0.099[/C][C]0.460749[/C][/ROW]
[ROW][C]13[/C][C]-0.142292[/C][C]-1.1022[/C][C]0.13739[/C][/ROW]
[ROW][C]14[/C][C]-0.086285[/C][C]-0.6684[/C][C]0.253233[/C][/ROW]
[ROW][C]15[/C][C]-0.066404[/C][C]-0.5144[/C][C]0.304444[/C][/ROW]
[ROW][C]16[/C][C]0.060967[/C][C]0.4723[/C][C]0.31923[/C][/ROW]
[ROW][C]17[/C][C]0.010245[/C][C]0.0794[/C][C]0.468505[/C][/ROW]
[ROW][C]18[/C][C]-0.072178[/C][C]-0.5591[/C][C]0.289092[/C][/ROW]
[ROW][C]19[/C][C]-0.041472[/C][C]-0.3212[/C][C]0.374572[/C][/ROW]
[ROW][C]20[/C][C]0.062576[/C][C]0.4847[/C][C]0.314822[/C][/ROW]
[ROW][C]21[/C][C]0.026721[/C][C]0.207[/C][C]0.418364[/C][/ROW]
[ROW][C]22[/C][C]0.056997[/C][C]0.4415[/C][C]0.33022[/C][/ROW]
[ROW][C]23[/C][C]-0.017058[/C][C]-0.1321[/C][C]0.447661[/C][/ROW]
[ROW][C]24[/C][C]-0.074943[/C][C]-0.5805[/C][C]0.281873[/C][/ROW]
[ROW][C]25[/C][C]-0.133693[/C][C]-1.0356[/C][C]0.152276[/C][/ROW]
[ROW][C]26[/C][C]0.004739[/C][C]0.0367[/C][C]0.485418[/C][/ROW]
[ROW][C]27[/C][C]-0.053356[/C][C]-0.4133[/C][C]0.340432[/C][/ROW]
[ROW][C]28[/C][C]-0.058084[/C][C]-0.4499[/C][C]0.327195[/C][/ROW]
[ROW][C]29[/C][C]-0.003535[/C][C]-0.0274[/C][C]0.489123[/C][/ROW]
[ROW][C]30[/C][C]-0.093474[/C][C]-0.724[/C][C]0.235927[/C][/ROW]
[ROW][C]31[/C][C]0.013647[/C][C]0.1057[/C][C]0.458084[/C][/ROW]
[ROW][C]32[/C][C]-0.033179[/C][C]-0.257[/C][C]0.399026[/C][/ROW]
[ROW][C]33[/C][C]-0.013971[/C][C]-0.1082[/C][C]0.457093[/C][/ROW]
[ROW][C]34[/C][C]0.020613[/C][C]0.1597[/C][C]0.436839[/C][/ROW]
[ROW][C]35[/C][C]-0.02851[/C][C]-0.2208[/C][C]0.412984[/C][/ROW]
[ROW][C]36[/C][C]0.000896[/C][C]0.0069[/C][C]0.497242[/C][/ROW]
[ROW][C]37[/C][C]-0.015243[/C][C]-0.1181[/C][C]0.453203[/C][/ROW]
[ROW][C]38[/C][C]-0.008847[/C][C]-0.0685[/C][C]0.472796[/C][/ROW]
[ROW][C]39[/C][C]-0.123113[/C][C]-0.9536[/C][C]0.172049[/C][/ROW]
[ROW][C]40[/C][C]-0.003027[/C][C]-0.0234[/C][C]0.490686[/C][/ROW]
[ROW][C]41[/C][C]-0.009613[/C][C]-0.0745[/C][C]0.470446[/C][/ROW]
[ROW][C]42[/C][C]0.066455[/C][C]0.5148[/C][C]0.304306[/C][/ROW]
[ROW][C]43[/C][C]0.003926[/C][C]0.0304[/C][C]0.487921[/C][/ROW]
[ROW][C]44[/C][C]0.079996[/C][C]0.6196[/C][C]0.268918[/C][/ROW]
[ROW][C]45[/C][C]-0.001512[/C][C]-0.0117[/C][C]0.495347[/C][/ROW]
[ROW][C]46[/C][C]0.086757[/C][C]0.672[/C][C]0.252077[/C][/ROW]
[ROW][C]47[/C][C]-0.064892[/C][C]-0.5027[/C][C]0.308524[/C][/ROW]
[ROW][C]48[/C][C]-0.061629[/C][C]-0.4774[/C][C]0.317413[/C][/ROW]
[/TABLE]
Source: https://freestatistics.org/blog/index.php?pk=63415&T=2

Globally Unique Identifier (entire table): ba.freestatistics.org/blog/index.php?pk=63415&T=2

As an alternative you can also use a QR Code:  

The GUIDs for individual cells are displayed in the table below:

Partial Autocorrelation Function
Time lag kPACF(k)T-STATP-value
10.9188727.11760
2-0.043069-0.33360.369919
30.0418340.3240.373516
4-0.194606-1.50740.068476
5-0.102919-0.79720.214236
60.1882661.45830.074986
70.1848271.43170.078715
80.0591560.45820.324226
9-0.069466-0.53810.296256
10-0.064102-0.49650.310667
11-0.058241-0.45110.32676
12-0.012776-0.0990.460749
13-0.142292-1.10220.13739
14-0.086285-0.66840.253233
15-0.066404-0.51440.304444
160.0609670.47230.31923
170.0102450.07940.468505
18-0.072178-0.55910.289092
19-0.041472-0.32120.374572
200.0625760.48470.314822
210.0267210.2070.418364
220.0569970.44150.33022
23-0.017058-0.13210.447661
24-0.074943-0.58050.281873
25-0.133693-1.03560.152276
260.0047390.03670.485418
27-0.053356-0.41330.340432
28-0.058084-0.44990.327195
29-0.003535-0.02740.489123
30-0.093474-0.7240.235927
310.0136470.10570.458084
32-0.033179-0.2570.399026
33-0.013971-0.10820.457093
340.0206130.15970.436839
35-0.02851-0.22080.412984
360.0008960.00690.497242
37-0.015243-0.11810.453203
38-0.008847-0.06850.472796
39-0.123113-0.95360.172049
40-0.003027-0.02340.490686
41-0.009613-0.07450.470446
420.0664550.51480.304306
430.0039260.03040.487921
440.0799960.61960.268918
45-0.001512-0.01170.495347
460.0867570.6720.252077
47-0.064892-0.50270.308524
48-0.061629-0.47740.317413


Parameters (Session):
par1 = 48 ; par2 = 1 ; par3 = 0 ; par4 = 0 ; par5 = 12 ; par6 = MA ; par7 = 0.95 ;
Parameters (R input):
par1 = 48 ; par2 = 1 ; par3 = 0 ; par4 = 0 ; par5 = 12 ; par6 = MA ; par7 = 0.95 ;
R code (references can be found in the software module):
if (par1 == 'Default') {
par1 = 10*log10(length(x))
} else {
par1 <- as.numeric(par1)
}
par2 <- as.numeric(par2)
par3 <- as.numeric(par3)
par4 <- as.numeric(par4)
par5 <- as.numeric(par5)
if (par6 == 'White Noise') par6 <- 'white' else par6 <- 'ma'
par7 <- as.numeric(par7)
if (par2 == 0) {
x <- log(x)
} else {
x <- (x ^ par2 - 1) / par2
}
if (par3 > 0) x <- diff(x,lag=1,difference=par3)
if (par4 > 0) x <- diff(x,lag=par5,difference=par4)
bitmap(file='pic1.png')
racf <- acf(x, par1, main='Autocorrelation', xlab='time lag', ylab='ACF', ci.type=par6, ci=par7, sub=paste('(lambda=',par2,', d=',par3,', D=',par4,', CI=', par7, ', CI type=',par6,')',sep=''))
dev.off()
bitmap(file='pic2.png')
rpacf <- pacf(x,par1,main='Partial Autocorrelation',xlab='lags',ylab='PACF')
dev.off()
(myacf <- c(racf$acf))
(mypacf <- c(rpacf$acf))
lengthx <- length(x)
sqrtn <- sqrt(lengthx)
load(file='createtable')
a<-table.start()
a<-table.row.start(a)
a<-table.element(a,'Autocorrelation Function',4,TRUE)
a<-table.row.end(a)
a<-table.row.start(a)
a<-table.element(a,'Time lag k',header=TRUE)
a<-table.element(a,hyperlink('basics.htm','ACF(k)','click here for more information about the Autocorrelation Function'),header=TRUE)
a<-table.element(a,'T-STAT',header=TRUE)
a<-table.element(a,'P-value',header=TRUE)
a<-table.row.end(a)
for (i in 2:(par1+1)) {
a<-table.row.start(a)
a<-table.element(a,i-1,header=TRUE)
a<-table.element(a,round(myacf[i],6))
mytstat <- myacf[i]*sqrtn
a<-table.element(a,round(mytstat,4))
a<-table.element(a,round(1-pt(abs(mytstat),lengthx),6))
a<-table.row.end(a)
}
a<-table.end(a)
table.save(a,file='mytable.tab')
a<-table.start()
a<-table.row.start(a)
a<-table.element(a,'Partial Autocorrelation Function',4,TRUE)
a<-table.row.end(a)
a<-table.row.start(a)
a<-table.element(a,'Time lag k',header=TRUE)
a<-table.element(a,hyperlink('basics.htm','PACF(k)','click here for more information about the Partial Autocorrelation Function'),header=TRUE)
a<-table.element(a,'T-STAT',header=TRUE)
a<-table.element(a,'P-value',header=TRUE)
a<-table.row.end(a)
for (i in 1:par1) {
a<-table.row.start(a)
a<-table.element(a,i,header=TRUE)
a<-table.element(a,round(mypacf[i],6))
mytstat <- mypacf[i]*sqrtn
a<-table.element(a,round(mytstat,4))
a<-table.element(a,round(1-pt(abs(mytstat),lengthx),6))
a<-table.row.end(a)
}
a<-table.end(a)
table.save(a,file='mytable1.tab')