Free Statistics

of Irreproducible Research!

Author's title

Author*The author of this computation has been verified*
R Software Modulerwasp_exponentialsmoothing.wasp
Title produced by softwareExponential Smoothing
Date of computationFri, 04 Dec 2009 05:36:22 -0700
Cite this page as followsStatistical Computations at FreeStatistics.org, Office for Research Development and Education, URL https://freestatistics.org/blog/index.php?v=date/2009/Dec/04/t12599302190t47a9sg95bvr00.htm/, Retrieved Sat, 27 Apr 2024 15:08:31 +0000
Statistical Computations at FreeStatistics.org, Office for Research Development and Education, URL https://freestatistics.org/blog/index.php?pk=63422, Retrieved Sat, 27 Apr 2024 15:08:31 +0000
QR Codes:

Original text written by user:
IsPrivate?No (this computation is public)
User-defined keywords
Estimated Impact112
Family? (F = Feedback message, R = changed R code, M = changed R Module, P = changed Parameters, D = changed Data)
-     [Univariate Data Series] [data set] [2008-12-01 19:54:57] [b98453cac15ba1066b407e146608df68]
- RMP   [Exponential Smoothing] [] [2009-11-27 15:04:36] [b98453cac15ba1066b407e146608df68]
-    D    [Exponential Smoothing] [] [2009-12-03 17:45:05] [58e1a7a2c10f1de09acf218271f55dfd]
-   PD        [Exponential Smoothing] [] [2009-12-04 12:36:22] [d41d8cd98f00b204e9800998ecf8427e] [Current]
Feedback Forum

Post a new message
Dataseries X:
89.1
82.6
102.7
91.8
94.1
103.1
93.2
91
94.3
99.4
115.7
116.8
99.8
96
115.9
109.1
117.3
109.8
112.8
110.7
100
113.3
122.4
112.5
104.2
92.5
117.2
109.3
106.1
118.8
105.3
106
102
112.9
116.5
114.8
100.5
85.4
114.6
109.9
100.7
115.5
100.7
99
102.3
108.8
105.9
113.2
95.7
80.9
113.9
98.1
102.8
104.7
95.9
94.6
101.6
103.9
110.3
114.1


Summary of computational transaction
Raw Inputview raw input (R code)
Raw Outputview raw output of R engine
Computing time2 seconds
R Server'Gwilym Jenkins' @ 72.249.127.135

\begin{tabular}{lllllllll}
\hline
Summary of computational transaction \tabularnewline
Raw Input & view raw input (R code)  \tabularnewline
Raw Output & view raw output of R engine  \tabularnewline
Computing time & 2 seconds \tabularnewline
R Server & 'Gwilym Jenkins' @ 72.249.127.135 \tabularnewline
\hline
\end{tabular}
%Source: https://freestatistics.org/blog/index.php?pk=63422&T=0

[TABLE]
[ROW][C]Summary of computational transaction[/C][/ROW]
[ROW][C]Raw Input[/C][C]view raw input (R code) [/C][/ROW]
[ROW][C]Raw Output[/C][C]view raw output of R engine [/C][/ROW]
[ROW][C]Computing time[/C][C]2 seconds[/C][/ROW]
[ROW][C]R Server[/C][C]'Gwilym Jenkins' @ 72.249.127.135[/C][/ROW]
[/TABLE]
Source: https://freestatistics.org/blog/index.php?pk=63422&T=0

Globally Unique Identifier (entire table): ba.freestatistics.org/blog/index.php?pk=63422&T=0

As an alternative you can also use a QR Code:  

The GUIDs for individual cells are displayed in the table below:

Summary of computational transaction
Raw Inputview raw input (R code)
Raw Outputview raw output of R engine
Computing time2 seconds
R Server'Gwilym Jenkins' @ 72.249.127.135


Estimated Parameters of Exponential Smoothing
ParameterValue
alpha0.461822201228865
beta0.0370500609885143
gamma0.86645948143892

\begin{tabular}{lllllllll}
\hline
Estimated Parameters of Exponential Smoothing \tabularnewline
Parameter & Value \tabularnewline
alpha & 0.461822201228865 \tabularnewline
beta & 0.0370500609885143 \tabularnewline
gamma & 0.86645948143892 \tabularnewline
\hline
\end{tabular}
%Source: https://freestatistics.org/blog/index.php?pk=63422&T=1

[TABLE]
[ROW][C]Estimated Parameters of Exponential Smoothing[/C][/ROW]
[ROW][C]Parameter[/C][C]Value[/C][/ROW]
[ROW][C]alpha[/C][C]0.461822201228865[/C][/ROW]
[ROW][C]beta[/C][C]0.0370500609885143[/C][/ROW]
[ROW][C]gamma[/C][C]0.86645948143892[/C][/ROW]
[/TABLE]
Source: https://freestatistics.org/blog/index.php?pk=63422&T=1

Globally Unique Identifier (entire table): ba.freestatistics.org/blog/index.php?pk=63422&T=1

As an alternative you can also use a QR Code:  

The GUIDs for individual cells are displayed in the table below:

Estimated Parameters of Exponential Smoothing
ParameterValue
alpha0.461822201228865
beta0.0370500609885143
gamma0.86645948143892


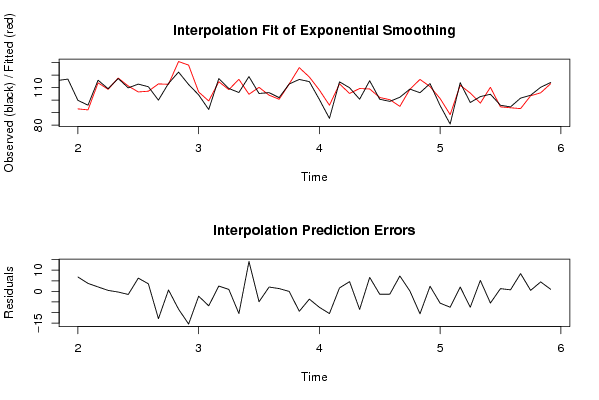
Interpolation Forecasts of Exponential Smoothing
tObservedFittedResiduals
1399.892.9980849266436.80191507335697
149692.2299679639953.77003203600505
15115.9113.8092662485142.09073375148630
16109.1108.6365181255160.46348187448443
17117.3117.624969281130-0.324969281130365
18109.8111.2670794324-1.46707943240001
19112.8106.5335520977696.26644790223148
20110.7107.1346099164133.56539008358713
21100112.948784398470-12.9487843984698
22113.3112.6410970301810.658902969818968
23122.4130.817513237740-8.41751323773954
24112.5127.960805437920-15.4608054379197
25104.2106.483992710884-2.28399271088448
2692.599.3359375733496-6.83593757334964
27117.2114.6962316714842.50376832851623
28109.3108.3856095399910.914390460008633
29106.1116.608663453095-10.5086634530947
30118.8104.68652703970314.1134729602971
31105.3110.218566781973-4.91856678197304
32106103.9611698388702.03883016113022
33102100.6956537860491.30434621395054
34112.9112.946094328629-0.0460943286294935
35116.5125.944662047986-9.44466204798623
36114.8118.477738958324-3.67773895832434
37100.5108.059179232688-7.55917923268757
3885.495.907751752781-10.5077517527811
39114.6112.9774190770331.62258092296726
40109.9105.3141820764814.58581792351919
41100.7109.270395269952-8.57039526995169
42115.5108.9051699525496.5948300474506
43100.7102.096080523330-1.39608052333041
4499100.346625170941-1.34662517094054
45102.395.03045393019317.26954606980685
46108.8108.6733306204830.126669379517253
47105.9116.527437348416-10.6274373484158
48113.2110.8097310385772.39026896142300
4995.7101.283044609479-5.58304460947906
5080.988.4225705544356-7.52257055443562
51113.9111.8872893912682.01271060873175
5298.1105.620839082788-7.5208390827876
53102.897.61226010004135.18773989995869
54104.7110.246555160514-5.54655516051434
5595.994.62306498908391.27693501091612
5694.693.88876831227730.711231687722716
57101.693.20015608649158.39984391350846
58103.9103.4536876856060.446312314393722
59110.3105.8437349499534.45626505004702
60114.1113.1737834033460.926216596653745

\begin{tabular}{lllllllll}
\hline
Interpolation Forecasts of Exponential Smoothing \tabularnewline
t & Observed & Fitted & Residuals \tabularnewline
13 & 99.8 & 92.998084926643 & 6.80191507335697 \tabularnewline
14 & 96 & 92.229967963995 & 3.77003203600505 \tabularnewline
15 & 115.9 & 113.809266248514 & 2.09073375148630 \tabularnewline
16 & 109.1 & 108.636518125516 & 0.46348187448443 \tabularnewline
17 & 117.3 & 117.624969281130 & -0.324969281130365 \tabularnewline
18 & 109.8 & 111.2670794324 & -1.46707943240001 \tabularnewline
19 & 112.8 & 106.533552097769 & 6.26644790223148 \tabularnewline
20 & 110.7 & 107.134609916413 & 3.56539008358713 \tabularnewline
21 & 100 & 112.948784398470 & -12.9487843984698 \tabularnewline
22 & 113.3 & 112.641097030181 & 0.658902969818968 \tabularnewline
23 & 122.4 & 130.817513237740 & -8.41751323773954 \tabularnewline
24 & 112.5 & 127.960805437920 & -15.4608054379197 \tabularnewline
25 & 104.2 & 106.483992710884 & -2.28399271088448 \tabularnewline
26 & 92.5 & 99.3359375733496 & -6.83593757334964 \tabularnewline
27 & 117.2 & 114.696231671484 & 2.50376832851623 \tabularnewline
28 & 109.3 & 108.385609539991 & 0.914390460008633 \tabularnewline
29 & 106.1 & 116.608663453095 & -10.5086634530947 \tabularnewline
30 & 118.8 & 104.686527039703 & 14.1134729602971 \tabularnewline
31 & 105.3 & 110.218566781973 & -4.91856678197304 \tabularnewline
32 & 106 & 103.961169838870 & 2.03883016113022 \tabularnewline
33 & 102 & 100.695653786049 & 1.30434621395054 \tabularnewline
34 & 112.9 & 112.946094328629 & -0.0460943286294935 \tabularnewline
35 & 116.5 & 125.944662047986 & -9.44466204798623 \tabularnewline
36 & 114.8 & 118.477738958324 & -3.67773895832434 \tabularnewline
37 & 100.5 & 108.059179232688 & -7.55917923268757 \tabularnewline
38 & 85.4 & 95.907751752781 & -10.5077517527811 \tabularnewline
39 & 114.6 & 112.977419077033 & 1.62258092296726 \tabularnewline
40 & 109.9 & 105.314182076481 & 4.58581792351919 \tabularnewline
41 & 100.7 & 109.270395269952 & -8.57039526995169 \tabularnewline
42 & 115.5 & 108.905169952549 & 6.5948300474506 \tabularnewline
43 & 100.7 & 102.096080523330 & -1.39608052333041 \tabularnewline
44 & 99 & 100.346625170941 & -1.34662517094054 \tabularnewline
45 & 102.3 & 95.0304539301931 & 7.26954606980685 \tabularnewline
46 & 108.8 & 108.673330620483 & 0.126669379517253 \tabularnewline
47 & 105.9 & 116.527437348416 & -10.6274373484158 \tabularnewline
48 & 113.2 & 110.809731038577 & 2.39026896142300 \tabularnewline
49 & 95.7 & 101.283044609479 & -5.58304460947906 \tabularnewline
50 & 80.9 & 88.4225705544356 & -7.52257055443562 \tabularnewline
51 & 113.9 & 111.887289391268 & 2.01271060873175 \tabularnewline
52 & 98.1 & 105.620839082788 & -7.5208390827876 \tabularnewline
53 & 102.8 & 97.6122601000413 & 5.18773989995869 \tabularnewline
54 & 104.7 & 110.246555160514 & -5.54655516051434 \tabularnewline
55 & 95.9 & 94.6230649890839 & 1.27693501091612 \tabularnewline
56 & 94.6 & 93.8887683122773 & 0.711231687722716 \tabularnewline
57 & 101.6 & 93.2001560864915 & 8.39984391350846 \tabularnewline
58 & 103.9 & 103.453687685606 & 0.446312314393722 \tabularnewline
59 & 110.3 & 105.843734949953 & 4.45626505004702 \tabularnewline
60 & 114.1 & 113.173783403346 & 0.926216596653745 \tabularnewline
\hline
\end{tabular}
%Source: https://freestatistics.org/blog/index.php?pk=63422&T=2

[TABLE]
[ROW][C]Interpolation Forecasts of Exponential Smoothing[/C][/ROW]
[ROW][C]t[/C][C]Observed[/C][C]Fitted[/C][C]Residuals[/C][/ROW]
[ROW][C]13[/C][C]99.8[/C][C]92.998084926643[/C][C]6.80191507335697[/C][/ROW]
[ROW][C]14[/C][C]96[/C][C]92.229967963995[/C][C]3.77003203600505[/C][/ROW]
[ROW][C]15[/C][C]115.9[/C][C]113.809266248514[/C][C]2.09073375148630[/C][/ROW]
[ROW][C]16[/C][C]109.1[/C][C]108.636518125516[/C][C]0.46348187448443[/C][/ROW]
[ROW][C]17[/C][C]117.3[/C][C]117.624969281130[/C][C]-0.324969281130365[/C][/ROW]
[ROW][C]18[/C][C]109.8[/C][C]111.2670794324[/C][C]-1.46707943240001[/C][/ROW]
[ROW][C]19[/C][C]112.8[/C][C]106.533552097769[/C][C]6.26644790223148[/C][/ROW]
[ROW][C]20[/C][C]110.7[/C][C]107.134609916413[/C][C]3.56539008358713[/C][/ROW]
[ROW][C]21[/C][C]100[/C][C]112.948784398470[/C][C]-12.9487843984698[/C][/ROW]
[ROW][C]22[/C][C]113.3[/C][C]112.641097030181[/C][C]0.658902969818968[/C][/ROW]
[ROW][C]23[/C][C]122.4[/C][C]130.817513237740[/C][C]-8.41751323773954[/C][/ROW]
[ROW][C]24[/C][C]112.5[/C][C]127.960805437920[/C][C]-15.4608054379197[/C][/ROW]
[ROW][C]25[/C][C]104.2[/C][C]106.483992710884[/C][C]-2.28399271088448[/C][/ROW]
[ROW][C]26[/C][C]92.5[/C][C]99.3359375733496[/C][C]-6.83593757334964[/C][/ROW]
[ROW][C]27[/C][C]117.2[/C][C]114.696231671484[/C][C]2.50376832851623[/C][/ROW]
[ROW][C]28[/C][C]109.3[/C][C]108.385609539991[/C][C]0.914390460008633[/C][/ROW]
[ROW][C]29[/C][C]106.1[/C][C]116.608663453095[/C][C]-10.5086634530947[/C][/ROW]
[ROW][C]30[/C][C]118.8[/C][C]104.686527039703[/C][C]14.1134729602971[/C][/ROW]
[ROW][C]31[/C][C]105.3[/C][C]110.218566781973[/C][C]-4.91856678197304[/C][/ROW]
[ROW][C]32[/C][C]106[/C][C]103.961169838870[/C][C]2.03883016113022[/C][/ROW]
[ROW][C]33[/C][C]102[/C][C]100.695653786049[/C][C]1.30434621395054[/C][/ROW]
[ROW][C]34[/C][C]112.9[/C][C]112.946094328629[/C][C]-0.0460943286294935[/C][/ROW]
[ROW][C]35[/C][C]116.5[/C][C]125.944662047986[/C][C]-9.44466204798623[/C][/ROW]
[ROW][C]36[/C][C]114.8[/C][C]118.477738958324[/C][C]-3.67773895832434[/C][/ROW]
[ROW][C]37[/C][C]100.5[/C][C]108.059179232688[/C][C]-7.55917923268757[/C][/ROW]
[ROW][C]38[/C][C]85.4[/C][C]95.907751752781[/C][C]-10.5077517527811[/C][/ROW]
[ROW][C]39[/C][C]114.6[/C][C]112.977419077033[/C][C]1.62258092296726[/C][/ROW]
[ROW][C]40[/C][C]109.9[/C][C]105.314182076481[/C][C]4.58581792351919[/C][/ROW]
[ROW][C]41[/C][C]100.7[/C][C]109.270395269952[/C][C]-8.57039526995169[/C][/ROW]
[ROW][C]42[/C][C]115.5[/C][C]108.905169952549[/C][C]6.5948300474506[/C][/ROW]
[ROW][C]43[/C][C]100.7[/C][C]102.096080523330[/C][C]-1.39608052333041[/C][/ROW]
[ROW][C]44[/C][C]99[/C][C]100.346625170941[/C][C]-1.34662517094054[/C][/ROW]
[ROW][C]45[/C][C]102.3[/C][C]95.0304539301931[/C][C]7.26954606980685[/C][/ROW]
[ROW][C]46[/C][C]108.8[/C][C]108.673330620483[/C][C]0.126669379517253[/C][/ROW]
[ROW][C]47[/C][C]105.9[/C][C]116.527437348416[/C][C]-10.6274373484158[/C][/ROW]
[ROW][C]48[/C][C]113.2[/C][C]110.809731038577[/C][C]2.39026896142300[/C][/ROW]
[ROW][C]49[/C][C]95.7[/C][C]101.283044609479[/C][C]-5.58304460947906[/C][/ROW]
[ROW][C]50[/C][C]80.9[/C][C]88.4225705544356[/C][C]-7.52257055443562[/C][/ROW]
[ROW][C]51[/C][C]113.9[/C][C]111.887289391268[/C][C]2.01271060873175[/C][/ROW]
[ROW][C]52[/C][C]98.1[/C][C]105.620839082788[/C][C]-7.5208390827876[/C][/ROW]
[ROW][C]53[/C][C]102.8[/C][C]97.6122601000413[/C][C]5.18773989995869[/C][/ROW]
[ROW][C]54[/C][C]104.7[/C][C]110.246555160514[/C][C]-5.54655516051434[/C][/ROW]
[ROW][C]55[/C][C]95.9[/C][C]94.6230649890839[/C][C]1.27693501091612[/C][/ROW]
[ROW][C]56[/C][C]94.6[/C][C]93.8887683122773[/C][C]0.711231687722716[/C][/ROW]
[ROW][C]57[/C][C]101.6[/C][C]93.2001560864915[/C][C]8.39984391350846[/C][/ROW]
[ROW][C]58[/C][C]103.9[/C][C]103.453687685606[/C][C]0.446312314393722[/C][/ROW]
[ROW][C]59[/C][C]110.3[/C][C]105.843734949953[/C][C]4.45626505004702[/C][/ROW]
[ROW][C]60[/C][C]114.1[/C][C]113.173783403346[/C][C]0.926216596653745[/C][/ROW]
[/TABLE]
Source: https://freestatistics.org/blog/index.php?pk=63422&T=2

Globally Unique Identifier (entire table): ba.freestatistics.org/blog/index.php?pk=63422&T=2

As an alternative you can also use a QR Code:  

The GUIDs for individual cells are displayed in the table below:

Interpolation Forecasts of Exponential Smoothing
tObservedFittedResiduals
1399.892.9980849266436.80191507335697
149692.2299679639953.77003203600505
15115.9113.8092662485142.09073375148630
16109.1108.6365181255160.46348187448443
17117.3117.624969281130-0.324969281130365
18109.8111.2670794324-1.46707943240001
19112.8106.5335520977696.26644790223148
20110.7107.1346099164133.56539008358713
21100112.948784398470-12.9487843984698
22113.3112.6410970301810.658902969818968
23122.4130.817513237740-8.41751323773954
24112.5127.960805437920-15.4608054379197
25104.2106.483992710884-2.28399271088448
2692.599.3359375733496-6.83593757334964
27117.2114.6962316714842.50376832851623
28109.3108.3856095399910.914390460008633
29106.1116.608663453095-10.5086634530947
30118.8104.68652703970314.1134729602971
31105.3110.218566781973-4.91856678197304
32106103.9611698388702.03883016113022
33102100.6956537860491.30434621395054
34112.9112.946094328629-0.0460943286294935
35116.5125.944662047986-9.44466204798623
36114.8118.477738958324-3.67773895832434
37100.5108.059179232688-7.55917923268757
3885.495.907751752781-10.5077517527811
39114.6112.9774190770331.62258092296726
40109.9105.3141820764814.58581792351919
41100.7109.270395269952-8.57039526995169
42115.5108.9051699525496.5948300474506
43100.7102.096080523330-1.39608052333041
4499100.346625170941-1.34662517094054
45102.395.03045393019317.26954606980685
46108.8108.6733306204830.126669379517253
47105.9116.527437348416-10.6274373484158
48113.2110.8097310385772.39026896142300
4995.7101.283044609479-5.58304460947906
5080.988.4225705544356-7.52257055443562
51113.9111.8872893912682.01271060873175
5298.1105.620839082788-7.5208390827876
53102.897.61226010004135.18773989995869
54104.7110.246555160514-5.54655516051434
5595.994.62306498908391.27693501091612
5694.693.88876831227730.711231687722716
57101.693.20015608649158.39984391350846
58103.9103.4536876856060.446312314393722
59110.3105.8437349499534.45626505004702
60114.1113.1737834033460.926216596653745


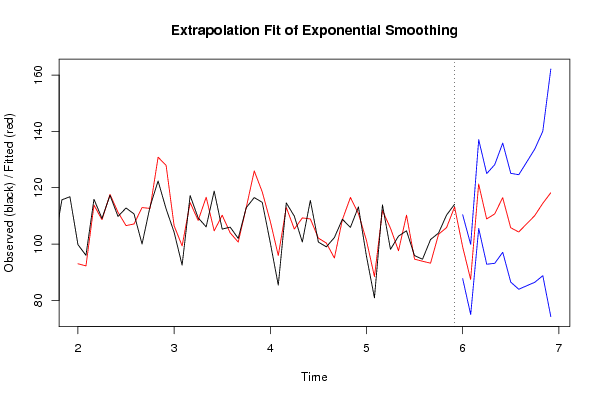
Extrapolation Forecasts of Exponential Smoothing
tForecast95% Lower Bound95% Upper Bound
6199.058132715087587.7211444014213110.395121028754
6287.408719381892674.958257840101399.859180923684
63121.295764595340105.534434680454137.057094510225
64108.91131466001692.8206127123768125.002016607656
65110.67382287264893.1569965419248128.190649203372
66116.46462976285297.0755663407604135.853693184943
67105.78536384342686.468428298939125.102299387912
68104.27594805905083.9426197141613124.609276403938
69107.17308794814385.1942741553576129.151901740929
70110.08482293537986.4198322354816133.749813635277
71114.41786695633388.7705966990604140.065137213606
72118.19101811139774.2164417364099162.165594486384

\begin{tabular}{lllllllll}
\hline
Extrapolation Forecasts of Exponential Smoothing \tabularnewline
t & Forecast & 95% Lower Bound & 95% Upper Bound \tabularnewline
61 & 99.0581327150875 & 87.7211444014213 & 110.395121028754 \tabularnewline
62 & 87.4087193818926 & 74.9582578401013 & 99.859180923684 \tabularnewline
63 & 121.295764595340 & 105.534434680454 & 137.057094510225 \tabularnewline
64 & 108.911314660016 & 92.8206127123768 & 125.002016607656 \tabularnewline
65 & 110.673822872648 & 93.1569965419248 & 128.190649203372 \tabularnewline
66 & 116.464629762852 & 97.0755663407604 & 135.853693184943 \tabularnewline
67 & 105.785363843426 & 86.468428298939 & 125.102299387912 \tabularnewline
68 & 104.275948059050 & 83.9426197141613 & 124.609276403938 \tabularnewline
69 & 107.173087948143 & 85.1942741553576 & 129.151901740929 \tabularnewline
70 & 110.084822935379 & 86.4198322354816 & 133.749813635277 \tabularnewline
71 & 114.417866956333 & 88.7705966990604 & 140.065137213606 \tabularnewline
72 & 118.191018111397 & 74.2164417364099 & 162.165594486384 \tabularnewline
\hline
\end{tabular}
%Source: https://freestatistics.org/blog/index.php?pk=63422&T=3

[TABLE]
[ROW][C]Extrapolation Forecasts of Exponential Smoothing[/C][/ROW]
[ROW][C]t[/C][C]Forecast[/C][C]95% Lower Bound[/C][C]95% Upper Bound[/C][/ROW]
[ROW][C]61[/C][C]99.0581327150875[/C][C]87.7211444014213[/C][C]110.395121028754[/C][/ROW]
[ROW][C]62[/C][C]87.4087193818926[/C][C]74.9582578401013[/C][C]99.859180923684[/C][/ROW]
[ROW][C]63[/C][C]121.295764595340[/C][C]105.534434680454[/C][C]137.057094510225[/C][/ROW]
[ROW][C]64[/C][C]108.911314660016[/C][C]92.8206127123768[/C][C]125.002016607656[/C][/ROW]
[ROW][C]65[/C][C]110.673822872648[/C][C]93.1569965419248[/C][C]128.190649203372[/C][/ROW]
[ROW][C]66[/C][C]116.464629762852[/C][C]97.0755663407604[/C][C]135.853693184943[/C][/ROW]
[ROW][C]67[/C][C]105.785363843426[/C][C]86.468428298939[/C][C]125.102299387912[/C][/ROW]
[ROW][C]68[/C][C]104.275948059050[/C][C]83.9426197141613[/C][C]124.609276403938[/C][/ROW]
[ROW][C]69[/C][C]107.173087948143[/C][C]85.1942741553576[/C][C]129.151901740929[/C][/ROW]
[ROW][C]70[/C][C]110.084822935379[/C][C]86.4198322354816[/C][C]133.749813635277[/C][/ROW]
[ROW][C]71[/C][C]114.417866956333[/C][C]88.7705966990604[/C][C]140.065137213606[/C][/ROW]
[ROW][C]72[/C][C]118.191018111397[/C][C]74.2164417364099[/C][C]162.165594486384[/C][/ROW]
[/TABLE]
Source: https://freestatistics.org/blog/index.php?pk=63422&T=3

Globally Unique Identifier (entire table): ba.freestatistics.org/blog/index.php?pk=63422&T=3

As an alternative you can also use a QR Code:  

The GUIDs for individual cells are displayed in the table below:

Extrapolation Forecasts of Exponential Smoothing
tForecast95% Lower Bound95% Upper Bound
6199.058132715087587.7211444014213110.395121028754
6287.408719381892674.958257840101399.859180923684
63121.295764595340105.534434680454137.057094510225
64108.91131466001692.8206127123768125.002016607656
65110.67382287264893.1569965419248128.190649203372
66116.46462976285297.0755663407604135.853693184943
67105.78536384342686.468428298939125.102299387912
68104.27594805905083.9426197141613124.609276403938
69107.17308794814385.1942741553576129.151901740929
70110.08482293537986.4198322354816133.749813635277
71114.41786695633388.7705966990604140.065137213606
72118.19101811139774.2164417364099162.165594486384


Parameters (Session):
par1 = 12 ; par2 = periodic ; par3 = 0 ; par5 = 1 ; par7 = 1 ; par8 = FALSE ;
Parameters (R input):
par1 = 12 ; par2 = Triple ; par3 = multiplicative ;
R code (references can be found in the software module):
par1 <- as.numeric(par1)
if (par2 == 'Single') K <- 1
if (par2 == 'Double') K <- 2
if (par2 == 'Triple') K <- par1
nx <- length(x)
nxmK <- nx - K
x <- ts(x, frequency = par1)
if (par2 == 'Single') fit <- HoltWinters(x, gamma=0, beta=0)
if (par2 == 'Double') fit <- HoltWinters(x, gamma=0)
if (par2 == 'Triple') fit <- HoltWinters(x, seasonal=par3)
fit
myresid <- x - fit$fitted[,'xhat']
bitmap(file='test1.png')
op <- par(mfrow=c(2,1))
plot(fit,ylab='Observed (black) / Fitted (red)',main='Interpolation Fit of Exponential Smoothing')
plot(myresid,ylab='Residuals',main='Interpolation Prediction Errors')
par(op)
dev.off()
bitmap(file='test2.png')
p <- predict(fit, par1, prediction.interval=TRUE)
np <- length(p[,1])
plot(fit,p,ylab='Observed (black) / Fitted (red)',main='Extrapolation Fit of Exponential Smoothing')
dev.off()
bitmap(file='test3.png')
op <- par(mfrow = c(2,2))
acf(as.numeric(myresid),lag.max = nx/2,main='Residual ACF')
spectrum(myresid,main='Residals Periodogram')
cpgram(myresid,main='Residal Cumulative Periodogram')
qqnorm(myresid,main='Residual Normal QQ Plot')
qqline(myresid)
par(op)
dev.off()
load(file='createtable')
a<-table.start()
a<-table.row.start(a)
a<-table.element(a,'Estimated Parameters of Exponential Smoothing',2,TRUE)
a<-table.row.end(a)
a<-table.row.start(a)
a<-table.element(a,'Parameter',header=TRUE)
a<-table.element(a,'Value',header=TRUE)
a<-table.row.end(a)
a<-table.row.start(a)
a<-table.element(a,'alpha',header=TRUE)
a<-table.element(a,fit$alpha)
a<-table.row.end(a)
a<-table.row.start(a)
a<-table.element(a,'beta',header=TRUE)
a<-table.element(a,fit$beta)
a<-table.row.end(a)
a<-table.row.start(a)
a<-table.element(a,'gamma',header=TRUE)
a<-table.element(a,fit$gamma)
a<-table.row.end(a)
a<-table.end(a)
table.save(a,file='mytable.tab')
a<-table.start()
a<-table.row.start(a)
a<-table.element(a,'Interpolation Forecasts of Exponential Smoothing',4,TRUE)
a<-table.row.end(a)
a<-table.row.start(a)
a<-table.element(a,'t',header=TRUE)
a<-table.element(a,'Observed',header=TRUE)
a<-table.element(a,'Fitted',header=TRUE)
a<-table.element(a,'Residuals',header=TRUE)
a<-table.row.end(a)
for (i in 1:nxmK) {
a<-table.row.start(a)
a<-table.element(a,i+K,header=TRUE)
a<-table.element(a,x[i+K])
a<-table.element(a,fit$fitted[i,'xhat'])
a<-table.element(a,myresid[i])
a<-table.row.end(a)
}
a<-table.end(a)
table.save(a,file='mytable1.tab')
a<-table.start()
a<-table.row.start(a)
a<-table.element(a,'Extrapolation Forecasts of Exponential Smoothing',4,TRUE)
a<-table.row.end(a)
a<-table.row.start(a)
a<-table.element(a,'t',header=TRUE)
a<-table.element(a,'Forecast',header=TRUE)
a<-table.element(a,'95% Lower Bound',header=TRUE)
a<-table.element(a,'95% Upper Bound',header=TRUE)
a<-table.row.end(a)
for (i in 1:np) {
a<-table.row.start(a)
a<-table.element(a,nx+i,header=TRUE)
a<-table.element(a,p[i,'fit'])
a<-table.element(a,p[i,'lwr'])
a<-table.element(a,p[i,'upr'])
a<-table.row.end(a)
}
a<-table.end(a)
table.save(a,file='mytable2.tab')