Free Statistics

of Irreproducible Research!

Author's title

Author*The author of this computation has been verified*
R Software Modulerwasp_autocorrelation.wasp
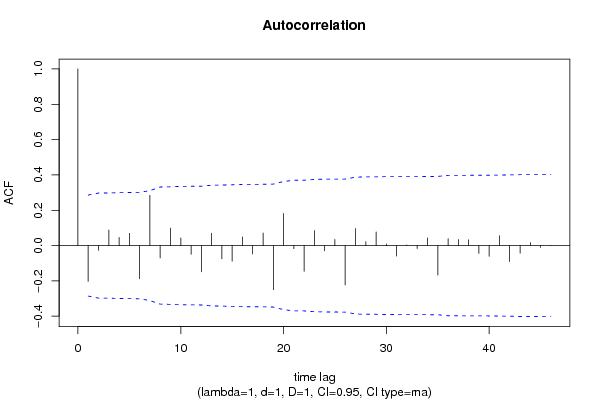
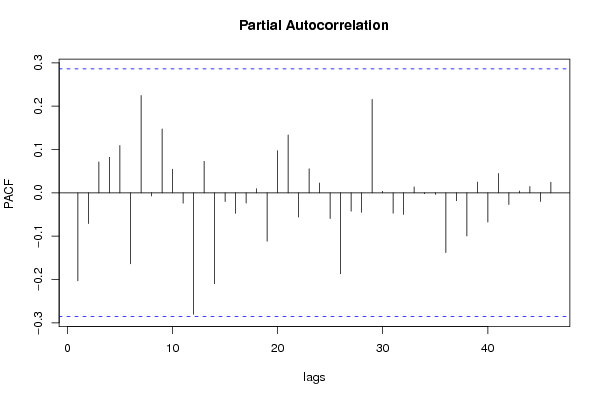
Title produced by software(Partial) Autocorrelation Function
Date of computationFri, 04 Dec 2009 05:36:45 -0700
Cite this page as followsStatistical Computations at FreeStatistics.org, Office for Research Development and Education, URL https://freestatistics.org/blog/index.php?v=date/2009/Dec/04/t1259930255jtkd42ta3kz0ymi.htm/, Retrieved Sat, 27 Apr 2024 14:03:17 +0000
Statistical Computations at FreeStatistics.org, Office for Research Development and Education, URL https://freestatistics.org/blog/index.php?pk=63424, Retrieved Sat, 27 Apr 2024 14:03:17 +0000
QR Codes:

Original text written by user:
IsPrivate?No (this computation is public)
User-defined keywords
Estimated Impact103
Family? (F = Feedback message, R = changed R code, M = changed R Module, P = changed Parameters, D = changed Data)
-     [Univariate Data Series] [data set] [2008-12-01 19:54:57] [b98453cac15ba1066b407e146608df68]
- RMP   [(Partial) Autocorrelation Function] [] [2009-11-27 14:46:03] [b98453cac15ba1066b407e146608df68]
- R PD      [(Partial) Autocorrelation Function] [ws9] [2009-12-04 12:36:45] [b243db81ea3e1f02fb3382887fb0f701] [Current]
Feedback Forum

Post a new message
Dataseries X:
5594
5585
5710
5511
5403
5826
5884
5965
5960
6064
6046
5954
5952
5960
5983
5996
6021
6094
6202
6276
6306
6342
6345
6328
6191
6261
6253
6198
6247
6293
6381
6448
6470
6516
6532
6526
6533
6498
6507
6464
6453
6468
6497
6808
6793
6907
6792
6757
6734
6654
6589
6469
6521
6448
6410
6528
6445
6458
6215
6167


Summary of computational transaction
Raw Inputview raw input (R code)
Raw Outputview raw output of R engine
Computing time1 seconds
R Server'Gwilym Jenkins' @ 72.249.127.135

\begin{tabular}{lllllllll}
\hline
Summary of computational transaction \tabularnewline
Raw Input & view raw input (R code)  \tabularnewline
Raw Output & view raw output of R engine  \tabularnewline
Computing time & 1 seconds \tabularnewline
R Server & 'Gwilym Jenkins' @ 72.249.127.135 \tabularnewline
\hline
\end{tabular}
%Source: https://freestatistics.org/blog/index.php?pk=63424&T=0

[TABLE]
[ROW][C]Summary of computational transaction[/C][/ROW]
[ROW][C]Raw Input[/C][C]view raw input (R code) [/C][/ROW]
[ROW][C]Raw Output[/C][C]view raw output of R engine [/C][/ROW]
[ROW][C]Computing time[/C][C]1 seconds[/C][/ROW]
[ROW][C]R Server[/C][C]'Gwilym Jenkins' @ 72.249.127.135[/C][/ROW]
[/TABLE]
Source: https://freestatistics.org/blog/index.php?pk=63424&T=0

Globally Unique Identifier (entire table): ba.freestatistics.org/blog/index.php?pk=63424&T=0

As an alternative you can also use a QR Code:  

The GUIDs for individual cells are displayed in the table below:

Summary of computational transaction
Raw Inputview raw input (R code)
Raw Outputview raw output of R engine
Computing time1 seconds
R Server'Gwilym Jenkins' @ 72.249.127.135


Autocorrelation Function
Time lag kACF(k)T-STATP-value
1-0.203267-1.39350.085007
2-0.026792-0.18370.427528
30.08810.6040.274379
40.0459680.31510.377025
50.0691920.47440.31872
6-0.187889-1.28810.102008
70.2847121.95190.028462
8-0.070229-0.48150.316209
90.098940.67830.250454
100.0435390.29850.383324
11-0.049644-0.34030.367558
12-0.148797-1.02010.156452
130.0703270.48210.315973
14-0.07476-0.51250.305341
15-0.088585-0.60730.273284
160.0488320.33480.369641
17-0.046983-0.32210.374403
180.071170.48790.313939
19-0.249998-1.71390.046568
200.1817621.24610.109452
21-0.017605-0.12070.452223
22-0.145687-0.99880.161507
230.0852790.58460.280791
24-0.029689-0.20350.419797
250.0350540.24030.405564
26-0.222588-1.5260.066858
270.0960680.65860.25668
280.0219410.15040.440539
290.0774660.53110.298933
300.0091270.06260.475186
31-0.059084-0.40510.343636
320.0035740.02450.490279
33-0.016772-0.1150.454473
340.0431250.29560.384401
35-0.166694-1.14280.129455
360.0389840.26730.395218
370.0343530.23550.407417
380.0325540.22320.412182
39-0.044202-0.3030.381602
40-0.060711-0.41620.339574
410.0562780.38580.350683
42-0.090454-0.62010.269086
43-0.043023-0.29490.384666
440.0168570.11560.454244
45-0.01035-0.0710.471868
466e-040.00410.498367
47NANANA
48NANANA

\begin{tabular}{lllllllll}
\hline
Autocorrelation Function \tabularnewline
Time lag k & ACF(k) & T-STAT & P-value \tabularnewline
1 & -0.203267 & -1.3935 & 0.085007 \tabularnewline
2 & -0.026792 & -0.1837 & 0.427528 \tabularnewline
3 & 0.0881 & 0.604 & 0.274379 \tabularnewline
4 & 0.045968 & 0.3151 & 0.377025 \tabularnewline
5 & 0.069192 & 0.4744 & 0.31872 \tabularnewline
6 & -0.187889 & -1.2881 & 0.102008 \tabularnewline
7 & 0.284712 & 1.9519 & 0.028462 \tabularnewline
8 & -0.070229 & -0.4815 & 0.316209 \tabularnewline
9 & 0.09894 & 0.6783 & 0.250454 \tabularnewline
10 & 0.043539 & 0.2985 & 0.383324 \tabularnewline
11 & -0.049644 & -0.3403 & 0.367558 \tabularnewline
12 & -0.148797 & -1.0201 & 0.156452 \tabularnewline
13 & 0.070327 & 0.4821 & 0.315973 \tabularnewline
14 & -0.07476 & -0.5125 & 0.305341 \tabularnewline
15 & -0.088585 & -0.6073 & 0.273284 \tabularnewline
16 & 0.048832 & 0.3348 & 0.369641 \tabularnewline
17 & -0.046983 & -0.3221 & 0.374403 \tabularnewline
18 & 0.07117 & 0.4879 & 0.313939 \tabularnewline
19 & -0.249998 & -1.7139 & 0.046568 \tabularnewline
20 & 0.181762 & 1.2461 & 0.109452 \tabularnewline
21 & -0.017605 & -0.1207 & 0.452223 \tabularnewline
22 & -0.145687 & -0.9988 & 0.161507 \tabularnewline
23 & 0.085279 & 0.5846 & 0.280791 \tabularnewline
24 & -0.029689 & -0.2035 & 0.419797 \tabularnewline
25 & 0.035054 & 0.2403 & 0.405564 \tabularnewline
26 & -0.222588 & -1.526 & 0.066858 \tabularnewline
27 & 0.096068 & 0.6586 & 0.25668 \tabularnewline
28 & 0.021941 & 0.1504 & 0.440539 \tabularnewline
29 & 0.077466 & 0.5311 & 0.298933 \tabularnewline
30 & 0.009127 & 0.0626 & 0.475186 \tabularnewline
31 & -0.059084 & -0.4051 & 0.343636 \tabularnewline
32 & 0.003574 & 0.0245 & 0.490279 \tabularnewline
33 & -0.016772 & -0.115 & 0.454473 \tabularnewline
34 & 0.043125 & 0.2956 & 0.384401 \tabularnewline
35 & -0.166694 & -1.1428 & 0.129455 \tabularnewline
36 & 0.038984 & 0.2673 & 0.395218 \tabularnewline
37 & 0.034353 & 0.2355 & 0.407417 \tabularnewline
38 & 0.032554 & 0.2232 & 0.412182 \tabularnewline
39 & -0.044202 & -0.303 & 0.381602 \tabularnewline
40 & -0.060711 & -0.4162 & 0.339574 \tabularnewline
41 & 0.056278 & 0.3858 & 0.350683 \tabularnewline
42 & -0.090454 & -0.6201 & 0.269086 \tabularnewline
43 & -0.043023 & -0.2949 & 0.384666 \tabularnewline
44 & 0.016857 & 0.1156 & 0.454244 \tabularnewline
45 & -0.01035 & -0.071 & 0.471868 \tabularnewline
46 & 6e-04 & 0.0041 & 0.498367 \tabularnewline
47 & NA & NA & NA \tabularnewline
48 & NA & NA & NA \tabularnewline
\hline
\end{tabular}
%Source: https://freestatistics.org/blog/index.php?pk=63424&T=1

[TABLE]
[ROW][C]Autocorrelation Function[/C][/ROW]
[ROW][C]Time lag k[/C][C]ACF(k)[/C][C]T-STAT[/C][C]P-value[/C][/ROW]
[ROW][C]1[/C][C]-0.203267[/C][C]-1.3935[/C][C]0.085007[/C][/ROW]
[ROW][C]2[/C][C]-0.026792[/C][C]-0.1837[/C][C]0.427528[/C][/ROW]
[ROW][C]3[/C][C]0.0881[/C][C]0.604[/C][C]0.274379[/C][/ROW]
[ROW][C]4[/C][C]0.045968[/C][C]0.3151[/C][C]0.377025[/C][/ROW]
[ROW][C]5[/C][C]0.069192[/C][C]0.4744[/C][C]0.31872[/C][/ROW]
[ROW][C]6[/C][C]-0.187889[/C][C]-1.2881[/C][C]0.102008[/C][/ROW]
[ROW][C]7[/C][C]0.284712[/C][C]1.9519[/C][C]0.028462[/C][/ROW]
[ROW][C]8[/C][C]-0.070229[/C][C]-0.4815[/C][C]0.316209[/C][/ROW]
[ROW][C]9[/C][C]0.09894[/C][C]0.6783[/C][C]0.250454[/C][/ROW]
[ROW][C]10[/C][C]0.043539[/C][C]0.2985[/C][C]0.383324[/C][/ROW]
[ROW][C]11[/C][C]-0.049644[/C][C]-0.3403[/C][C]0.367558[/C][/ROW]
[ROW][C]12[/C][C]-0.148797[/C][C]-1.0201[/C][C]0.156452[/C][/ROW]
[ROW][C]13[/C][C]0.070327[/C][C]0.4821[/C][C]0.315973[/C][/ROW]
[ROW][C]14[/C][C]-0.07476[/C][C]-0.5125[/C][C]0.305341[/C][/ROW]
[ROW][C]15[/C][C]-0.088585[/C][C]-0.6073[/C][C]0.273284[/C][/ROW]
[ROW][C]16[/C][C]0.048832[/C][C]0.3348[/C][C]0.369641[/C][/ROW]
[ROW][C]17[/C][C]-0.046983[/C][C]-0.3221[/C][C]0.374403[/C][/ROW]
[ROW][C]18[/C][C]0.07117[/C][C]0.4879[/C][C]0.313939[/C][/ROW]
[ROW][C]19[/C][C]-0.249998[/C][C]-1.7139[/C][C]0.046568[/C][/ROW]
[ROW][C]20[/C][C]0.181762[/C][C]1.2461[/C][C]0.109452[/C][/ROW]
[ROW][C]21[/C][C]-0.017605[/C][C]-0.1207[/C][C]0.452223[/C][/ROW]
[ROW][C]22[/C][C]-0.145687[/C][C]-0.9988[/C][C]0.161507[/C][/ROW]
[ROW][C]23[/C][C]0.085279[/C][C]0.5846[/C][C]0.280791[/C][/ROW]
[ROW][C]24[/C][C]-0.029689[/C][C]-0.2035[/C][C]0.419797[/C][/ROW]
[ROW][C]25[/C][C]0.035054[/C][C]0.2403[/C][C]0.405564[/C][/ROW]
[ROW][C]26[/C][C]-0.222588[/C][C]-1.526[/C][C]0.066858[/C][/ROW]
[ROW][C]27[/C][C]0.096068[/C][C]0.6586[/C][C]0.25668[/C][/ROW]
[ROW][C]28[/C][C]0.021941[/C][C]0.1504[/C][C]0.440539[/C][/ROW]
[ROW][C]29[/C][C]0.077466[/C][C]0.5311[/C][C]0.298933[/C][/ROW]
[ROW][C]30[/C][C]0.009127[/C][C]0.0626[/C][C]0.475186[/C][/ROW]
[ROW][C]31[/C][C]-0.059084[/C][C]-0.4051[/C][C]0.343636[/C][/ROW]
[ROW][C]32[/C][C]0.003574[/C][C]0.0245[/C][C]0.490279[/C][/ROW]
[ROW][C]33[/C][C]-0.016772[/C][C]-0.115[/C][C]0.454473[/C][/ROW]
[ROW][C]34[/C][C]0.043125[/C][C]0.2956[/C][C]0.384401[/C][/ROW]
[ROW][C]35[/C][C]-0.166694[/C][C]-1.1428[/C][C]0.129455[/C][/ROW]
[ROW][C]36[/C][C]0.038984[/C][C]0.2673[/C][C]0.395218[/C][/ROW]
[ROW][C]37[/C][C]0.034353[/C][C]0.2355[/C][C]0.407417[/C][/ROW]
[ROW][C]38[/C][C]0.032554[/C][C]0.2232[/C][C]0.412182[/C][/ROW]
[ROW][C]39[/C][C]-0.044202[/C][C]-0.303[/C][C]0.381602[/C][/ROW]
[ROW][C]40[/C][C]-0.060711[/C][C]-0.4162[/C][C]0.339574[/C][/ROW]
[ROW][C]41[/C][C]0.056278[/C][C]0.3858[/C][C]0.350683[/C][/ROW]
[ROW][C]42[/C][C]-0.090454[/C][C]-0.6201[/C][C]0.269086[/C][/ROW]
[ROW][C]43[/C][C]-0.043023[/C][C]-0.2949[/C][C]0.384666[/C][/ROW]
[ROW][C]44[/C][C]0.016857[/C][C]0.1156[/C][C]0.454244[/C][/ROW]
[ROW][C]45[/C][C]-0.01035[/C][C]-0.071[/C][C]0.471868[/C][/ROW]
[ROW][C]46[/C][C]6e-04[/C][C]0.0041[/C][C]0.498367[/C][/ROW]
[ROW][C]47[/C][C]NA[/C][C]NA[/C][C]NA[/C][/ROW]
[ROW][C]48[/C][C]NA[/C][C]NA[/C][C]NA[/C][/ROW]
[/TABLE]
Source: https://freestatistics.org/blog/index.php?pk=63424&T=1

Globally Unique Identifier (entire table): ba.freestatistics.org/blog/index.php?pk=63424&T=1

As an alternative you can also use a QR Code:  

The GUIDs for individual cells are displayed in the table below:

Autocorrelation Function
Time lag kACF(k)T-STATP-value
1-0.203267-1.39350.085007
2-0.026792-0.18370.427528
30.08810.6040.274379
40.0459680.31510.377025
50.0691920.47440.31872
6-0.187889-1.28810.102008
70.2847121.95190.028462
8-0.070229-0.48150.316209
90.098940.67830.250454
100.0435390.29850.383324
11-0.049644-0.34030.367558
12-0.148797-1.02010.156452
130.0703270.48210.315973
14-0.07476-0.51250.305341
15-0.088585-0.60730.273284
160.0488320.33480.369641
17-0.046983-0.32210.374403
180.071170.48790.313939
19-0.249998-1.71390.046568
200.1817621.24610.109452
21-0.017605-0.12070.452223
22-0.145687-0.99880.161507
230.0852790.58460.280791
24-0.029689-0.20350.419797
250.0350540.24030.405564
26-0.222588-1.5260.066858
270.0960680.65860.25668
280.0219410.15040.440539
290.0774660.53110.298933
300.0091270.06260.475186
31-0.059084-0.40510.343636
320.0035740.02450.490279
33-0.016772-0.1150.454473
340.0431250.29560.384401
35-0.166694-1.14280.129455
360.0389840.26730.395218
370.0343530.23550.407417
380.0325540.22320.412182
39-0.044202-0.3030.381602
40-0.060711-0.41620.339574
410.0562780.38580.350683
42-0.090454-0.62010.269086
43-0.043023-0.29490.384666
440.0168570.11560.454244
45-0.01035-0.0710.471868
466e-040.00410.498367
47NANANA
48NANANA


Partial Autocorrelation Function
Time lag kPACF(k)T-STATP-value
1-0.203267-1.39350.085007
2-0.071045-0.48710.314239
30.0711080.48750.314087
40.0818410.56110.288707
50.1089860.74720.229342
6-0.163903-1.12370.133431
70.2244841.5390.065257
8-0.007264-0.04980.480246
90.147371.01030.158759
100.0544990.37360.355181
11-0.024075-0.1650.434807
12-0.280165-1.92070.030423
130.0726850.49830.310298
14-0.209862-1.43870.078425
15-0.020346-0.13950.444832
16-0.047238-0.32380.373745
17-0.023583-0.16170.436125
180.0095910.06580.473926
19-0.111571-0.76490.224079
200.0970830.66560.254471
210.1336190.9160.182161
22-0.056141-0.38490.35103
230.0552450.37870.353293
240.022370.15340.439384
25-0.059388-0.40710.342875
26-0.186987-1.28190.103079
27-0.042483-0.29120.386071
28-0.045045-0.30880.379415
290.2155761.47790.07305
300.0032910.02260.491047
31-0.046935-0.32180.374528
32-0.049972-0.34260.366718
330.0135010.09260.463325
34-0.002024-0.01390.494494
35-0.003732-0.02560.489847
36-0.13787-0.94520.174698
37-0.018188-0.12470.45065
38-0.099597-0.68280.249041
390.02490.17070.432594
40-0.067479-0.46260.322889
410.0447130.30650.380276
42-0.027234-0.18670.426348
430.0040490.02780.488987
440.0143440.09830.461043
45-0.020143-0.13810.445377
460.0244020.16730.433929
47NANANA
48NANANA

\begin{tabular}{lllllllll}
\hline
Partial Autocorrelation Function \tabularnewline
Time lag k & PACF(k) & T-STAT & P-value \tabularnewline
1 & -0.203267 & -1.3935 & 0.085007 \tabularnewline
2 & -0.071045 & -0.4871 & 0.314239 \tabularnewline
3 & 0.071108 & 0.4875 & 0.314087 \tabularnewline
4 & 0.081841 & 0.5611 & 0.288707 \tabularnewline
5 & 0.108986 & 0.7472 & 0.229342 \tabularnewline
6 & -0.163903 & -1.1237 & 0.133431 \tabularnewline
7 & 0.224484 & 1.539 & 0.065257 \tabularnewline
8 & -0.007264 & -0.0498 & 0.480246 \tabularnewline
9 & 0.14737 & 1.0103 & 0.158759 \tabularnewline
10 & 0.054499 & 0.3736 & 0.355181 \tabularnewline
11 & -0.024075 & -0.165 & 0.434807 \tabularnewline
12 & -0.280165 & -1.9207 & 0.030423 \tabularnewline
13 & 0.072685 & 0.4983 & 0.310298 \tabularnewline
14 & -0.209862 & -1.4387 & 0.078425 \tabularnewline
15 & -0.020346 & -0.1395 & 0.444832 \tabularnewline
16 & -0.047238 & -0.3238 & 0.373745 \tabularnewline
17 & -0.023583 & -0.1617 & 0.436125 \tabularnewline
18 & 0.009591 & 0.0658 & 0.473926 \tabularnewline
19 & -0.111571 & -0.7649 & 0.224079 \tabularnewline
20 & 0.097083 & 0.6656 & 0.254471 \tabularnewline
21 & 0.133619 & 0.916 & 0.182161 \tabularnewline
22 & -0.056141 & -0.3849 & 0.35103 \tabularnewline
23 & 0.055245 & 0.3787 & 0.353293 \tabularnewline
24 & 0.02237 & 0.1534 & 0.439384 \tabularnewline
25 & -0.059388 & -0.4071 & 0.342875 \tabularnewline
26 & -0.186987 & -1.2819 & 0.103079 \tabularnewline
27 & -0.042483 & -0.2912 & 0.386071 \tabularnewline
28 & -0.045045 & -0.3088 & 0.379415 \tabularnewline
29 & 0.215576 & 1.4779 & 0.07305 \tabularnewline
30 & 0.003291 & 0.0226 & 0.491047 \tabularnewline
31 & -0.046935 & -0.3218 & 0.374528 \tabularnewline
32 & -0.049972 & -0.3426 & 0.366718 \tabularnewline
33 & 0.013501 & 0.0926 & 0.463325 \tabularnewline
34 & -0.002024 & -0.0139 & 0.494494 \tabularnewline
35 & -0.003732 & -0.0256 & 0.489847 \tabularnewline
36 & -0.13787 & -0.9452 & 0.174698 \tabularnewline
37 & -0.018188 & -0.1247 & 0.45065 \tabularnewline
38 & -0.099597 & -0.6828 & 0.249041 \tabularnewline
39 & 0.0249 & 0.1707 & 0.432594 \tabularnewline
40 & -0.067479 & -0.4626 & 0.322889 \tabularnewline
41 & 0.044713 & 0.3065 & 0.380276 \tabularnewline
42 & -0.027234 & -0.1867 & 0.426348 \tabularnewline
43 & 0.004049 & 0.0278 & 0.488987 \tabularnewline
44 & 0.014344 & 0.0983 & 0.461043 \tabularnewline
45 & -0.020143 & -0.1381 & 0.445377 \tabularnewline
46 & 0.024402 & 0.1673 & 0.433929 \tabularnewline
47 & NA & NA & NA \tabularnewline
48 & NA & NA & NA \tabularnewline
\hline
\end{tabular}
%Source: https://freestatistics.org/blog/index.php?pk=63424&T=2

[TABLE]
[ROW][C]Partial Autocorrelation Function[/C][/ROW]
[ROW][C]Time lag k[/C][C]PACF(k)[/C][C]T-STAT[/C][C]P-value[/C][/ROW]
[ROW][C]1[/C][C]-0.203267[/C][C]-1.3935[/C][C]0.085007[/C][/ROW]
[ROW][C]2[/C][C]-0.071045[/C][C]-0.4871[/C][C]0.314239[/C][/ROW]
[ROW][C]3[/C][C]0.071108[/C][C]0.4875[/C][C]0.314087[/C][/ROW]
[ROW][C]4[/C][C]0.081841[/C][C]0.5611[/C][C]0.288707[/C][/ROW]
[ROW][C]5[/C][C]0.108986[/C][C]0.7472[/C][C]0.229342[/C][/ROW]
[ROW][C]6[/C][C]-0.163903[/C][C]-1.1237[/C][C]0.133431[/C][/ROW]
[ROW][C]7[/C][C]0.224484[/C][C]1.539[/C][C]0.065257[/C][/ROW]
[ROW][C]8[/C][C]-0.007264[/C][C]-0.0498[/C][C]0.480246[/C][/ROW]
[ROW][C]9[/C][C]0.14737[/C][C]1.0103[/C][C]0.158759[/C][/ROW]
[ROW][C]10[/C][C]0.054499[/C][C]0.3736[/C][C]0.355181[/C][/ROW]
[ROW][C]11[/C][C]-0.024075[/C][C]-0.165[/C][C]0.434807[/C][/ROW]
[ROW][C]12[/C][C]-0.280165[/C][C]-1.9207[/C][C]0.030423[/C][/ROW]
[ROW][C]13[/C][C]0.072685[/C][C]0.4983[/C][C]0.310298[/C][/ROW]
[ROW][C]14[/C][C]-0.209862[/C][C]-1.4387[/C][C]0.078425[/C][/ROW]
[ROW][C]15[/C][C]-0.020346[/C][C]-0.1395[/C][C]0.444832[/C][/ROW]
[ROW][C]16[/C][C]-0.047238[/C][C]-0.3238[/C][C]0.373745[/C][/ROW]
[ROW][C]17[/C][C]-0.023583[/C][C]-0.1617[/C][C]0.436125[/C][/ROW]
[ROW][C]18[/C][C]0.009591[/C][C]0.0658[/C][C]0.473926[/C][/ROW]
[ROW][C]19[/C][C]-0.111571[/C][C]-0.7649[/C][C]0.224079[/C][/ROW]
[ROW][C]20[/C][C]0.097083[/C][C]0.6656[/C][C]0.254471[/C][/ROW]
[ROW][C]21[/C][C]0.133619[/C][C]0.916[/C][C]0.182161[/C][/ROW]
[ROW][C]22[/C][C]-0.056141[/C][C]-0.3849[/C][C]0.35103[/C][/ROW]
[ROW][C]23[/C][C]0.055245[/C][C]0.3787[/C][C]0.353293[/C][/ROW]
[ROW][C]24[/C][C]0.02237[/C][C]0.1534[/C][C]0.439384[/C][/ROW]
[ROW][C]25[/C][C]-0.059388[/C][C]-0.4071[/C][C]0.342875[/C][/ROW]
[ROW][C]26[/C][C]-0.186987[/C][C]-1.2819[/C][C]0.103079[/C][/ROW]
[ROW][C]27[/C][C]-0.042483[/C][C]-0.2912[/C][C]0.386071[/C][/ROW]
[ROW][C]28[/C][C]-0.045045[/C][C]-0.3088[/C][C]0.379415[/C][/ROW]
[ROW][C]29[/C][C]0.215576[/C][C]1.4779[/C][C]0.07305[/C][/ROW]
[ROW][C]30[/C][C]0.003291[/C][C]0.0226[/C][C]0.491047[/C][/ROW]
[ROW][C]31[/C][C]-0.046935[/C][C]-0.3218[/C][C]0.374528[/C][/ROW]
[ROW][C]32[/C][C]-0.049972[/C][C]-0.3426[/C][C]0.366718[/C][/ROW]
[ROW][C]33[/C][C]0.013501[/C][C]0.0926[/C][C]0.463325[/C][/ROW]
[ROW][C]34[/C][C]-0.002024[/C][C]-0.0139[/C][C]0.494494[/C][/ROW]
[ROW][C]35[/C][C]-0.003732[/C][C]-0.0256[/C][C]0.489847[/C][/ROW]
[ROW][C]36[/C][C]-0.13787[/C][C]-0.9452[/C][C]0.174698[/C][/ROW]
[ROW][C]37[/C][C]-0.018188[/C][C]-0.1247[/C][C]0.45065[/C][/ROW]
[ROW][C]38[/C][C]-0.099597[/C][C]-0.6828[/C][C]0.249041[/C][/ROW]
[ROW][C]39[/C][C]0.0249[/C][C]0.1707[/C][C]0.432594[/C][/ROW]
[ROW][C]40[/C][C]-0.067479[/C][C]-0.4626[/C][C]0.322889[/C][/ROW]
[ROW][C]41[/C][C]0.044713[/C][C]0.3065[/C][C]0.380276[/C][/ROW]
[ROW][C]42[/C][C]-0.027234[/C][C]-0.1867[/C][C]0.426348[/C][/ROW]
[ROW][C]43[/C][C]0.004049[/C][C]0.0278[/C][C]0.488987[/C][/ROW]
[ROW][C]44[/C][C]0.014344[/C][C]0.0983[/C][C]0.461043[/C][/ROW]
[ROW][C]45[/C][C]-0.020143[/C][C]-0.1381[/C][C]0.445377[/C][/ROW]
[ROW][C]46[/C][C]0.024402[/C][C]0.1673[/C][C]0.433929[/C][/ROW]
[ROW][C]47[/C][C]NA[/C][C]NA[/C][C]NA[/C][/ROW]
[ROW][C]48[/C][C]NA[/C][C]NA[/C][C]NA[/C][/ROW]
[/TABLE]
Source: https://freestatistics.org/blog/index.php?pk=63424&T=2

Globally Unique Identifier (entire table): ba.freestatistics.org/blog/index.php?pk=63424&T=2

As an alternative you can also use a QR Code:  

The GUIDs for individual cells are displayed in the table below:

Partial Autocorrelation Function
Time lag kPACF(k)T-STATP-value
1-0.203267-1.39350.085007
2-0.071045-0.48710.314239
30.0711080.48750.314087
40.0818410.56110.288707
50.1089860.74720.229342
6-0.163903-1.12370.133431
70.2244841.5390.065257
8-0.007264-0.04980.480246
90.147371.01030.158759
100.0544990.37360.355181
11-0.024075-0.1650.434807
12-0.280165-1.92070.030423
130.0726850.49830.310298
14-0.209862-1.43870.078425
15-0.020346-0.13950.444832
16-0.047238-0.32380.373745
17-0.023583-0.16170.436125
180.0095910.06580.473926
19-0.111571-0.76490.224079
200.0970830.66560.254471
210.1336190.9160.182161
22-0.056141-0.38490.35103
230.0552450.37870.353293
240.022370.15340.439384
25-0.059388-0.40710.342875
26-0.186987-1.28190.103079
27-0.042483-0.29120.386071
28-0.045045-0.30880.379415
290.2155761.47790.07305
300.0032910.02260.491047
31-0.046935-0.32180.374528
32-0.049972-0.34260.366718
330.0135010.09260.463325
34-0.002024-0.01390.494494
35-0.003732-0.02560.489847
36-0.13787-0.94520.174698
37-0.018188-0.12470.45065
38-0.099597-0.68280.249041
390.02490.17070.432594
40-0.067479-0.46260.322889
410.0447130.30650.380276
42-0.027234-0.18670.426348
430.0040490.02780.488987
440.0143440.09830.461043
45-0.020143-0.13810.445377
460.0244020.16730.433929
47NANANA
48NANANA


Parameters (Session):
par1 = 48 ; par2 = 1 ; par3 = 1 ; par4 = 1 ; par5 = 12 ; par6 = MA ; par7 = 0.95 ;
Parameters (R input):
par1 = 48 ; par2 = 1 ; par3 = 1 ; par4 = 1 ; par5 = 12 ; par6 = MA ; par7 = 0.95 ;
R code (references can be found in the software module):
if (par1 == 'Default') {
par1 = 10*log10(length(x))
} else {
par1 <- as.numeric(par1)
}
par2 <- as.numeric(par2)
par3 <- as.numeric(par3)
par4 <- as.numeric(par4)
par5 <- as.numeric(par5)
if (par6 == 'White Noise') par6 <- 'white' else par6 <- 'ma'
par7 <- as.numeric(par7)
if (par2 == 0) {
x <- log(x)
} else {
x <- (x ^ par2 - 1) / par2
}
if (par3 > 0) x <- diff(x,lag=1,difference=par3)
if (par4 > 0) x <- diff(x,lag=par5,difference=par4)
bitmap(file='pic1.png')
racf <- acf(x, par1, main='Autocorrelation', xlab='time lag', ylab='ACF', ci.type=par6, ci=par7, sub=paste('(lambda=',par2,', d=',par3,', D=',par4,', CI=', par7, ', CI type=',par6,')',sep=''))
dev.off()
bitmap(file='pic2.png')
rpacf <- pacf(x,par1,main='Partial Autocorrelation',xlab='lags',ylab='PACF')
dev.off()
(myacf <- c(racf$acf))
(mypacf <- c(rpacf$acf))
lengthx <- length(x)
sqrtn <- sqrt(lengthx)
load(file='createtable')
a<-table.start()
a<-table.row.start(a)
a<-table.element(a,'Autocorrelation Function',4,TRUE)
a<-table.row.end(a)
a<-table.row.start(a)
a<-table.element(a,'Time lag k',header=TRUE)
a<-table.element(a,hyperlink('basics.htm','ACF(k)','click here for more information about the Autocorrelation Function'),header=TRUE)
a<-table.element(a,'T-STAT',header=TRUE)
a<-table.element(a,'P-value',header=TRUE)
a<-table.row.end(a)
for (i in 2:(par1+1)) {
a<-table.row.start(a)
a<-table.element(a,i-1,header=TRUE)
a<-table.element(a,round(myacf[i],6))
mytstat <- myacf[i]*sqrtn
a<-table.element(a,round(mytstat,4))
a<-table.element(a,round(1-pt(abs(mytstat),lengthx),6))
a<-table.row.end(a)
}
a<-table.end(a)
table.save(a,file='mytable.tab')
a<-table.start()
a<-table.row.start(a)
a<-table.element(a,'Partial Autocorrelation Function',4,TRUE)
a<-table.row.end(a)
a<-table.row.start(a)
a<-table.element(a,'Time lag k',header=TRUE)
a<-table.element(a,hyperlink('basics.htm','PACF(k)','click here for more information about the Partial Autocorrelation Function'),header=TRUE)
a<-table.element(a,'T-STAT',header=TRUE)
a<-table.element(a,'P-value',header=TRUE)
a<-table.row.end(a)
for (i in 1:par1) {
a<-table.row.start(a)
a<-table.element(a,i,header=TRUE)
a<-table.element(a,round(mypacf[i],6))
mytstat <- mypacf[i]*sqrtn
a<-table.element(a,round(mytstat,4))
a<-table.element(a,round(1-pt(abs(mytstat),lengthx),6))
a<-table.row.end(a)
}
a<-table.end(a)
table.save(a,file='mytable1.tab')