Free Statistics

of Irreproducible Research!

Author's title

Author*The author of this computation has been verified*
R Software Modulerwasp_multipleregression.wasp
Title produced by softwareMultiple Regression
Date of computationFri, 04 Dec 2009 05:40:25 -0700
Cite this page as followsStatistical Computations at FreeStatistics.org, Office for Research Development and Education, URL https://freestatistics.org/blog/index.php?v=date/2009/Dec/04/t1259930512htn416bjiw2fhg3.htm/, Retrieved Sat, 27 Apr 2024 16:47:49 +0000
Statistical Computations at FreeStatistics.org, Office for Research Development and Education, URL https://freestatistics.org/blog/index.php?pk=63428, Retrieved Sat, 27 Apr 2024 16:47:49 +0000
QR Codes:

Original text written by user:
IsPrivate?No (this computation is public)
User-defined keywords
Estimated Impact91
Family? (F = Feedback message, R = changed R code, M = changed R Module, P = changed Parameters, D = changed Data)
-     [Notched Boxplots] [3/11/2009] [2009-11-02 21:10:41] [b98453cac15ba1066b407e146608df68]
- RMPD    [Multiple Regression] [Paper:Bryan Beute...] [2009-12-04 12:40:25] [b32ceebc68d054278e6bda97f3d57f91] [Current]
Feedback Forum

Post a new message
Dataseries X:
100	.309	2.99
83	.333	3.45
83	.317	2.99
83	.305	3.26
82	.314	3.26
71	.310	3.42
82	.317	3.39
86	.317	2.94
64	.311	3.77
66	.314	3.87
63	.312	3.84
67	.319	3.85
41	.309	3.55
65	.305	3.88
68	.298	3.68
90	.320	3.60
98	.323	3.11
108	.338	3.11
92	.338	3.84
100	.324	2.91
87	.310	3.29
91	.322	3.42
77	.317	3.56
72	.309	3.66
59	.305	4.05
55	.310	4.13
69	.327	3.88
71	.323	4.22
88	.329	3.95
88	.328	3.77
97	.361	4.27
94	.346	4.16
82	.323	4.07
75	.322	3.89
66	.314	4.48
71	.317	4.09
83	.322	3.76
97	.334	4.14
88	.342	4.26
89	.340	4.07
70	.335	4.45


Summary of computational transaction
Raw Inputview raw input (R code)
Raw Outputview raw output of R engine
Computing time4 seconds
R Server'Gwilym Jenkins' @ 72.249.127.135

\begin{tabular}{lllllllll}
\hline
Summary of computational transaction \tabularnewline
Raw Input & view raw input (R code)  \tabularnewline
Raw Output & view raw output of R engine  \tabularnewline
Computing time & 4 seconds \tabularnewline
R Server & 'Gwilym Jenkins' @ 72.249.127.135 \tabularnewline
\hline
\end{tabular}
%Source: https://freestatistics.org/blog/index.php?pk=63428&T=0

[TABLE]
[ROW][C]Summary of computational transaction[/C][/ROW]
[ROW][C]Raw Input[/C][C]view raw input (R code) [/C][/ROW]
[ROW][C]Raw Output[/C][C]view raw output of R engine [/C][/ROW]
[ROW][C]Computing time[/C][C]4 seconds[/C][/ROW]
[ROW][C]R Server[/C][C]'Gwilym Jenkins' @ 72.249.127.135[/C][/ROW]
[/TABLE]
Source: https://freestatistics.org/blog/index.php?pk=63428&T=0

Globally Unique Identifier (entire table): ba.freestatistics.org/blog/index.php?pk=63428&T=0

As an alternative you can also use a QR Code:  

The GUIDs for individual cells are displayed in the table below:

Summary of computational transaction
Raw Inputview raw input (R code)
Raw Outputview raw output of R engine
Computing time4 seconds
R Server'Gwilym Jenkins' @ 72.249.127.135


Multiple Linear Regression - Estimated Regression Equation
WINS[t] = -116.783807055154 + 846.034856730042OBP[t] -20.3066518191266ERA[t] + e[t]

\begin{tabular}{lllllllll}
\hline
Multiple Linear Regression - Estimated Regression Equation \tabularnewline
WINS[t] =  -116.783807055154 +  846.034856730042OBP[t] -20.3066518191266ERA[t]  + e[t] \tabularnewline
\hline
\end{tabular}
%Source: https://freestatistics.org/blog/index.php?pk=63428&T=1

[TABLE]
[ROW][C]Multiple Linear Regression - Estimated Regression Equation[/C][/ROW]
[ROW][C]WINS[t] =  -116.783807055154 +  846.034856730042OBP[t] -20.3066518191266ERA[t]  + e[t][/C][/ROW]
[/TABLE]
Source: https://freestatistics.org/blog/index.php?pk=63428&T=1

Globally Unique Identifier (entire table): ba.freestatistics.org/blog/index.php?pk=63428&T=1

As an alternative you can also use a QR Code:  

The GUIDs for individual cells are displayed in the table below:

Multiple Linear Regression - Estimated Regression Equation
WINS[t] = -116.783807055154 + 846.034856730042OBP[t] -20.3066518191266ERA[t] + e[t]


Multiple Linear Regression - Ordinary Least Squares
VariableParameterS.D.T-STATH0: parameter = 02-tail p-value1-tail p-value
(Intercept)-116.78380705515432.987101-3.54030.0010750.000537
OBP846.034856730042108.6531527.786600
ERA-20.30665181912663.311923-6.131400

\begin{tabular}{lllllllll}
\hline
Multiple Linear Regression - Ordinary Least Squares \tabularnewline
Variable & Parameter & S.D. & T-STATH0: parameter = 0 & 2-tail p-value & 1-tail p-value \tabularnewline
(Intercept) & -116.783807055154 & 32.987101 & -3.5403 & 0.001075 & 0.000537 \tabularnewline
OBP & 846.034856730042 & 108.653152 & 7.7866 & 0 & 0 \tabularnewline
ERA & -20.3066518191266 & 3.311923 & -6.1314 & 0 & 0 \tabularnewline
\hline
\end{tabular}
%Source: https://freestatistics.org/blog/index.php?pk=63428&T=2

[TABLE]
[ROW][C]Multiple Linear Regression - Ordinary Least Squares[/C][/ROW]
[ROW][C]Variable[/C][C]Parameter[/C][C]S.D.[/C][C]T-STATH0: parameter = 0[/C][C]2-tail p-value[/C][C]1-tail p-value[/C][/ROW]
[ROW][C](Intercept)[/C][C]-116.783807055154[/C][C]32.987101[/C][C]-3.5403[/C][C]0.001075[/C][C]0.000537[/C][/ROW]
[ROW][C]OBP[/C][C]846.034856730042[/C][C]108.653152[/C][C]7.7866[/C][C]0[/C][C]0[/C][/ROW]
[ROW][C]ERA[/C][C]-20.3066518191266[/C][C]3.311923[/C][C]-6.1314[/C][C]0[/C][C]0[/C][/ROW]
[/TABLE]
Source: https://freestatistics.org/blog/index.php?pk=63428&T=2

Globally Unique Identifier (entire table): ba.freestatistics.org/blog/index.php?pk=63428&T=2

As an alternative you can also use a QR Code:  

The GUIDs for individual cells are displayed in the table below:

Multiple Linear Regression - Ordinary Least Squares
VariableParameterS.D.T-STATH0: parameter = 02-tail p-value1-tail p-value
(Intercept)-116.78380705515432.987101-3.54030.0010750.000537
OBP846.034856730042108.6531527.786600
ERA-20.30665181912663.311923-6.131400


Multiple Linear Regression - Regression Statistics
Multiple R0.814500175130974
R-squared0.663410535288388
Adjusted R-squared0.645695300303566
F-TEST (value)37.4485879446021
F-TEST (DF numerator)2
F-TEST (DF denominator)38
p-value1.03492725500587e-09
Multiple Linear Regression - Residual Statistics
Residual Standard Deviation8.45369660233788
Sum Squared Residuals2715.66947728640

\begin{tabular}{lllllllll}
\hline
Multiple Linear Regression - Regression Statistics \tabularnewline
Multiple R & 0.814500175130974 \tabularnewline
R-squared & 0.663410535288388 \tabularnewline
Adjusted R-squared & 0.645695300303566 \tabularnewline
F-TEST (value) & 37.4485879446021 \tabularnewline
F-TEST (DF numerator) & 2 \tabularnewline
F-TEST (DF denominator) & 38 \tabularnewline
p-value & 1.03492725500587e-09 \tabularnewline
Multiple Linear Regression - Residual Statistics \tabularnewline
Residual Standard Deviation & 8.45369660233788 \tabularnewline
Sum Squared Residuals & 2715.66947728640 \tabularnewline
\hline
\end{tabular}
%Source: https://freestatistics.org/blog/index.php?pk=63428&T=3

[TABLE]
[ROW][C]Multiple Linear Regression - Regression Statistics[/C][/ROW]
[ROW][C]Multiple R[/C][C]0.814500175130974[/C][/ROW]
[ROW][C]R-squared[/C][C]0.663410535288388[/C][/ROW]
[ROW][C]Adjusted R-squared[/C][C]0.645695300303566[/C][/ROW]
[ROW][C]F-TEST (value)[/C][C]37.4485879446021[/C][/ROW]
[ROW][C]F-TEST (DF numerator)[/C][C]2[/C][/ROW]
[ROW][C]F-TEST (DF denominator)[/C][C]38[/C][/ROW]
[ROW][C]p-value[/C][C]1.03492725500587e-09[/C][/ROW]
[ROW][C]Multiple Linear Regression - Residual Statistics[/C][/ROW]
[ROW][C]Residual Standard Deviation[/C][C]8.45369660233788[/C][/ROW]
[ROW][C]Sum Squared Residuals[/C][C]2715.66947728640[/C][/ROW]
[/TABLE]
Source: https://freestatistics.org/blog/index.php?pk=63428&T=3

Globally Unique Identifier (entire table): ba.freestatistics.org/blog/index.php?pk=63428&T=3

As an alternative you can also use a QR Code:  

The GUIDs for individual cells are displayed in the table below:

Multiple Linear Regression - Regression Statistics
Multiple R0.814500175130974
R-squared0.663410535288388
Adjusted R-squared0.645695300303566
F-TEST (value)37.4485879446021
F-TEST (DF numerator)2
F-TEST (DF denominator)38
p-value1.03492725500587e-09
Multiple Linear Regression - Residual Statistics
Residual Standard Deviation8.45369660233788
Sum Squared Residuals2715.66947728640


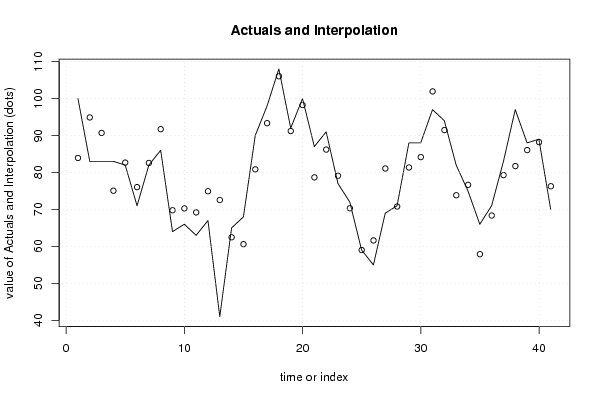
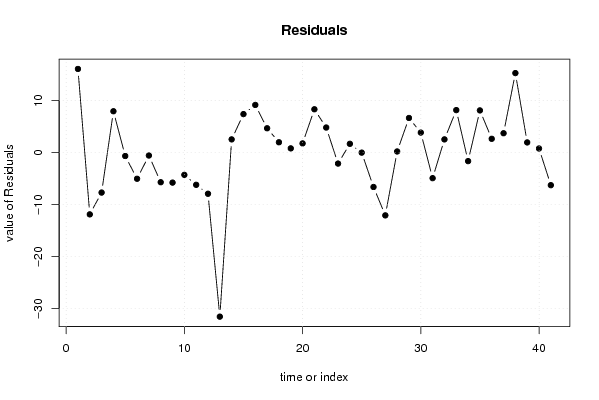
Multiple Linear Regression - Actuals, Interpolation, and Residuals
Time or IndexActualsInterpolationForecastResidualsPrediction Error
110083.924074735240516.0759252647596
28394.887851459963-11.8878514599630
38390.6923535890806-7.69235358908055
48375.05713931715587.94286068284416
58282.6714530277262-0.671453027726225
67176.0382493097458-5.03824930974579
78282.5696928614299-0.569692861429884
88691.7076861800369-5.70768618003687
96469.7769560297815-5.77695602978151
106670.284395418059-4.28439541805897
116369.2015252591727-6.20152525917269
126774.9207027380917-7.92070273809172
134172.5523497165293-31.5523497165293
146562.46701518929732.53298481070268
156860.60610155601237.39389844398765
169080.84340054960349.15659945039658
179893.33176451116564.66823548883440
18108106.0222873621161.97771263788375
199291.19843153415380.801568465846193
2010098.2391297317211.76087026827903
218778.67811404623238.32188595376775
229186.19066759050634.8093324094937
237779.1175620521784-2.11756205217836
247270.31861801642531.68138198357465
255959.0148843800458-0.0148843800457970
265561.6205265181659-6.62052651816588
276981.0797820373583-12.0797820373583
287170.7913809919350.208619008064955
298881.35038612347956.64961387652052
308884.15954859419223.84045140580776
3197101.925372956720-4.9253729567203
329491.46858180587362.53141819412643
338273.8373787648048.16262123519597
347576.6465412355168-1.64654123551678
356657.89733780839178.10266219160828
367168.35503658804122.64496341195875
378379.28640597200333.71359402799675
389781.722296561495715.2777034385043
398886.05377719704081.94622280295921
408988.21997132921480.780028670785241
417076.2732693542964-6.27326935429643

\begin{tabular}{lllllllll}
\hline
Multiple Linear Regression - Actuals, Interpolation, and Residuals \tabularnewline
Time or Index & Actuals & InterpolationForecast & ResidualsPrediction Error \tabularnewline
1 & 100 & 83.9240747352405 & 16.0759252647596 \tabularnewline
2 & 83 & 94.887851459963 & -11.8878514599630 \tabularnewline
3 & 83 & 90.6923535890806 & -7.69235358908055 \tabularnewline
4 & 83 & 75.0571393171558 & 7.94286068284416 \tabularnewline
5 & 82 & 82.6714530277262 & -0.671453027726225 \tabularnewline
6 & 71 & 76.0382493097458 & -5.03824930974579 \tabularnewline
7 & 82 & 82.5696928614299 & -0.569692861429884 \tabularnewline
8 & 86 & 91.7076861800369 & -5.70768618003687 \tabularnewline
9 & 64 & 69.7769560297815 & -5.77695602978151 \tabularnewline
10 & 66 & 70.284395418059 & -4.28439541805897 \tabularnewline
11 & 63 & 69.2015252591727 & -6.20152525917269 \tabularnewline
12 & 67 & 74.9207027380917 & -7.92070273809172 \tabularnewline
13 & 41 & 72.5523497165293 & -31.5523497165293 \tabularnewline
14 & 65 & 62.4670151892973 & 2.53298481070268 \tabularnewline
15 & 68 & 60.6061015560123 & 7.39389844398765 \tabularnewline
16 & 90 & 80.8434005496034 & 9.15659945039658 \tabularnewline
17 & 98 & 93.3317645111656 & 4.66823548883440 \tabularnewline
18 & 108 & 106.022287362116 & 1.97771263788375 \tabularnewline
19 & 92 & 91.1984315341538 & 0.801568465846193 \tabularnewline
20 & 100 & 98.239129731721 & 1.76087026827903 \tabularnewline
21 & 87 & 78.6781140462323 & 8.32188595376775 \tabularnewline
22 & 91 & 86.1906675905063 & 4.8093324094937 \tabularnewline
23 & 77 & 79.1175620521784 & -2.11756205217836 \tabularnewline
24 & 72 & 70.3186180164253 & 1.68138198357465 \tabularnewline
25 & 59 & 59.0148843800458 & -0.0148843800457970 \tabularnewline
26 & 55 & 61.6205265181659 & -6.62052651816588 \tabularnewline
27 & 69 & 81.0797820373583 & -12.0797820373583 \tabularnewline
28 & 71 & 70.791380991935 & 0.208619008064955 \tabularnewline
29 & 88 & 81.3503861234795 & 6.64961387652052 \tabularnewline
30 & 88 & 84.1595485941922 & 3.84045140580776 \tabularnewline
31 & 97 & 101.925372956720 & -4.9253729567203 \tabularnewline
32 & 94 & 91.4685818058736 & 2.53141819412643 \tabularnewline
33 & 82 & 73.837378764804 & 8.16262123519597 \tabularnewline
34 & 75 & 76.6465412355168 & -1.64654123551678 \tabularnewline
35 & 66 & 57.8973378083917 & 8.10266219160828 \tabularnewline
36 & 71 & 68.3550365880412 & 2.64496341195875 \tabularnewline
37 & 83 & 79.2864059720033 & 3.71359402799675 \tabularnewline
38 & 97 & 81.7222965614957 & 15.2777034385043 \tabularnewline
39 & 88 & 86.0537771970408 & 1.94622280295921 \tabularnewline
40 & 89 & 88.2199713292148 & 0.780028670785241 \tabularnewline
41 & 70 & 76.2732693542964 & -6.27326935429643 \tabularnewline
\hline
\end{tabular}
%Source: https://freestatistics.org/blog/index.php?pk=63428&T=4

[TABLE]
[ROW][C]Multiple Linear Regression - Actuals, Interpolation, and Residuals[/C][/ROW]
[ROW][C]Time or Index[/C][C]Actuals[/C][C]InterpolationForecast[/C][C]ResidualsPrediction Error[/C][/ROW]
[ROW][C]1[/C][C]100[/C][C]83.9240747352405[/C][C]16.0759252647596[/C][/ROW]
[ROW][C]2[/C][C]83[/C][C]94.887851459963[/C][C]-11.8878514599630[/C][/ROW]
[ROW][C]3[/C][C]83[/C][C]90.6923535890806[/C][C]-7.69235358908055[/C][/ROW]
[ROW][C]4[/C][C]83[/C][C]75.0571393171558[/C][C]7.94286068284416[/C][/ROW]
[ROW][C]5[/C][C]82[/C][C]82.6714530277262[/C][C]-0.671453027726225[/C][/ROW]
[ROW][C]6[/C][C]71[/C][C]76.0382493097458[/C][C]-5.03824930974579[/C][/ROW]
[ROW][C]7[/C][C]82[/C][C]82.5696928614299[/C][C]-0.569692861429884[/C][/ROW]
[ROW][C]8[/C][C]86[/C][C]91.7076861800369[/C][C]-5.70768618003687[/C][/ROW]
[ROW][C]9[/C][C]64[/C][C]69.7769560297815[/C][C]-5.77695602978151[/C][/ROW]
[ROW][C]10[/C][C]66[/C][C]70.284395418059[/C][C]-4.28439541805897[/C][/ROW]
[ROW][C]11[/C][C]63[/C][C]69.2015252591727[/C][C]-6.20152525917269[/C][/ROW]
[ROW][C]12[/C][C]67[/C][C]74.9207027380917[/C][C]-7.92070273809172[/C][/ROW]
[ROW][C]13[/C][C]41[/C][C]72.5523497165293[/C][C]-31.5523497165293[/C][/ROW]
[ROW][C]14[/C][C]65[/C][C]62.4670151892973[/C][C]2.53298481070268[/C][/ROW]
[ROW][C]15[/C][C]68[/C][C]60.6061015560123[/C][C]7.39389844398765[/C][/ROW]
[ROW][C]16[/C][C]90[/C][C]80.8434005496034[/C][C]9.15659945039658[/C][/ROW]
[ROW][C]17[/C][C]98[/C][C]93.3317645111656[/C][C]4.66823548883440[/C][/ROW]
[ROW][C]18[/C][C]108[/C][C]106.022287362116[/C][C]1.97771263788375[/C][/ROW]
[ROW][C]19[/C][C]92[/C][C]91.1984315341538[/C][C]0.801568465846193[/C][/ROW]
[ROW][C]20[/C][C]100[/C][C]98.239129731721[/C][C]1.76087026827903[/C][/ROW]
[ROW][C]21[/C][C]87[/C][C]78.6781140462323[/C][C]8.32188595376775[/C][/ROW]
[ROW][C]22[/C][C]91[/C][C]86.1906675905063[/C][C]4.8093324094937[/C][/ROW]
[ROW][C]23[/C][C]77[/C][C]79.1175620521784[/C][C]-2.11756205217836[/C][/ROW]
[ROW][C]24[/C][C]72[/C][C]70.3186180164253[/C][C]1.68138198357465[/C][/ROW]
[ROW][C]25[/C][C]59[/C][C]59.0148843800458[/C][C]-0.0148843800457970[/C][/ROW]
[ROW][C]26[/C][C]55[/C][C]61.6205265181659[/C][C]-6.62052651816588[/C][/ROW]
[ROW][C]27[/C][C]69[/C][C]81.0797820373583[/C][C]-12.0797820373583[/C][/ROW]
[ROW][C]28[/C][C]71[/C][C]70.791380991935[/C][C]0.208619008064955[/C][/ROW]
[ROW][C]29[/C][C]88[/C][C]81.3503861234795[/C][C]6.64961387652052[/C][/ROW]
[ROW][C]30[/C][C]88[/C][C]84.1595485941922[/C][C]3.84045140580776[/C][/ROW]
[ROW][C]31[/C][C]97[/C][C]101.925372956720[/C][C]-4.9253729567203[/C][/ROW]
[ROW][C]32[/C][C]94[/C][C]91.4685818058736[/C][C]2.53141819412643[/C][/ROW]
[ROW][C]33[/C][C]82[/C][C]73.837378764804[/C][C]8.16262123519597[/C][/ROW]
[ROW][C]34[/C][C]75[/C][C]76.6465412355168[/C][C]-1.64654123551678[/C][/ROW]
[ROW][C]35[/C][C]66[/C][C]57.8973378083917[/C][C]8.10266219160828[/C][/ROW]
[ROW][C]36[/C][C]71[/C][C]68.3550365880412[/C][C]2.64496341195875[/C][/ROW]
[ROW][C]37[/C][C]83[/C][C]79.2864059720033[/C][C]3.71359402799675[/C][/ROW]
[ROW][C]38[/C][C]97[/C][C]81.7222965614957[/C][C]15.2777034385043[/C][/ROW]
[ROW][C]39[/C][C]88[/C][C]86.0537771970408[/C][C]1.94622280295921[/C][/ROW]
[ROW][C]40[/C][C]89[/C][C]88.2199713292148[/C][C]0.780028670785241[/C][/ROW]
[ROW][C]41[/C][C]70[/C][C]76.2732693542964[/C][C]-6.27326935429643[/C][/ROW]
[/TABLE]
Source: https://freestatistics.org/blog/index.php?pk=63428&T=4

Globally Unique Identifier (entire table): ba.freestatistics.org/blog/index.php?pk=63428&T=4

As an alternative you can also use a QR Code:  

The GUIDs for individual cells are displayed in the table below:

Multiple Linear Regression - Actuals, Interpolation, and Residuals
Time or IndexActualsInterpolationForecastResidualsPrediction Error
110083.924074735240516.0759252647596
28394.887851459963-11.8878514599630
38390.6923535890806-7.69235358908055
48375.05713931715587.94286068284416
58282.6714530277262-0.671453027726225
67176.0382493097458-5.03824930974579
78282.5696928614299-0.569692861429884
88691.7076861800369-5.70768618003687
96469.7769560297815-5.77695602978151
106670.284395418059-4.28439541805897
116369.2015252591727-6.20152525917269
126774.9207027380917-7.92070273809172
134172.5523497165293-31.5523497165293
146562.46701518929732.53298481070268
156860.60610155601237.39389844398765
169080.84340054960349.15659945039658
179893.33176451116564.66823548883440
18108106.0222873621161.97771263788375
199291.19843153415380.801568465846193
2010098.2391297317211.76087026827903
218778.67811404623238.32188595376775
229186.19066759050634.8093324094937
237779.1175620521784-2.11756205217836
247270.31861801642531.68138198357465
255959.0148843800458-0.0148843800457970
265561.6205265181659-6.62052651816588
276981.0797820373583-12.0797820373583
287170.7913809919350.208619008064955
298881.35038612347956.64961387652052
308884.15954859419223.84045140580776
3197101.925372956720-4.9253729567203
329491.46858180587362.53141819412643
338273.8373787648048.16262123519597
347576.6465412355168-1.64654123551678
356657.89733780839178.10266219160828
367168.35503658804122.64496341195875
378379.28640597200333.71359402799675
389781.722296561495715.2777034385043
398886.05377719704081.94622280295921
408988.21997132921480.780028670785241
417076.2732693542964-6.27326935429643


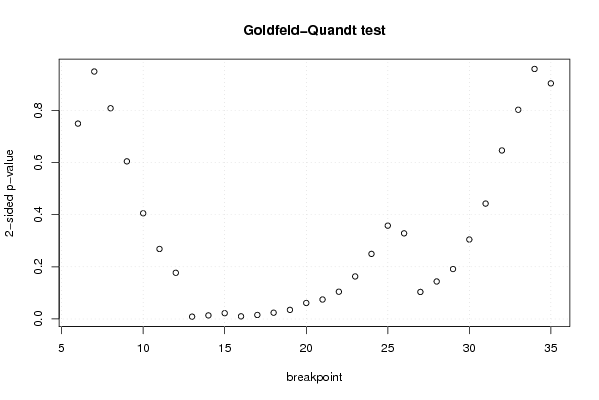
Goldfeld-Quandt test for Heteroskedasticity
p-valuesAlternative Hypothesis
breakpoint indexgreater2-sidedless
60.6254690046626310.7490619906747380.374530995337369
70.4744030248523910.9488060497047830.525596975147609
80.4039629544076250.8079259088152510.596037045592375
90.3021597291928770.6043194583857530.697840270807123
100.2026547505699300.4053095011398590.79734524943007
110.1341600791529020.2683201583058030.865839920847098
120.08848578454846730.1769715690969350.911514215451533
130.9955986765216870.008802646956625170.00440132347831258
140.9932054623891530.01358907522169370.00679453761084684
150.9889190976440540.02216180471189300.0110809023559465
160.9949913791221970.01001724175560530.00500862087780265
170.9923424008704390.01531519825912280.00765759912956139
180.9880442601137980.02391147977240420.0119557398862021
190.9826155118855430.03476897622891410.0173844881144571
200.9693802727673010.06123945446539820.0306197272326991
210.9627067864962060.0745864270075870.0372932135037935
220.9478158554185630.1043682891628740.052184144581437
230.9185119205457930.1629761589084150.0814880794542075
240.8752315799144590.2495368401710820.124768420085541
250.8211245891335280.3577508217329450.178875410866472
260.8358616608023290.3282766783953430.164138339197671
270.9482092068311540.1035815863376920.051790793168846
280.9281629991793360.1436740016413280.0718370008206638
290.9042515241772150.1914969516455690.0957484758227845
300.8476959915940850.304608016811830.152304008405915
310.7788165399274090.4423669201451820.221183460072591
320.6769496129408220.6461007741183560.323050387059178
330.5989423970633010.8021152058733980.401057602936699
340.5206789748377130.9586420503245740.479321025162287
350.4516749380969490.9033498761938990.548325061903051

\begin{tabular}{lllllllll}
\hline
Goldfeld-Quandt test for Heteroskedasticity \tabularnewline
p-values & Alternative Hypothesis \tabularnewline
breakpoint index & greater & 2-sided & less \tabularnewline
6 & 0.625469004662631 & 0.749061990674738 & 0.374530995337369 \tabularnewline
7 & 0.474403024852391 & 0.948806049704783 & 0.525596975147609 \tabularnewline
8 & 0.403962954407625 & 0.807925908815251 & 0.596037045592375 \tabularnewline
9 & 0.302159729192877 & 0.604319458385753 & 0.697840270807123 \tabularnewline
10 & 0.202654750569930 & 0.405309501139859 & 0.79734524943007 \tabularnewline
11 & 0.134160079152902 & 0.268320158305803 & 0.865839920847098 \tabularnewline
12 & 0.0884857845484673 & 0.176971569096935 & 0.911514215451533 \tabularnewline
13 & 0.995598676521687 & 0.00880264695662517 & 0.00440132347831258 \tabularnewline
14 & 0.993205462389153 & 0.0135890752216937 & 0.00679453761084684 \tabularnewline
15 & 0.988919097644054 & 0.0221618047118930 & 0.0110809023559465 \tabularnewline
16 & 0.994991379122197 & 0.0100172417556053 & 0.00500862087780265 \tabularnewline
17 & 0.992342400870439 & 0.0153151982591228 & 0.00765759912956139 \tabularnewline
18 & 0.988044260113798 & 0.0239114797724042 & 0.0119557398862021 \tabularnewline
19 & 0.982615511885543 & 0.0347689762289141 & 0.0173844881144571 \tabularnewline
20 & 0.969380272767301 & 0.0612394544653982 & 0.0306197272326991 \tabularnewline
21 & 0.962706786496206 & 0.074586427007587 & 0.0372932135037935 \tabularnewline
22 & 0.947815855418563 & 0.104368289162874 & 0.052184144581437 \tabularnewline
23 & 0.918511920545793 & 0.162976158908415 & 0.0814880794542075 \tabularnewline
24 & 0.875231579914459 & 0.249536840171082 & 0.124768420085541 \tabularnewline
25 & 0.821124589133528 & 0.357750821732945 & 0.178875410866472 \tabularnewline
26 & 0.835861660802329 & 0.328276678395343 & 0.164138339197671 \tabularnewline
27 & 0.948209206831154 & 0.103581586337692 & 0.051790793168846 \tabularnewline
28 & 0.928162999179336 & 0.143674001641328 & 0.0718370008206638 \tabularnewline
29 & 0.904251524177215 & 0.191496951645569 & 0.0957484758227845 \tabularnewline
30 & 0.847695991594085 & 0.30460801681183 & 0.152304008405915 \tabularnewline
31 & 0.778816539927409 & 0.442366920145182 & 0.221183460072591 \tabularnewline
32 & 0.676949612940822 & 0.646100774118356 & 0.323050387059178 \tabularnewline
33 & 0.598942397063301 & 0.802115205873398 & 0.401057602936699 \tabularnewline
34 & 0.520678974837713 & 0.958642050324574 & 0.479321025162287 \tabularnewline
35 & 0.451674938096949 & 0.903349876193899 & 0.548325061903051 \tabularnewline
\hline
\end{tabular}
%Source: https://freestatistics.org/blog/index.php?pk=63428&T=5

[TABLE]
[ROW][C]Goldfeld-Quandt test for Heteroskedasticity[/C][/ROW]
[ROW][C]p-values[/C][C]Alternative Hypothesis[/C][/ROW]
[ROW][C]breakpoint index[/C][C]greater[/C][C]2-sided[/C][C]less[/C][/ROW]
[ROW][C]6[/C][C]0.625469004662631[/C][C]0.749061990674738[/C][C]0.374530995337369[/C][/ROW]
[ROW][C]7[/C][C]0.474403024852391[/C][C]0.948806049704783[/C][C]0.525596975147609[/C][/ROW]
[ROW][C]8[/C][C]0.403962954407625[/C][C]0.807925908815251[/C][C]0.596037045592375[/C][/ROW]
[ROW][C]9[/C][C]0.302159729192877[/C][C]0.604319458385753[/C][C]0.697840270807123[/C][/ROW]
[ROW][C]10[/C][C]0.202654750569930[/C][C]0.405309501139859[/C][C]0.79734524943007[/C][/ROW]
[ROW][C]11[/C][C]0.134160079152902[/C][C]0.268320158305803[/C][C]0.865839920847098[/C][/ROW]
[ROW][C]12[/C][C]0.0884857845484673[/C][C]0.176971569096935[/C][C]0.911514215451533[/C][/ROW]
[ROW][C]13[/C][C]0.995598676521687[/C][C]0.00880264695662517[/C][C]0.00440132347831258[/C][/ROW]
[ROW][C]14[/C][C]0.993205462389153[/C][C]0.0135890752216937[/C][C]0.00679453761084684[/C][/ROW]
[ROW][C]15[/C][C]0.988919097644054[/C][C]0.0221618047118930[/C][C]0.0110809023559465[/C][/ROW]
[ROW][C]16[/C][C]0.994991379122197[/C][C]0.0100172417556053[/C][C]0.00500862087780265[/C][/ROW]
[ROW][C]17[/C][C]0.992342400870439[/C][C]0.0153151982591228[/C][C]0.00765759912956139[/C][/ROW]
[ROW][C]18[/C][C]0.988044260113798[/C][C]0.0239114797724042[/C][C]0.0119557398862021[/C][/ROW]
[ROW][C]19[/C][C]0.982615511885543[/C][C]0.0347689762289141[/C][C]0.0173844881144571[/C][/ROW]
[ROW][C]20[/C][C]0.969380272767301[/C][C]0.0612394544653982[/C][C]0.0306197272326991[/C][/ROW]
[ROW][C]21[/C][C]0.962706786496206[/C][C]0.074586427007587[/C][C]0.0372932135037935[/C][/ROW]
[ROW][C]22[/C][C]0.947815855418563[/C][C]0.104368289162874[/C][C]0.052184144581437[/C][/ROW]
[ROW][C]23[/C][C]0.918511920545793[/C][C]0.162976158908415[/C][C]0.0814880794542075[/C][/ROW]
[ROW][C]24[/C][C]0.875231579914459[/C][C]0.249536840171082[/C][C]0.124768420085541[/C][/ROW]
[ROW][C]25[/C][C]0.821124589133528[/C][C]0.357750821732945[/C][C]0.178875410866472[/C][/ROW]
[ROW][C]26[/C][C]0.835861660802329[/C][C]0.328276678395343[/C][C]0.164138339197671[/C][/ROW]
[ROW][C]27[/C][C]0.948209206831154[/C][C]0.103581586337692[/C][C]0.051790793168846[/C][/ROW]
[ROW][C]28[/C][C]0.928162999179336[/C][C]0.143674001641328[/C][C]0.0718370008206638[/C][/ROW]
[ROW][C]29[/C][C]0.904251524177215[/C][C]0.191496951645569[/C][C]0.0957484758227845[/C][/ROW]
[ROW][C]30[/C][C]0.847695991594085[/C][C]0.30460801681183[/C][C]0.152304008405915[/C][/ROW]
[ROW][C]31[/C][C]0.778816539927409[/C][C]0.442366920145182[/C][C]0.221183460072591[/C][/ROW]
[ROW][C]32[/C][C]0.676949612940822[/C][C]0.646100774118356[/C][C]0.323050387059178[/C][/ROW]
[ROW][C]33[/C][C]0.598942397063301[/C][C]0.802115205873398[/C][C]0.401057602936699[/C][/ROW]
[ROW][C]34[/C][C]0.520678974837713[/C][C]0.958642050324574[/C][C]0.479321025162287[/C][/ROW]
[ROW][C]35[/C][C]0.451674938096949[/C][C]0.903349876193899[/C][C]0.548325061903051[/C][/ROW]
[/TABLE]
Source: https://freestatistics.org/blog/index.php?pk=63428&T=5

Globally Unique Identifier (entire table): ba.freestatistics.org/blog/index.php?pk=63428&T=5

As an alternative you can also use a QR Code:  

The GUIDs for individual cells are displayed in the table below:

Goldfeld-Quandt test for Heteroskedasticity
p-valuesAlternative Hypothesis
breakpoint indexgreater2-sidedless
60.6254690046626310.7490619906747380.374530995337369
70.4744030248523910.9488060497047830.525596975147609
80.4039629544076250.8079259088152510.596037045592375
90.3021597291928770.6043194583857530.697840270807123
100.2026547505699300.4053095011398590.79734524943007
110.1341600791529020.2683201583058030.865839920847098
120.08848578454846730.1769715690969350.911514215451533
130.9955986765216870.008802646956625170.00440132347831258
140.9932054623891530.01358907522169370.00679453761084684
150.9889190976440540.02216180471189300.0110809023559465
160.9949913791221970.01001724175560530.00500862087780265
170.9923424008704390.01531519825912280.00765759912956139
180.9880442601137980.02391147977240420.0119557398862021
190.9826155118855430.03476897622891410.0173844881144571
200.9693802727673010.06123945446539820.0306197272326991
210.9627067864962060.0745864270075870.0372932135037935
220.9478158554185630.1043682891628740.052184144581437
230.9185119205457930.1629761589084150.0814880794542075
240.8752315799144590.2495368401710820.124768420085541
250.8211245891335280.3577508217329450.178875410866472
260.8358616608023290.3282766783953430.164138339197671
270.9482092068311540.1035815863376920.051790793168846
280.9281629991793360.1436740016413280.0718370008206638
290.9042515241772150.1914969516455690.0957484758227845
300.8476959915940850.304608016811830.152304008405915
310.7788165399274090.4423669201451820.221183460072591
320.6769496129408220.6461007741183560.323050387059178
330.5989423970633010.8021152058733980.401057602936699
340.5206789748377130.9586420503245740.479321025162287
350.4516749380969490.9033498761938990.548325061903051


Meta Analysis of Goldfeld-Quandt test for Heteroskedasticity
Description# significant tests% significant testsOK/NOK
1% type I error level10.0333333333333333NOK
5% type I error level70.233333333333333NOK
10% type I error level90.3NOK

\begin{tabular}{lllllllll}
\hline
Meta Analysis of Goldfeld-Quandt test for Heteroskedasticity \tabularnewline
Description & # significant tests & % significant tests & OK/NOK \tabularnewline
1% type I error level & 1 & 0.0333333333333333 & NOK \tabularnewline
5% type I error level & 7 & 0.233333333333333 & NOK \tabularnewline
10% type I error level & 9 & 0.3 & NOK \tabularnewline
\hline
\end{tabular}
%Source: https://freestatistics.org/blog/index.php?pk=63428&T=6

[TABLE]
[ROW][C]Meta Analysis of Goldfeld-Quandt test for Heteroskedasticity[/C][/ROW]
[ROW][C]Description[/C][C]# significant tests[/C][C]% significant tests[/C][C]OK/NOK[/C][/ROW]
[ROW][C]1% type I error level[/C][C]1[/C][C]0.0333333333333333[/C][C]NOK[/C][/ROW]
[ROW][C]5% type I error level[/C][C]7[/C][C]0.233333333333333[/C][C]NOK[/C][/ROW]
[ROW][C]10% type I error level[/C][C]9[/C][C]0.3[/C][C]NOK[/C][/ROW]
[/TABLE]
Source: https://freestatistics.org/blog/index.php?pk=63428&T=6

Globally Unique Identifier (entire table): ba.freestatistics.org/blog/index.php?pk=63428&T=6

As an alternative you can also use a QR Code:  

The GUIDs for individual cells are displayed in the table below:

Meta Analysis of Goldfeld-Quandt test for Heteroskedasticity
Description# significant tests% significant testsOK/NOK
1% type I error level10.0333333333333333NOK
5% type I error level70.233333333333333NOK
10% type I error level90.3NOK


Parameters (Session):
par1 = 1 ; par2 = Do not include Seasonal Dummies ; par3 = No Linear Trend ;
Parameters (R input):
par1 = 1 ; par2 = Do not include Seasonal Dummies ; par3 = No Linear Trend ;
R code (references can be found in the software module):
library(lattice)
library(lmtest)
n25 <- 25 #minimum number of obs. for Goldfeld-Quandt test
par1 <- as.numeric(par1)
x <- t(y)
k <- length(x[1,])
n <- length(x[,1])
x1 <- cbind(x[,par1], x[,1:k!=par1])
mycolnames <- c(colnames(x)[par1], colnames(x)[1:k!=par1])
colnames(x1) <- mycolnames #colnames(x)[par1]
x <- x1
if (par3 == 'First Differences'){
x2 <- array(0, dim=c(n-1,k), dimnames=list(1:(n-1), paste('(1-B)',colnames(x),sep='')))
for (i in 1:n-1) {
for (j in 1:k) {
x2[i,j] <- x[i+1,j] - x[i,j]
}
}
x <- x2
}
if (par2 == 'Include Monthly Dummies'){
x2 <- array(0, dim=c(n,11), dimnames=list(1:n, paste('M', seq(1:11), sep ='')))
for (i in 1:11){
x2[seq(i,n,12),i] <- 1
}
x <- cbind(x, x2)
}
if (par2 == 'Include Quarterly Dummies'){
x2 <- array(0, dim=c(n,3), dimnames=list(1:n, paste('Q', seq(1:3), sep ='')))
for (i in 1:3){
x2[seq(i,n,4),i] <- 1
}
x <- cbind(x, x2)
}
k <- length(x[1,])
if (par3 == 'Linear Trend'){
x <- cbind(x, c(1:n))
colnames(x)[k+1] <- 't'
}
x
k <- length(x[1,])
df <- as.data.frame(x)
(mylm <- lm(df))
(mysum <- summary(mylm))
if (n > n25) {
kp3 <- k + 3
nmkm3 <- n - k - 3
gqarr <- array(NA, dim=c(nmkm3-kp3+1,3))
numgqtests <- 0
numsignificant1 <- 0
numsignificant5 <- 0
numsignificant10 <- 0
for (mypoint in kp3:nmkm3) {
j <- 0
numgqtests <- numgqtests + 1
for (myalt in c('greater', 'two.sided', 'less')) {
j <- j + 1
gqarr[mypoint-kp3+1,j] <- gqtest(mylm, point=mypoint, alternative=myalt)$p.value
}
if (gqarr[mypoint-kp3+1,2] < 0.01) numsignificant1 <- numsignificant1 + 1
if (gqarr[mypoint-kp3+1,2] < 0.05) numsignificant5 <- numsignificant5 + 1
if (gqarr[mypoint-kp3+1,2] < 0.10) numsignificant10 <- numsignificant10 + 1
}
gqarr
}
bitmap(file='test0.png')
plot(x[,1], type='l', main='Actuals and Interpolation', ylab='value of Actuals and Interpolation (dots)', xlab='time or index')
points(x[,1]-mysum$resid)
grid()
dev.off()
bitmap(file='test1.png')
plot(mysum$resid, type='b', pch=19, main='Residuals', ylab='value of Residuals', xlab='time or index')
grid()
dev.off()
bitmap(file='test2.png')
hist(mysum$resid, main='Residual Histogram', xlab='values of Residuals')
grid()
dev.off()
bitmap(file='test3.png')
densityplot(~mysum$resid,col='black',main='Residual Density Plot', xlab='values of Residuals')
dev.off()
bitmap(file='test4.png')
qqnorm(mysum$resid, main='Residual Normal Q-Q Plot')
qqline(mysum$resid)
grid()
dev.off()
(myerror <- as.ts(mysum$resid))
bitmap(file='test5.png')
dum <- cbind(lag(myerror,k=1),myerror)
dum
dum1 <- dum[2:length(myerror),]
dum1
z <- as.data.frame(dum1)
z
plot(z,main=paste('Residual Lag plot, lowess, and regression line'), ylab='values of Residuals', xlab='lagged values of Residuals')
lines(lowess(z))
abline(lm(z))
grid()
dev.off()
bitmap(file='test6.png')
acf(mysum$resid, lag.max=length(mysum$resid)/2, main='Residual Autocorrelation Function')
grid()
dev.off()
bitmap(file='test7.png')
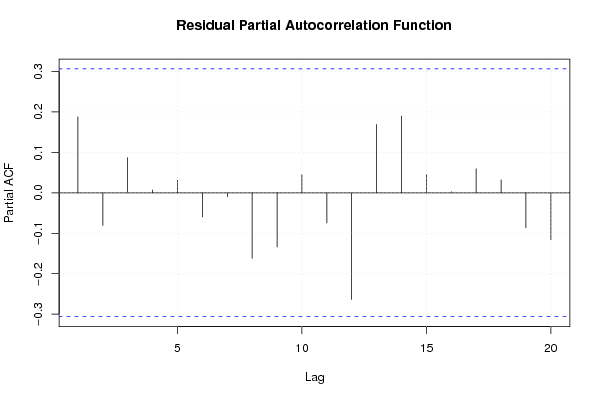
pacf(mysum$resid, lag.max=length(mysum$resid)/2, main='Residual Partial Autocorrelation Function')
grid()
dev.off()
bitmap(file='test8.png')
opar <- par(mfrow = c(2,2), oma = c(0, 0, 1.1, 0))
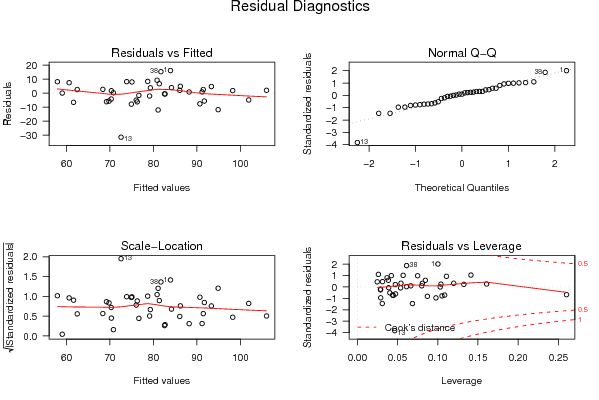
plot(mylm, las = 1, sub='Residual Diagnostics')
par(opar)
dev.off()
if (n > n25) {
bitmap(file='test9.png')
plot(kp3:nmkm3,gqarr[,2], main='Goldfeld-Quandt test',ylab='2-sided p-value',xlab='breakpoint')
grid()
dev.off()
}
load(file='createtable')
a<-table.start()
a<-table.row.start(a)
a<-table.element(a, 'Multiple Linear Regression - Estimated Regression Equation', 1, TRUE)
a<-table.row.end(a)
myeq <- colnames(x)[1]
myeq <- paste(myeq, '[t] = ', sep='')
for (i in 1:k){
if (mysum$coefficients[i,1] > 0) myeq <- paste(myeq, '+', '')
myeq <- paste(myeq, mysum$coefficients[i,1], sep=' ')
if (rownames(mysum$coefficients)[i] != '(Intercept)') {
myeq <- paste(myeq, rownames(mysum$coefficients)[i], sep='')
if (rownames(mysum$coefficients)[i] != 't') myeq <- paste(myeq, '[t]', sep='')
}
}
myeq <- paste(myeq, ' + e[t]')
a<-table.row.start(a)
a<-table.element(a, myeq)
a<-table.row.end(a)
a<-table.end(a)
table.save(a,file='mytable1.tab')
a<-table.start()
a<-table.row.start(a)
a<-table.element(a,hyperlink('ols1.htm','Multiple Linear Regression - Ordinary Least Squares',''), 6, TRUE)
a<-table.row.end(a)
a<-table.row.start(a)
a<-table.element(a,'Variable',header=TRUE)
a<-table.element(a,'Parameter',header=TRUE)
a<-table.element(a,'S.D.',header=TRUE)
a<-table.element(a,'T-STAT
H0: parameter = 0',header=TRUE)
a<-table.element(a,'2-tail p-value',header=TRUE)
a<-table.element(a,'1-tail p-value',header=TRUE)
a<-table.row.end(a)
for (i in 1:k){
a<-table.row.start(a)
a<-table.element(a,rownames(mysum$coefficients)[i],header=TRUE)
a<-table.element(a,mysum$coefficients[i,1])
a<-table.element(a, round(mysum$coefficients[i,2],6))
a<-table.element(a, round(mysum$coefficients[i,3],4))
a<-table.element(a, round(mysum$coefficients[i,4],6))
a<-table.element(a, round(mysum$coefficients[i,4]/2,6))
a<-table.row.end(a)
}
a<-table.end(a)
table.save(a,file='mytable2.tab')
a<-table.start()
a<-table.row.start(a)
a<-table.element(a, 'Multiple Linear Regression - Regression Statistics', 2, TRUE)
a<-table.row.end(a)
a<-table.row.start(a)
a<-table.element(a, 'Multiple R',1,TRUE)
a<-table.element(a, sqrt(mysum$r.squared))
a<-table.row.end(a)
a<-table.row.start(a)
a<-table.element(a, 'R-squared',1,TRUE)
a<-table.element(a, mysum$r.squared)
a<-table.row.end(a)
a<-table.row.start(a)
a<-table.element(a, 'Adjusted R-squared',1,TRUE)
a<-table.element(a, mysum$adj.r.squared)
a<-table.row.end(a)
a<-table.row.start(a)
a<-table.element(a, 'F-TEST (value)',1,TRUE)
a<-table.element(a, mysum$fstatistic[1])
a<-table.row.end(a)
a<-table.row.start(a)
a<-table.element(a, 'F-TEST (DF numerator)',1,TRUE)
a<-table.element(a, mysum$fstatistic[2])
a<-table.row.end(a)
a<-table.row.start(a)
a<-table.element(a, 'F-TEST (DF denominator)',1,TRUE)
a<-table.element(a, mysum$fstatistic[3])
a<-table.row.end(a)
a<-table.row.start(a)
a<-table.element(a, 'p-value',1,TRUE)
a<-table.element(a, 1-pf(mysum$fstatistic[1],mysum$fstatistic[2],mysum$fstatistic[3]))
a<-table.row.end(a)
a<-table.row.start(a)
a<-table.element(a, 'Multiple Linear Regression - Residual Statistics', 2, TRUE)
a<-table.row.end(a)
a<-table.row.start(a)
a<-table.element(a, 'Residual Standard Deviation',1,TRUE)
a<-table.element(a, mysum$sigma)
a<-table.row.end(a)
a<-table.row.start(a)
a<-table.element(a, 'Sum Squared Residuals',1,TRUE)
a<-table.element(a, sum(myerror*myerror))
a<-table.row.end(a)
a<-table.end(a)
table.save(a,file='mytable3.tab')
a<-table.start()
a<-table.row.start(a)
a<-table.element(a, 'Multiple Linear Regression - Actuals, Interpolation, and Residuals', 4, TRUE)
a<-table.row.end(a)
a<-table.row.start(a)
a<-table.element(a, 'Time or Index', 1, TRUE)
a<-table.element(a, 'Actuals', 1, TRUE)
a<-table.element(a, 'Interpolation
Forecast', 1, TRUE)
a<-table.element(a, 'Residuals
Prediction Error', 1, TRUE)
a<-table.row.end(a)
for (i in 1:n) {
a<-table.row.start(a)
a<-table.element(a,i, 1, TRUE)
a<-table.element(a,x[i])
a<-table.element(a,x[i]-mysum$resid[i])
a<-table.element(a,mysum$resid[i])
a<-table.row.end(a)
}
a<-table.end(a)
table.save(a,file='mytable4.tab')
if (n > n25) {
a<-table.start()
a<-table.row.start(a)
a<-table.element(a,'Goldfeld-Quandt test for Heteroskedasticity',4,TRUE)
a<-table.row.end(a)
a<-table.row.start(a)
a<-table.element(a,'p-values',header=TRUE)
a<-table.element(a,'Alternative Hypothesis',3,header=TRUE)
a<-table.row.end(a)
a<-table.row.start(a)
a<-table.element(a,'breakpoint index',header=TRUE)
a<-table.element(a,'greater',header=TRUE)
a<-table.element(a,'2-sided',header=TRUE)
a<-table.element(a,'less',header=TRUE)
a<-table.row.end(a)
for (mypoint in kp3:nmkm3) {
a<-table.row.start(a)
a<-table.element(a,mypoint,header=TRUE)
a<-table.element(a,gqarr[mypoint-kp3+1,1])
a<-table.element(a,gqarr[mypoint-kp3+1,2])
a<-table.element(a,gqarr[mypoint-kp3+1,3])
a<-table.row.end(a)
}
a<-table.end(a)
table.save(a,file='mytable5.tab')
a<-table.start()
a<-table.row.start(a)
a<-table.element(a,'Meta Analysis of Goldfeld-Quandt test for Heteroskedasticity',4,TRUE)
a<-table.row.end(a)
a<-table.row.start(a)
a<-table.element(a,'Description',header=TRUE)
a<-table.element(a,'# significant tests',header=TRUE)
a<-table.element(a,'% significant tests',header=TRUE)
a<-table.element(a,'OK/NOK',header=TRUE)
a<-table.row.end(a)
a<-table.row.start(a)
a<-table.element(a,'1% type I error level',header=TRUE)
a<-table.element(a,numsignificant1)
a<-table.element(a,numsignificant1/numgqtests)
if (numsignificant1/numgqtests < 0.01) dum <- 'OK' else dum <- 'NOK'
a<-table.element(a,dum)
a<-table.row.end(a)
a<-table.row.start(a)
a<-table.element(a,'5% type I error level',header=TRUE)
a<-table.element(a,numsignificant5)
a<-table.element(a,numsignificant5/numgqtests)
if (numsignificant5/numgqtests < 0.05) dum <- 'OK' else dum <- 'NOK'
a<-table.element(a,dum)
a<-table.row.end(a)
a<-table.row.start(a)
a<-table.element(a,'10% type I error level',header=TRUE)
a<-table.element(a,numsignificant10)
a<-table.element(a,numsignificant10/numgqtests)
if (numsignificant10/numgqtests < 0.1) dum <- 'OK' else dum <- 'NOK'
a<-table.element(a,dum)
a<-table.row.end(a)
a<-table.end(a)
table.save(a,file='mytable6.tab')
}