Free Statistics

of Irreproducible Research!

Author's title

Author*The author of this computation has been verified*
R Software Modulerwasp_multipleregression.wasp
Title produced by softwareMultiple Regression
Date of computationFri, 04 Dec 2009 05:54:13 -0700
Cite this page as followsStatistical Computations at FreeStatistics.org, Office for Research Development and Education, URL https://freestatistics.org/blog/index.php?v=date/2009/Dec/04/t1259931306pc4w2qfiz8gv7b3.htm/, Retrieved Sun, 28 Apr 2024 11:12:46 +0000
Statistical Computations at FreeStatistics.org, Office for Research Development and Education, URL https://freestatistics.org/blog/index.php?pk=63442, Retrieved Sun, 28 Apr 2024 11:12:46 +0000
QR Codes:

Original text written by user:
IsPrivate?No (this computation is public)
User-defined keywordsInclude monthly dummies
Estimated Impact128
Family? (F = Feedback message, R = changed R code, M = changed R Module, P = changed Parameters, D = changed Data)
-     [Notched Boxplots] [3/11/2009] [2009-11-02 21:10:41] [b98453cac15ba1066b407e146608df68]
- RMPD    [Multiple Regression] [Paper:Bryan Beute...] [2009-12-04 12:54:13] [b32ceebc68d054278e6bda97f3d57f91] [Current]
-   P       [Multiple Regression] [Paper:Bryan Beute...] [2009-12-04 13:31:58] [408e92805dcb18620260f240a7fb9d53]
- RMPD      [Variance Reduction Matrix] [Paper:Bryan Beute...] [2009-12-04 14:36:27] [408e92805dcb18620260f240a7fb9d53]
-    D        [Variance Reduction Matrix] [CVM Paper: Variat...] [2009-12-17 13:52:36] [03d5b865e91ca35b5a5d21b8d6da5aba]
- RMPD      [(Partial) Autocorrelation Function] [] [2009-12-04 14:39:07] [408e92805dcb18620260f240a7fb9d53]
-             [(Partial) Autocorrelation Function] [Paper:Bryan Beute...] [2009-12-04 14:44:24] [408e92805dcb18620260f240a7fb9d53]
-   PD          [(Partial) Autocorrelation Function] [CVM Paper: ACF (W...] [2009-12-17 13:43:25] [03d5b865e91ca35b5a5d21b8d6da5aba]
- RMPD      [Spectral Analysis] [Paper:Bryan Beute...] [2009-12-04 14:41:51] [408e92805dcb18620260f240a7fb9d53]
-   PD        [Spectral Analysis] [CVM Paper: Spectr...] [2009-12-17 16:39:08] [03d5b865e91ca35b5a5d21b8d6da5aba]
Feedback Forum

Post a new message
Dataseries X:
100	.309	2.99
83	.333	3.45
83	.317	2.99
83	.305	3.26
82	.314	3.26
71	.310	3.42
82	.317	3.39
86	.317	2.94
64	.311	3.77
66	.314	3.87
63	.312	3.84
67	.319	3.85
41	.309	3.55
65	.305	3.88
68	.298	3.68
90	.320	3.60
98	.323	3.11
108	.338	3.11
92	.338	3.84
100	.324	2.91
87	.310	3.29
91	.322	3.42
77	.317	3.56
72	.309	3.66
59	.305	4.05
55	.310	4.13
69	.327	3.88
71	.323	4.22
88	.329	3.95
88	.328	3.77
97	.361	4.27
94	.346	4.16
82	.323	4.07
75	.322	3.89
66	.314	4.48
71	.317	4.09
83	.322	3.76
97	.334	4.14
88	.342	4.26
89	.340	4.07
70	.335	4.45


Summary of computational transaction
Raw Inputview raw input (R code)
Raw Outputview raw output of R engine
Computing time3 seconds
R Server'Gwilym Jenkins' @ 72.249.127.135

\begin{tabular}{lllllllll}
\hline
Summary of computational transaction \tabularnewline
Raw Input & view raw input (R code)  \tabularnewline
Raw Output & view raw output of R engine  \tabularnewline
Computing time & 3 seconds \tabularnewline
R Server & 'Gwilym Jenkins' @ 72.249.127.135 \tabularnewline
\hline
\end{tabular}
%Source: https://freestatistics.org/blog/index.php?pk=63442&T=0

[TABLE]
[ROW][C]Summary of computational transaction[/C][/ROW]
[ROW][C]Raw Input[/C][C]view raw input (R code) [/C][/ROW]
[ROW][C]Raw Output[/C][C]view raw output of R engine [/C][/ROW]
[ROW][C]Computing time[/C][C]3 seconds[/C][/ROW]
[ROW][C]R Server[/C][C]'Gwilym Jenkins' @ 72.249.127.135[/C][/ROW]
[/TABLE]
Source: https://freestatistics.org/blog/index.php?pk=63442&T=0

Globally Unique Identifier (entire table): ba.freestatistics.org/blog/index.php?pk=63442&T=0

As an alternative you can also use a QR Code:  

The GUIDs for individual cells are displayed in the table below:

Summary of computational transaction
Raw Inputview raw input (R code)
Raw Outputview raw output of R engine
Computing time3 seconds
R Server'Gwilym Jenkins' @ 72.249.127.135


Multiple Linear Regression - Estimated Regression Equation
WINS[t] = -117.303237364796 + 847.806070695539OBP[t] -20.6264676476635ERA[t] -1.82894945319784M1[t] + 1.02461553276331M2[t] -1.47301486299800M3[t] + 5.68242881635786M4[t] + 2.21754466006933M5[t] + 1.30120128882525M6[t] -0.418959261383213M7[t] + 0.532020490334148M8[t] + 4.71778875876457M9[t] + 0.771801556313103M10[t] + 1.15700769424563M11[t] + e[t]

\begin{tabular}{lllllllll}
\hline
Multiple Linear Regression - Estimated Regression Equation \tabularnewline
WINS[t] =  -117.303237364796 +  847.806070695539OBP[t] -20.6264676476635ERA[t] -1.82894945319784M1[t] +  1.02461553276331M2[t] -1.47301486299800M3[t] +  5.68242881635786M4[t] +  2.21754466006933M5[t] +  1.30120128882525M6[t] -0.418959261383213M7[t] +  0.532020490334148M8[t] +  4.71778875876457M9[t] +  0.771801556313103M10[t] +  1.15700769424563M11[t]  + e[t] \tabularnewline
\hline
\end{tabular}
%Source: https://freestatistics.org/blog/index.php?pk=63442&T=1

[TABLE]
[ROW][C]Multiple Linear Regression - Estimated Regression Equation[/C][/ROW]
[ROW][C]WINS[t] =  -117.303237364796 +  847.806070695539OBP[t] -20.6264676476635ERA[t] -1.82894945319784M1[t] +  1.02461553276331M2[t] -1.47301486299800M3[t] +  5.68242881635786M4[t] +  2.21754466006933M5[t] +  1.30120128882525M6[t] -0.418959261383213M7[t] +  0.532020490334148M8[t] +  4.71778875876457M9[t] +  0.771801556313103M10[t] +  1.15700769424563M11[t]  + e[t][/C][/ROW]
[/TABLE]
Source: https://freestatistics.org/blog/index.php?pk=63442&T=1

Globally Unique Identifier (entire table): ba.freestatistics.org/blog/index.php?pk=63442&T=1

As an alternative you can also use a QR Code:  

The GUIDs for individual cells are displayed in the table below:

Multiple Linear Regression - Estimated Regression Equation
WINS[t] = -117.303237364796 + 847.806070695539OBP[t] -20.6264676476635ERA[t] -1.82894945319784M1[t] + 1.02461553276331M2[t] -1.47301486299800M3[t] + 5.68242881635786M4[t] + 2.21754466006933M5[t] + 1.30120128882525M6[t] -0.418959261383213M7[t] + 0.532020490334148M8[t] + 4.71778875876457M9[t] + 0.771801556313103M10[t] + 1.15700769424563M11[t] + e[t]


Multiple Linear Regression - Ordinary Least Squares
VariableParameterS.D.T-STATH0: parameter = 02-tail p-value1-tail p-value
(Intercept)-117.30323736479644.898079-2.61270.0145010.007251
OBP847.806070695539159.6153565.31161.3e-057e-06
ERA-20.62646764766354.459327-4.62558.3e-054.2e-05
M1-1.828949453197847.451844-0.24540.8079750.403988
M21.024615532763317.4169140.13810.891150.445575
M3-1.473014862998007.515129-0.1960.8460730.423036
M45.682428816357867.4899770.75870.4546220.227311
M52.217544660069337.6717750.28910.7747490.387375
M61.301201288825258.4647630.15370.8789740.439487
M7-0.4189592613832138.771789-0.04780.9622570.481129
M80.5320204903341488.8208510.06030.952350.476175
M94.717788758764577.9096590.59650.5558370.277918
M100.7718015563131037.9620740.09690.9234940.461747
M111.157007694245637.8952710.14650.884580.44229

\begin{tabular}{lllllllll}
\hline
Multiple Linear Regression - Ordinary Least Squares \tabularnewline
Variable & Parameter & S.D. & T-STATH0: parameter = 0 & 2-tail p-value & 1-tail p-value \tabularnewline
(Intercept) & -117.303237364796 & 44.898079 & -2.6127 & 0.014501 & 0.007251 \tabularnewline
OBP & 847.806070695539 & 159.615356 & 5.3116 & 1.3e-05 & 7e-06 \tabularnewline
ERA & -20.6264676476635 & 4.459327 & -4.6255 & 8.3e-05 & 4.2e-05 \tabularnewline
M1 & -1.82894945319784 & 7.451844 & -0.2454 & 0.807975 & 0.403988 \tabularnewline
M2 & 1.02461553276331 & 7.416914 & 0.1381 & 0.89115 & 0.445575 \tabularnewline
M3 & -1.47301486299800 & 7.515129 & -0.196 & 0.846073 & 0.423036 \tabularnewline
M4 & 5.68242881635786 & 7.489977 & 0.7587 & 0.454622 & 0.227311 \tabularnewline
M5 & 2.21754466006933 & 7.671775 & 0.2891 & 0.774749 & 0.387375 \tabularnewline
M6 & 1.30120128882525 & 8.464763 & 0.1537 & 0.878974 & 0.439487 \tabularnewline
M7 & -0.418959261383213 & 8.771789 & -0.0478 & 0.962257 & 0.481129 \tabularnewline
M8 & 0.532020490334148 & 8.820851 & 0.0603 & 0.95235 & 0.476175 \tabularnewline
M9 & 4.71778875876457 & 7.909659 & 0.5965 & 0.555837 & 0.277918 \tabularnewline
M10 & 0.771801556313103 & 7.962074 & 0.0969 & 0.923494 & 0.461747 \tabularnewline
M11 & 1.15700769424563 & 7.895271 & 0.1465 & 0.88458 & 0.44229 \tabularnewline
\hline
\end{tabular}
%Source: https://freestatistics.org/blog/index.php?pk=63442&T=2

[TABLE]
[ROW][C]Multiple Linear Regression - Ordinary Least Squares[/C][/ROW]
[ROW][C]Variable[/C][C]Parameter[/C][C]S.D.[/C][C]T-STATH0: parameter = 0[/C][C]2-tail p-value[/C][C]1-tail p-value[/C][/ROW]
[ROW][C](Intercept)[/C][C]-117.303237364796[/C][C]44.898079[/C][C]-2.6127[/C][C]0.014501[/C][C]0.007251[/C][/ROW]
[ROW][C]OBP[/C][C]847.806070695539[/C][C]159.615356[/C][C]5.3116[/C][C]1.3e-05[/C][C]7e-06[/C][/ROW]
[ROW][C]ERA[/C][C]-20.6264676476635[/C][C]4.459327[/C][C]-4.6255[/C][C]8.3e-05[/C][C]4.2e-05[/C][/ROW]
[ROW][C]M1[/C][C]-1.82894945319784[/C][C]7.451844[/C][C]-0.2454[/C][C]0.807975[/C][C]0.403988[/C][/ROW]
[ROW][C]M2[/C][C]1.02461553276331[/C][C]7.416914[/C][C]0.1381[/C][C]0.89115[/C][C]0.445575[/C][/ROW]
[ROW][C]M3[/C][C]-1.47301486299800[/C][C]7.515129[/C][C]-0.196[/C][C]0.846073[/C][C]0.423036[/C][/ROW]
[ROW][C]M4[/C][C]5.68242881635786[/C][C]7.489977[/C][C]0.7587[/C][C]0.454622[/C][C]0.227311[/C][/ROW]
[ROW][C]M5[/C][C]2.21754466006933[/C][C]7.671775[/C][C]0.2891[/C][C]0.774749[/C][C]0.387375[/C][/ROW]
[ROW][C]M6[/C][C]1.30120128882525[/C][C]8.464763[/C][C]0.1537[/C][C]0.878974[/C][C]0.439487[/C][/ROW]
[ROW][C]M7[/C][C]-0.418959261383213[/C][C]8.771789[/C][C]-0.0478[/C][C]0.962257[/C][C]0.481129[/C][/ROW]
[ROW][C]M8[/C][C]0.532020490334148[/C][C]8.820851[/C][C]0.0603[/C][C]0.95235[/C][C]0.476175[/C][/ROW]
[ROW][C]M9[/C][C]4.71778875876457[/C][C]7.909659[/C][C]0.5965[/C][C]0.555837[/C][C]0.277918[/C][/ROW]
[ROW][C]M10[/C][C]0.771801556313103[/C][C]7.962074[/C][C]0.0969[/C][C]0.923494[/C][C]0.461747[/C][/ROW]
[ROW][C]M11[/C][C]1.15700769424563[/C][C]7.895271[/C][C]0.1465[/C][C]0.88458[/C][C]0.44229[/C][/ROW]
[/TABLE]
Source: https://freestatistics.org/blog/index.php?pk=63442&T=2

Globally Unique Identifier (entire table): ba.freestatistics.org/blog/index.php?pk=63442&T=2

As an alternative you can also use a QR Code:  

The GUIDs for individual cells are displayed in the table below:

Multiple Linear Regression - Ordinary Least Squares
VariableParameterS.D.T-STATH0: parameter = 02-tail p-value1-tail p-value
(Intercept)-117.30323736479644.898079-2.61270.0145010.007251
OBP847.806070695539159.6153565.31161.3e-057e-06
ERA-20.62646764766354.459327-4.62558.3e-054.2e-05
M1-1.828949453197847.451844-0.24540.8079750.403988
M21.024615532763317.4169140.13810.891150.445575
M3-1.473014862998007.515129-0.1960.8460730.423036
M45.682428816357867.4899770.75870.4546220.227311
M52.217544660069337.6717750.28910.7747490.387375
M61.301201288825258.4647630.15370.8789740.439487
M7-0.4189592613832138.771789-0.04780.9622570.481129
M80.5320204903341488.8208510.06030.952350.476175
M94.717788758764577.9096590.59650.5558370.277918
M100.7718015563131037.9620740.09690.9234940.461747
M111.157007694245637.8952710.14650.884580.44229


Multiple Linear Regression - Regression Statistics
Multiple R0.82960034298999
R-squared0.688236729089108
Adjusted R-squared0.53812848753942
F-TEST (value)4.5849363231751
F-TEST (DF numerator)13
F-TEST (DF denominator)27
p-value0.000411719452773518
Multiple Linear Regression - Residual Statistics
Residual Standard Deviation9.65203279600039
Sum Squared Residuals2515.36690156681

\begin{tabular}{lllllllll}
\hline
Multiple Linear Regression - Regression Statistics \tabularnewline
Multiple R & 0.82960034298999 \tabularnewline
R-squared & 0.688236729089108 \tabularnewline
Adjusted R-squared & 0.53812848753942 \tabularnewline
F-TEST (value) & 4.5849363231751 \tabularnewline
F-TEST (DF numerator) & 13 \tabularnewline
F-TEST (DF denominator) & 27 \tabularnewline
p-value & 0.000411719452773518 \tabularnewline
Multiple Linear Regression - Residual Statistics \tabularnewline
Residual Standard Deviation & 9.65203279600039 \tabularnewline
Sum Squared Residuals & 2515.36690156681 \tabularnewline
\hline
\end{tabular}
%Source: https://freestatistics.org/blog/index.php?pk=63442&T=3

[TABLE]
[ROW][C]Multiple Linear Regression - Regression Statistics[/C][/ROW]
[ROW][C]Multiple R[/C][C]0.82960034298999[/C][/ROW]
[ROW][C]R-squared[/C][C]0.688236729089108[/C][/ROW]
[ROW][C]Adjusted R-squared[/C][C]0.53812848753942[/C][/ROW]
[ROW][C]F-TEST (value)[/C][C]4.5849363231751[/C][/ROW]
[ROW][C]F-TEST (DF numerator)[/C][C]13[/C][/ROW]
[ROW][C]F-TEST (DF denominator)[/C][C]27[/C][/ROW]
[ROW][C]p-value[/C][C]0.000411719452773518[/C][/ROW]
[ROW][C]Multiple Linear Regression - Residual Statistics[/C][/ROW]
[ROW][C]Residual Standard Deviation[/C][C]9.65203279600039[/C][/ROW]
[ROW][C]Sum Squared Residuals[/C][C]2515.36690156681[/C][/ROW]
[/TABLE]
Source: https://freestatistics.org/blog/index.php?pk=63442&T=3

Globally Unique Identifier (entire table): ba.freestatistics.org/blog/index.php?pk=63442&T=3

As an alternative you can also use a QR Code:  

The GUIDs for individual cells are displayed in the table below:

Multiple Linear Regression - Regression Statistics
Multiple R0.82960034298999
R-squared0.688236729089108
Adjusted R-squared0.53812848753942
F-TEST (value)4.5849363231751
F-TEST (DF numerator)13
F-TEST (DF denominator)27
p-value0.000411719452773518
Multiple Linear Regression - Residual Statistics
Residual Standard Deviation9.65203279600039
Sum Squared Residuals2515.36690156681


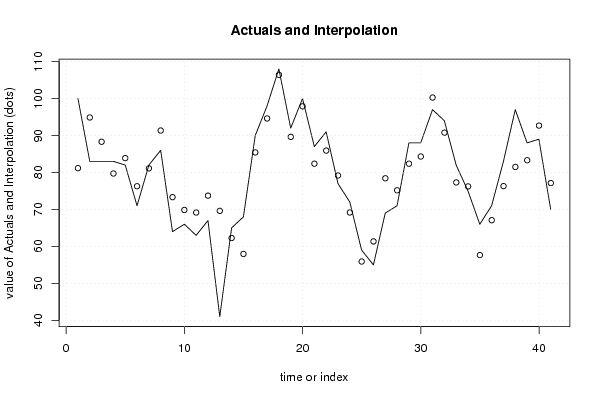
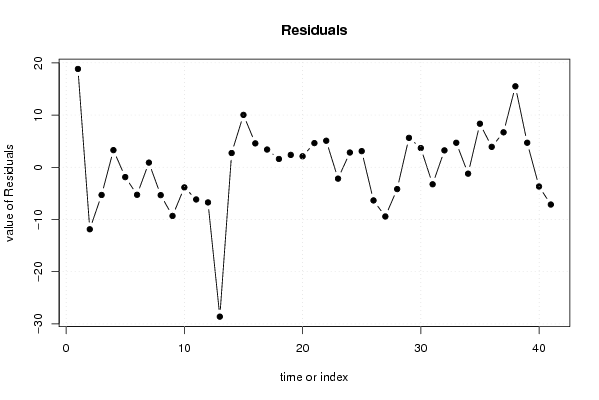
Multiple Linear Regression - Actuals, Interpolation, and Residuals
Time or IndexActualsInterpolationForecastResidualsPrediction Error
110081.166750760414118.8332492395859
28394.8794863251428-11.8794863251428
38388.3051339161781-5.30513391617807
48379.71775848231833.28224151768168
58283.8831289622896-1.88312896228963
67176.2753264846372-5.27532648463724
78281.10860245872740.891397541272554
88691.3414926518934-5.34149265189338
96473.3204563485899-9.32045634858988
106669.8552405934587-3.85524059345869
116369.16362861943-6.16362861943003
126773.7349987435766-6.73499874357655
134169.6159288777224-28.6159288777224
146562.27153525717242.7284647428276
156857.96455589607510.035444103925
169085.42185054254584.57814945745418
179894.6073537456993.39264625430099
18108106.4081014348881.59189856511197
199289.63061950188522.36938049811477
2010097.8949291761922.10507082380793
218782.37335474877284.62664525122720
229185.91959960047165.08040039952843
237779.1780699142535-2.17806991425350
247269.17596688967722.82403311032279
255955.91147077110853.08852922889154
265561.3539486987342-6.35394869873424
276978.425638416713-9.42563841671297
287175.176858813081-4.17685881308109
298882.3679573458355.63204265416507
308884.31657208047473.68342791952526
3197100.260778039387-3.26077803938732
329490.76357817191463.23642182808545
338277.30618890263734.69381109736269
347576.2251598060697-1.22515980606974
356657.65830146631658.34169853368352
367167.08903436674623.91096563325376
378376.3058495907556.69415040924496
389781.495029718950615.5049702810494
398883.3046717710344.69532822896605
408992.6835321620548-3.68353216205478
417077.1415599461764-7.14155994617644

\begin{tabular}{lllllllll}
\hline
Multiple Linear Regression - Actuals, Interpolation, and Residuals \tabularnewline
Time or Index & Actuals & InterpolationForecast & ResidualsPrediction Error \tabularnewline
1 & 100 & 81.1667507604141 & 18.8332492395859 \tabularnewline
2 & 83 & 94.8794863251428 & -11.8794863251428 \tabularnewline
3 & 83 & 88.3051339161781 & -5.30513391617807 \tabularnewline
4 & 83 & 79.7177584823183 & 3.28224151768168 \tabularnewline
5 & 82 & 83.8831289622896 & -1.88312896228963 \tabularnewline
6 & 71 & 76.2753264846372 & -5.27532648463724 \tabularnewline
7 & 82 & 81.1086024587274 & 0.891397541272554 \tabularnewline
8 & 86 & 91.3414926518934 & -5.34149265189338 \tabularnewline
9 & 64 & 73.3204563485899 & -9.32045634858988 \tabularnewline
10 & 66 & 69.8552405934587 & -3.85524059345869 \tabularnewline
11 & 63 & 69.16362861943 & -6.16362861943003 \tabularnewline
12 & 67 & 73.7349987435766 & -6.73499874357655 \tabularnewline
13 & 41 & 69.6159288777224 & -28.6159288777224 \tabularnewline
14 & 65 & 62.2715352571724 & 2.7284647428276 \tabularnewline
15 & 68 & 57.964555896075 & 10.035444103925 \tabularnewline
16 & 90 & 85.4218505425458 & 4.57814945745418 \tabularnewline
17 & 98 & 94.607353745699 & 3.39264625430099 \tabularnewline
18 & 108 & 106.408101434888 & 1.59189856511197 \tabularnewline
19 & 92 & 89.6306195018852 & 2.36938049811477 \tabularnewline
20 & 100 & 97.894929176192 & 2.10507082380793 \tabularnewline
21 & 87 & 82.3733547487728 & 4.62664525122720 \tabularnewline
22 & 91 & 85.9195996004716 & 5.08040039952843 \tabularnewline
23 & 77 & 79.1780699142535 & -2.17806991425350 \tabularnewline
24 & 72 & 69.1759668896772 & 2.82403311032279 \tabularnewline
25 & 59 & 55.9114707711085 & 3.08852922889154 \tabularnewline
26 & 55 & 61.3539486987342 & -6.35394869873424 \tabularnewline
27 & 69 & 78.425638416713 & -9.42563841671297 \tabularnewline
28 & 71 & 75.176858813081 & -4.17685881308109 \tabularnewline
29 & 88 & 82.367957345835 & 5.63204265416507 \tabularnewline
30 & 88 & 84.3165720804747 & 3.68342791952526 \tabularnewline
31 & 97 & 100.260778039387 & -3.26077803938732 \tabularnewline
32 & 94 & 90.7635781719146 & 3.23642182808545 \tabularnewline
33 & 82 & 77.3061889026373 & 4.69381109736269 \tabularnewline
34 & 75 & 76.2251598060697 & -1.22515980606974 \tabularnewline
35 & 66 & 57.6583014663165 & 8.34169853368352 \tabularnewline
36 & 71 & 67.0890343667462 & 3.91096563325376 \tabularnewline
37 & 83 & 76.305849590755 & 6.69415040924496 \tabularnewline
38 & 97 & 81.4950297189506 & 15.5049702810494 \tabularnewline
39 & 88 & 83.304671771034 & 4.69532822896605 \tabularnewline
40 & 89 & 92.6835321620548 & -3.68353216205478 \tabularnewline
41 & 70 & 77.1415599461764 & -7.14155994617644 \tabularnewline
\hline
\end{tabular}
%Source: https://freestatistics.org/blog/index.php?pk=63442&T=4

[TABLE]
[ROW][C]Multiple Linear Regression - Actuals, Interpolation, and Residuals[/C][/ROW]
[ROW][C]Time or Index[/C][C]Actuals[/C][C]InterpolationForecast[/C][C]ResidualsPrediction Error[/C][/ROW]
[ROW][C]1[/C][C]100[/C][C]81.1667507604141[/C][C]18.8332492395859[/C][/ROW]
[ROW][C]2[/C][C]83[/C][C]94.8794863251428[/C][C]-11.8794863251428[/C][/ROW]
[ROW][C]3[/C][C]83[/C][C]88.3051339161781[/C][C]-5.30513391617807[/C][/ROW]
[ROW][C]4[/C][C]83[/C][C]79.7177584823183[/C][C]3.28224151768168[/C][/ROW]
[ROW][C]5[/C][C]82[/C][C]83.8831289622896[/C][C]-1.88312896228963[/C][/ROW]
[ROW][C]6[/C][C]71[/C][C]76.2753264846372[/C][C]-5.27532648463724[/C][/ROW]
[ROW][C]7[/C][C]82[/C][C]81.1086024587274[/C][C]0.891397541272554[/C][/ROW]
[ROW][C]8[/C][C]86[/C][C]91.3414926518934[/C][C]-5.34149265189338[/C][/ROW]
[ROW][C]9[/C][C]64[/C][C]73.3204563485899[/C][C]-9.32045634858988[/C][/ROW]
[ROW][C]10[/C][C]66[/C][C]69.8552405934587[/C][C]-3.85524059345869[/C][/ROW]
[ROW][C]11[/C][C]63[/C][C]69.16362861943[/C][C]-6.16362861943003[/C][/ROW]
[ROW][C]12[/C][C]67[/C][C]73.7349987435766[/C][C]-6.73499874357655[/C][/ROW]
[ROW][C]13[/C][C]41[/C][C]69.6159288777224[/C][C]-28.6159288777224[/C][/ROW]
[ROW][C]14[/C][C]65[/C][C]62.2715352571724[/C][C]2.7284647428276[/C][/ROW]
[ROW][C]15[/C][C]68[/C][C]57.964555896075[/C][C]10.035444103925[/C][/ROW]
[ROW][C]16[/C][C]90[/C][C]85.4218505425458[/C][C]4.57814945745418[/C][/ROW]
[ROW][C]17[/C][C]98[/C][C]94.607353745699[/C][C]3.39264625430099[/C][/ROW]
[ROW][C]18[/C][C]108[/C][C]106.408101434888[/C][C]1.59189856511197[/C][/ROW]
[ROW][C]19[/C][C]92[/C][C]89.6306195018852[/C][C]2.36938049811477[/C][/ROW]
[ROW][C]20[/C][C]100[/C][C]97.894929176192[/C][C]2.10507082380793[/C][/ROW]
[ROW][C]21[/C][C]87[/C][C]82.3733547487728[/C][C]4.62664525122720[/C][/ROW]
[ROW][C]22[/C][C]91[/C][C]85.9195996004716[/C][C]5.08040039952843[/C][/ROW]
[ROW][C]23[/C][C]77[/C][C]79.1780699142535[/C][C]-2.17806991425350[/C][/ROW]
[ROW][C]24[/C][C]72[/C][C]69.1759668896772[/C][C]2.82403311032279[/C][/ROW]
[ROW][C]25[/C][C]59[/C][C]55.9114707711085[/C][C]3.08852922889154[/C][/ROW]
[ROW][C]26[/C][C]55[/C][C]61.3539486987342[/C][C]-6.35394869873424[/C][/ROW]
[ROW][C]27[/C][C]69[/C][C]78.425638416713[/C][C]-9.42563841671297[/C][/ROW]
[ROW][C]28[/C][C]71[/C][C]75.176858813081[/C][C]-4.17685881308109[/C][/ROW]
[ROW][C]29[/C][C]88[/C][C]82.367957345835[/C][C]5.63204265416507[/C][/ROW]
[ROW][C]30[/C][C]88[/C][C]84.3165720804747[/C][C]3.68342791952526[/C][/ROW]
[ROW][C]31[/C][C]97[/C][C]100.260778039387[/C][C]-3.26077803938732[/C][/ROW]
[ROW][C]32[/C][C]94[/C][C]90.7635781719146[/C][C]3.23642182808545[/C][/ROW]
[ROW][C]33[/C][C]82[/C][C]77.3061889026373[/C][C]4.69381109736269[/C][/ROW]
[ROW][C]34[/C][C]75[/C][C]76.2251598060697[/C][C]-1.22515980606974[/C][/ROW]
[ROW][C]35[/C][C]66[/C][C]57.6583014663165[/C][C]8.34169853368352[/C][/ROW]
[ROW][C]36[/C][C]71[/C][C]67.0890343667462[/C][C]3.91096563325376[/C][/ROW]
[ROW][C]37[/C][C]83[/C][C]76.305849590755[/C][C]6.69415040924496[/C][/ROW]
[ROW][C]38[/C][C]97[/C][C]81.4950297189506[/C][C]15.5049702810494[/C][/ROW]
[ROW][C]39[/C][C]88[/C][C]83.304671771034[/C][C]4.69532822896605[/C][/ROW]
[ROW][C]40[/C][C]89[/C][C]92.6835321620548[/C][C]-3.68353216205478[/C][/ROW]
[ROW][C]41[/C][C]70[/C][C]77.1415599461764[/C][C]-7.14155994617644[/C][/ROW]
[/TABLE]
Source: https://freestatistics.org/blog/index.php?pk=63442&T=4

Globally Unique Identifier (entire table): ba.freestatistics.org/blog/index.php?pk=63442&T=4

As an alternative you can also use a QR Code:  

The GUIDs for individual cells are displayed in the table below:

Multiple Linear Regression - Actuals, Interpolation, and Residuals
Time or IndexActualsInterpolationForecastResidualsPrediction Error
110081.166750760414118.8332492395859
28394.8794863251428-11.8794863251428
38388.3051339161781-5.30513391617807
48379.71775848231833.28224151768168
58283.8831289622896-1.88312896228963
67176.2753264846372-5.27532648463724
78281.10860245872740.891397541272554
88691.3414926518934-5.34149265189338
96473.3204563485899-9.32045634858988
106669.8552405934587-3.85524059345869
116369.16362861943-6.16362861943003
126773.7349987435766-6.73499874357655
134169.6159288777224-28.6159288777224
146562.27153525717242.7284647428276
156857.96455589607510.035444103925
169085.42185054254584.57814945745418
179894.6073537456993.39264625430099
18108106.4081014348881.59189856511197
199289.63061950188522.36938049811477
2010097.8949291761922.10507082380793
218782.37335474877284.62664525122720
229185.91959960047165.08040039952843
237779.1780699142535-2.17806991425350
247269.17596688967722.82403311032279
255955.91147077110853.08852922889154
265561.3539486987342-6.35394869873424
276978.425638416713-9.42563841671297
287175.176858813081-4.17685881308109
298882.3679573458355.63204265416507
308884.31657208047473.68342791952526
3197100.260778039387-3.26077803938732
329490.76357817191463.23642182808545
338277.30618890263734.69381109736269
347576.2251598060697-1.22515980606974
356657.65830146631658.34169853368352
367167.08903436674623.91096563325376
378376.3058495907556.69415040924496
389781.495029718950615.5049702810494
398883.3046717710344.69532822896605
408992.6835321620548-3.68353216205478
417077.1415599461764-7.14155994617644


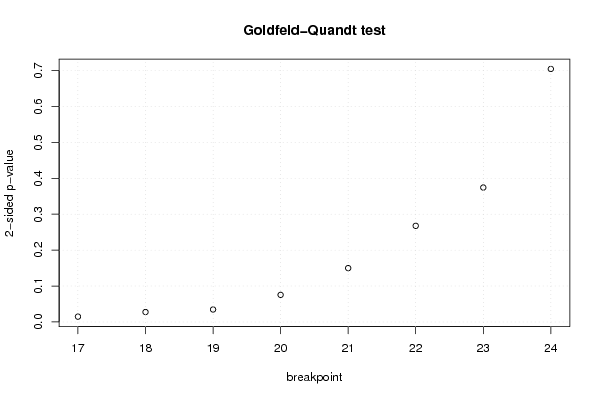
Goldfeld-Quandt test for Heteroskedasticity
p-valuesAlternative Hypothesis
breakpoint indexgreater2-sidedless
170.9926221182555820.01475576348883520.0073778817444176
180.9862098704303010.02758025913939770.0137901295696988
190.982645141462310.03470971707537980.0173548585376899
200.9622854775835430.07542904483291420.0377145224164571
210.9250405647863530.1499188704272940.0749594352136468
220.8661513290038940.2676973419922120.133848670996106
230.8128048257256310.3743903485487380.187195174274369
240.6476587238551370.7046825522897270.352341276144863

\begin{tabular}{lllllllll}
\hline
Goldfeld-Quandt test for Heteroskedasticity \tabularnewline
p-values & Alternative Hypothesis \tabularnewline
breakpoint index & greater & 2-sided & less \tabularnewline
17 & 0.992622118255582 & 0.0147557634888352 & 0.0073778817444176 \tabularnewline
18 & 0.986209870430301 & 0.0275802591393977 & 0.0137901295696988 \tabularnewline
19 & 0.98264514146231 & 0.0347097170753798 & 0.0173548585376899 \tabularnewline
20 & 0.962285477583543 & 0.0754290448329142 & 0.0377145224164571 \tabularnewline
21 & 0.925040564786353 & 0.149918870427294 & 0.0749594352136468 \tabularnewline
22 & 0.866151329003894 & 0.267697341992212 & 0.133848670996106 \tabularnewline
23 & 0.812804825725631 & 0.374390348548738 & 0.187195174274369 \tabularnewline
24 & 0.647658723855137 & 0.704682552289727 & 0.352341276144863 \tabularnewline
\hline
\end{tabular}
%Source: https://freestatistics.org/blog/index.php?pk=63442&T=5

[TABLE]
[ROW][C]Goldfeld-Quandt test for Heteroskedasticity[/C][/ROW]
[ROW][C]p-values[/C][C]Alternative Hypothesis[/C][/ROW]
[ROW][C]breakpoint index[/C][C]greater[/C][C]2-sided[/C][C]less[/C][/ROW]
[ROW][C]17[/C][C]0.992622118255582[/C][C]0.0147557634888352[/C][C]0.0073778817444176[/C][/ROW]
[ROW][C]18[/C][C]0.986209870430301[/C][C]0.0275802591393977[/C][C]0.0137901295696988[/C][/ROW]
[ROW][C]19[/C][C]0.98264514146231[/C][C]0.0347097170753798[/C][C]0.0173548585376899[/C][/ROW]
[ROW][C]20[/C][C]0.962285477583543[/C][C]0.0754290448329142[/C][C]0.0377145224164571[/C][/ROW]
[ROW][C]21[/C][C]0.925040564786353[/C][C]0.149918870427294[/C][C]0.0749594352136468[/C][/ROW]
[ROW][C]22[/C][C]0.866151329003894[/C][C]0.267697341992212[/C][C]0.133848670996106[/C][/ROW]
[ROW][C]23[/C][C]0.812804825725631[/C][C]0.374390348548738[/C][C]0.187195174274369[/C][/ROW]
[ROW][C]24[/C][C]0.647658723855137[/C][C]0.704682552289727[/C][C]0.352341276144863[/C][/ROW]
[/TABLE]
Source: https://freestatistics.org/blog/index.php?pk=63442&T=5

Globally Unique Identifier (entire table): ba.freestatistics.org/blog/index.php?pk=63442&T=5

As an alternative you can also use a QR Code:  

The GUIDs for individual cells are displayed in the table below:

Goldfeld-Quandt test for Heteroskedasticity
p-valuesAlternative Hypothesis
breakpoint indexgreater2-sidedless
170.9926221182555820.01475576348883520.0073778817444176
180.9862098704303010.02758025913939770.0137901295696988
190.982645141462310.03470971707537980.0173548585376899
200.9622854775835430.07542904483291420.0377145224164571
210.9250405647863530.1499188704272940.0749594352136468
220.8661513290038940.2676973419922120.133848670996106
230.8128048257256310.3743903485487380.187195174274369
240.6476587238551370.7046825522897270.352341276144863


Meta Analysis of Goldfeld-Quandt test for Heteroskedasticity
Description# significant tests% significant testsOK/NOK
1% type I error level00OK
5% type I error level30.375NOK
10% type I error level40.5NOK

\begin{tabular}{lllllllll}
\hline
Meta Analysis of Goldfeld-Quandt test for Heteroskedasticity \tabularnewline
Description & # significant tests & % significant tests & OK/NOK \tabularnewline
1% type I error level & 0 & 0 & OK \tabularnewline
5% type I error level & 3 & 0.375 & NOK \tabularnewline
10% type I error level & 4 & 0.5 & NOK \tabularnewline
\hline
\end{tabular}
%Source: https://freestatistics.org/blog/index.php?pk=63442&T=6

[TABLE]
[ROW][C]Meta Analysis of Goldfeld-Quandt test for Heteroskedasticity[/C][/ROW]
[ROW][C]Description[/C][C]# significant tests[/C][C]% significant tests[/C][C]OK/NOK[/C][/ROW]
[ROW][C]1% type I error level[/C][C]0[/C][C]0[/C][C]OK[/C][/ROW]
[ROW][C]5% type I error level[/C][C]3[/C][C]0.375[/C][C]NOK[/C][/ROW]
[ROW][C]10% type I error level[/C][C]4[/C][C]0.5[/C][C]NOK[/C][/ROW]
[/TABLE]
Source: https://freestatistics.org/blog/index.php?pk=63442&T=6

Globally Unique Identifier (entire table): ba.freestatistics.org/blog/index.php?pk=63442&T=6

As an alternative you can also use a QR Code:  

The GUIDs for individual cells are displayed in the table below:

Meta Analysis of Goldfeld-Quandt test for Heteroskedasticity
Description# significant tests% significant testsOK/NOK
1% type I error level00OK
5% type I error level30.375NOK
10% type I error level40.5NOK


Parameters (Session):
par1 = 1 ; par2 = Include Monthly Dummies ; par3 = No Linear Trend ;
Parameters (R input):
par1 = 1 ; par2 = Include Monthly Dummies ; par3 = No Linear Trend ;
R code (references can be found in the software module):
library(lattice)
library(lmtest)
n25 <- 25 #minimum number of obs. for Goldfeld-Quandt test
par1 <- as.numeric(par1)
x <- t(y)
k <- length(x[1,])
n <- length(x[,1])
x1 <- cbind(x[,par1], x[,1:k!=par1])
mycolnames <- c(colnames(x)[par1], colnames(x)[1:k!=par1])
colnames(x1) <- mycolnames #colnames(x)[par1]
x <- x1
if (par3 == 'First Differences'){
x2 <- array(0, dim=c(n-1,k), dimnames=list(1:(n-1), paste('(1-B)',colnames(x),sep='')))
for (i in 1:n-1) {
for (j in 1:k) {
x2[i,j] <- x[i+1,j] - x[i,j]
}
}
x <- x2
}
if (par2 == 'Include Monthly Dummies'){
x2 <- array(0, dim=c(n,11), dimnames=list(1:n, paste('M', seq(1:11), sep ='')))
for (i in 1:11){
x2[seq(i,n,12),i] <- 1
}
x <- cbind(x, x2)
}
if (par2 == 'Include Quarterly Dummies'){
x2 <- array(0, dim=c(n,3), dimnames=list(1:n, paste('Q', seq(1:3), sep ='')))
for (i in 1:3){
x2[seq(i,n,4),i] <- 1
}
x <- cbind(x, x2)
}
k <- length(x[1,])
if (par3 == 'Linear Trend'){
x <- cbind(x, c(1:n))
colnames(x)[k+1] <- 't'
}
x
k <- length(x[1,])
df <- as.data.frame(x)
(mylm <- lm(df))
(mysum <- summary(mylm))
if (n > n25) {
kp3 <- k + 3
nmkm3 <- n - k - 3
gqarr <- array(NA, dim=c(nmkm3-kp3+1,3))
numgqtests <- 0
numsignificant1 <- 0
numsignificant5 <- 0
numsignificant10 <- 0
for (mypoint in kp3:nmkm3) {
j <- 0
numgqtests <- numgqtests + 1
for (myalt in c('greater', 'two.sided', 'less')) {
j <- j + 1
gqarr[mypoint-kp3+1,j] <- gqtest(mylm, point=mypoint, alternative=myalt)$p.value
}
if (gqarr[mypoint-kp3+1,2] < 0.01) numsignificant1 <- numsignificant1 + 1
if (gqarr[mypoint-kp3+1,2] < 0.05) numsignificant5 <- numsignificant5 + 1
if (gqarr[mypoint-kp3+1,2] < 0.10) numsignificant10 <- numsignificant10 + 1
}
gqarr
}
bitmap(file='test0.png')
plot(x[,1], type='l', main='Actuals and Interpolation', ylab='value of Actuals and Interpolation (dots)', xlab='time or index')
points(x[,1]-mysum$resid)
grid()
dev.off()
bitmap(file='test1.png')
plot(mysum$resid, type='b', pch=19, main='Residuals', ylab='value of Residuals', xlab='time or index')
grid()
dev.off()
bitmap(file='test2.png')
hist(mysum$resid, main='Residual Histogram', xlab='values of Residuals')
grid()
dev.off()
bitmap(file='test3.png')
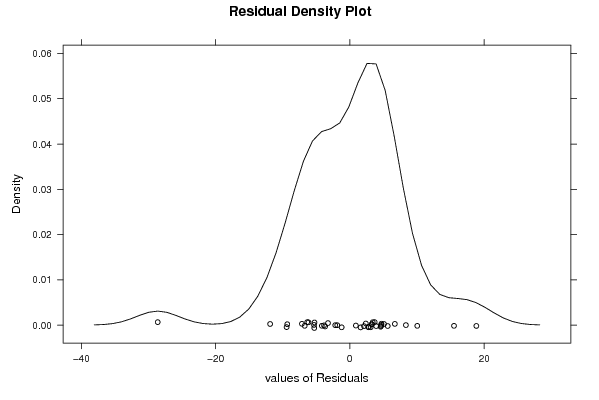
densityplot(~mysum$resid,col='black',main='Residual Density Plot', xlab='values of Residuals')
dev.off()
bitmap(file='test4.png')
qqnorm(mysum$resid, main='Residual Normal Q-Q Plot')
qqline(mysum$resid)
grid()
dev.off()
(myerror <- as.ts(mysum$resid))
bitmap(file='test5.png')
dum <- cbind(lag(myerror,k=1),myerror)
dum
dum1 <- dum[2:length(myerror),]
dum1
z <- as.data.frame(dum1)
z
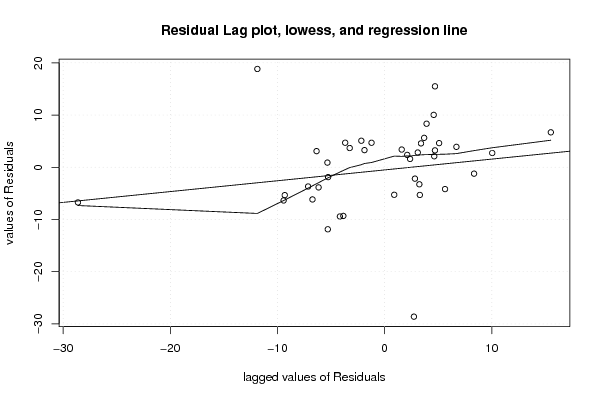
plot(z,main=paste('Residual Lag plot, lowess, and regression line'), ylab='values of Residuals', xlab='lagged values of Residuals')
lines(lowess(z))
abline(lm(z))
grid()
dev.off()
bitmap(file='test6.png')
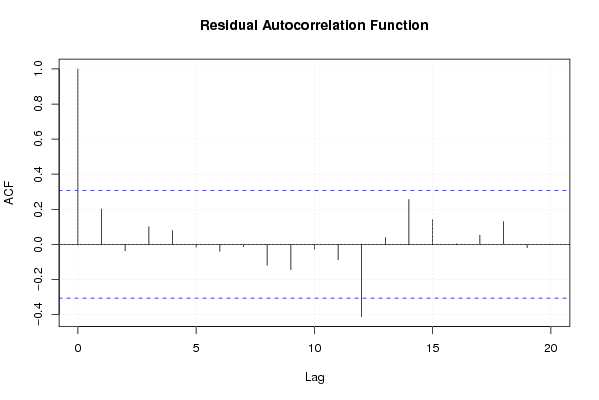
acf(mysum$resid, lag.max=length(mysum$resid)/2, main='Residual Autocorrelation Function')
grid()
dev.off()
bitmap(file='test7.png')
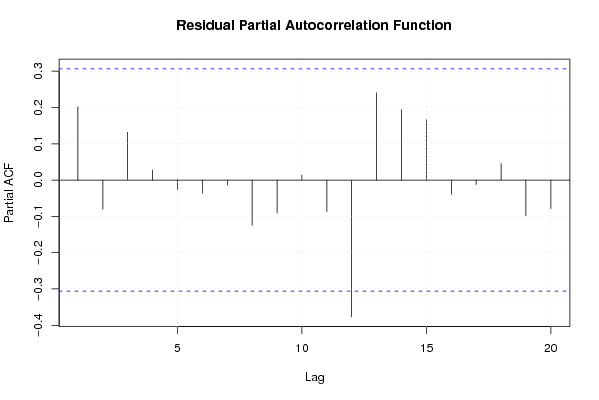
pacf(mysum$resid, lag.max=length(mysum$resid)/2, main='Residual Partial Autocorrelation Function')
grid()
dev.off()
bitmap(file='test8.png')
opar <- par(mfrow = c(2,2), oma = c(0, 0, 1.1, 0))
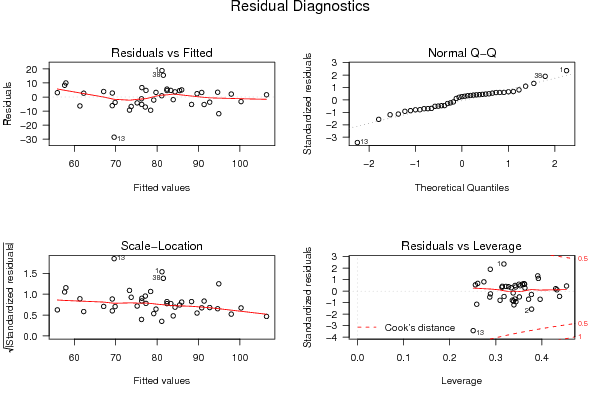
plot(mylm, las = 1, sub='Residual Diagnostics')
par(opar)
dev.off()
if (n > n25) {
bitmap(file='test9.png')
plot(kp3:nmkm3,gqarr[,2], main='Goldfeld-Quandt test',ylab='2-sided p-value',xlab='breakpoint')
grid()
dev.off()
}
load(file='createtable')
a<-table.start()
a<-table.row.start(a)
a<-table.element(a, 'Multiple Linear Regression - Estimated Regression Equation', 1, TRUE)
a<-table.row.end(a)
myeq <- colnames(x)[1]
myeq <- paste(myeq, '[t] = ', sep='')
for (i in 1:k){
if (mysum$coefficients[i,1] > 0) myeq <- paste(myeq, '+', '')
myeq <- paste(myeq, mysum$coefficients[i,1], sep=' ')
if (rownames(mysum$coefficients)[i] != '(Intercept)') {
myeq <- paste(myeq, rownames(mysum$coefficients)[i], sep='')
if (rownames(mysum$coefficients)[i] != 't') myeq <- paste(myeq, '[t]', sep='')
}
}
myeq <- paste(myeq, ' + e[t]')
a<-table.row.start(a)
a<-table.element(a, myeq)
a<-table.row.end(a)
a<-table.end(a)
table.save(a,file='mytable1.tab')
a<-table.start()
a<-table.row.start(a)
a<-table.element(a,hyperlink('ols1.htm','Multiple Linear Regression - Ordinary Least Squares',''), 6, TRUE)
a<-table.row.end(a)
a<-table.row.start(a)
a<-table.element(a,'Variable',header=TRUE)
a<-table.element(a,'Parameter',header=TRUE)
a<-table.element(a,'S.D.',header=TRUE)
a<-table.element(a,'T-STAT
H0: parameter = 0',header=TRUE)
a<-table.element(a,'2-tail p-value',header=TRUE)
a<-table.element(a,'1-tail p-value',header=TRUE)
a<-table.row.end(a)
for (i in 1:k){
a<-table.row.start(a)
a<-table.element(a,rownames(mysum$coefficients)[i],header=TRUE)
a<-table.element(a,mysum$coefficients[i,1])
a<-table.element(a, round(mysum$coefficients[i,2],6))
a<-table.element(a, round(mysum$coefficients[i,3],4))
a<-table.element(a, round(mysum$coefficients[i,4],6))
a<-table.element(a, round(mysum$coefficients[i,4]/2,6))
a<-table.row.end(a)
}
a<-table.end(a)
table.save(a,file='mytable2.tab')
a<-table.start()
a<-table.row.start(a)
a<-table.element(a, 'Multiple Linear Regression - Regression Statistics', 2, TRUE)
a<-table.row.end(a)
a<-table.row.start(a)
a<-table.element(a, 'Multiple R',1,TRUE)
a<-table.element(a, sqrt(mysum$r.squared))
a<-table.row.end(a)
a<-table.row.start(a)
a<-table.element(a, 'R-squared',1,TRUE)
a<-table.element(a, mysum$r.squared)
a<-table.row.end(a)
a<-table.row.start(a)
a<-table.element(a, 'Adjusted R-squared',1,TRUE)
a<-table.element(a, mysum$adj.r.squared)
a<-table.row.end(a)
a<-table.row.start(a)
a<-table.element(a, 'F-TEST (value)',1,TRUE)
a<-table.element(a, mysum$fstatistic[1])
a<-table.row.end(a)
a<-table.row.start(a)
a<-table.element(a, 'F-TEST (DF numerator)',1,TRUE)
a<-table.element(a, mysum$fstatistic[2])
a<-table.row.end(a)
a<-table.row.start(a)
a<-table.element(a, 'F-TEST (DF denominator)',1,TRUE)
a<-table.element(a, mysum$fstatistic[3])
a<-table.row.end(a)
a<-table.row.start(a)
a<-table.element(a, 'p-value',1,TRUE)
a<-table.element(a, 1-pf(mysum$fstatistic[1],mysum$fstatistic[2],mysum$fstatistic[3]))
a<-table.row.end(a)
a<-table.row.start(a)
a<-table.element(a, 'Multiple Linear Regression - Residual Statistics', 2, TRUE)
a<-table.row.end(a)
a<-table.row.start(a)
a<-table.element(a, 'Residual Standard Deviation',1,TRUE)
a<-table.element(a, mysum$sigma)
a<-table.row.end(a)
a<-table.row.start(a)
a<-table.element(a, 'Sum Squared Residuals',1,TRUE)
a<-table.element(a, sum(myerror*myerror))
a<-table.row.end(a)
a<-table.end(a)
table.save(a,file='mytable3.tab')
a<-table.start()
a<-table.row.start(a)
a<-table.element(a, 'Multiple Linear Regression - Actuals, Interpolation, and Residuals', 4, TRUE)
a<-table.row.end(a)
a<-table.row.start(a)
a<-table.element(a, 'Time or Index', 1, TRUE)
a<-table.element(a, 'Actuals', 1, TRUE)
a<-table.element(a, 'Interpolation
Forecast', 1, TRUE)
a<-table.element(a, 'Residuals
Prediction Error', 1, TRUE)
a<-table.row.end(a)
for (i in 1:n) {
a<-table.row.start(a)
a<-table.element(a,i, 1, TRUE)
a<-table.element(a,x[i])
a<-table.element(a,x[i]-mysum$resid[i])
a<-table.element(a,mysum$resid[i])
a<-table.row.end(a)
}
a<-table.end(a)
table.save(a,file='mytable4.tab')
if (n > n25) {
a<-table.start()
a<-table.row.start(a)
a<-table.element(a,'Goldfeld-Quandt test for Heteroskedasticity',4,TRUE)
a<-table.row.end(a)
a<-table.row.start(a)
a<-table.element(a,'p-values',header=TRUE)
a<-table.element(a,'Alternative Hypothesis',3,header=TRUE)
a<-table.row.end(a)
a<-table.row.start(a)
a<-table.element(a,'breakpoint index',header=TRUE)
a<-table.element(a,'greater',header=TRUE)
a<-table.element(a,'2-sided',header=TRUE)
a<-table.element(a,'less',header=TRUE)
a<-table.row.end(a)
for (mypoint in kp3:nmkm3) {
a<-table.row.start(a)
a<-table.element(a,mypoint,header=TRUE)
a<-table.element(a,gqarr[mypoint-kp3+1,1])
a<-table.element(a,gqarr[mypoint-kp3+1,2])
a<-table.element(a,gqarr[mypoint-kp3+1,3])
a<-table.row.end(a)
}
a<-table.end(a)
table.save(a,file='mytable5.tab')
a<-table.start()
a<-table.row.start(a)
a<-table.element(a,'Meta Analysis of Goldfeld-Quandt test for Heteroskedasticity',4,TRUE)
a<-table.row.end(a)
a<-table.row.start(a)
a<-table.element(a,'Description',header=TRUE)
a<-table.element(a,'# significant tests',header=TRUE)
a<-table.element(a,'% significant tests',header=TRUE)
a<-table.element(a,'OK/NOK',header=TRUE)
a<-table.row.end(a)
a<-table.row.start(a)
a<-table.element(a,'1% type I error level',header=TRUE)
a<-table.element(a,numsignificant1)
a<-table.element(a,numsignificant1/numgqtests)
if (numsignificant1/numgqtests < 0.01) dum <- 'OK' else dum <- 'NOK'
a<-table.element(a,dum)
a<-table.row.end(a)
a<-table.row.start(a)
a<-table.element(a,'5% type I error level',header=TRUE)
a<-table.element(a,numsignificant5)
a<-table.element(a,numsignificant5/numgqtests)
if (numsignificant5/numgqtests < 0.05) dum <- 'OK' else dum <- 'NOK'
a<-table.element(a,dum)
a<-table.row.end(a)
a<-table.row.start(a)
a<-table.element(a,'10% type I error level',header=TRUE)
a<-table.element(a,numsignificant10)
a<-table.element(a,numsignificant10/numgqtests)
if (numsignificant10/numgqtests < 0.1) dum <- 'OK' else dum <- 'NOK'
a<-table.element(a,dum)
a<-table.row.end(a)
a<-table.end(a)
table.save(a,file='mytable6.tab')
}