Free Statistics

of Irreproducible Research!

Author's title

Author*The author of this computation has been verified*
R Software Modulerwasp_arimabackwardselection.wasp
Title produced by softwareARIMA Backward Selection
Date of computationFri, 04 Dec 2009 05:54:25 -0700
Cite this page as followsStatistical Computations at FreeStatistics.org, Office for Research Development and Education, URL https://freestatistics.org/blog/index.php?v=date/2009/Dec/04/t1259931670csdp439zfe1fbu1.htm/, Retrieved Sat, 27 Apr 2024 19:19:05 +0000
Statistical Computations at FreeStatistics.org, Office for Research Development and Education, URL https://freestatistics.org/blog/index.php?pk=63450, Retrieved Sat, 27 Apr 2024 19:19:05 +0000
QR Codes:

Original text written by user:
IsPrivate?No (this computation is public)
User-defined keywords
Estimated Impact112
Family? (F = Feedback message, R = changed R code, M = changed R Module, P = changed Parameters, D = changed Data)
-       [ARIMA Backward Selection] [] [2009-12-04 12:54:25] [208e60166df5802f3c494097313a670f] [Current]
Feedback Forum

Post a new message
Dataseries X:
1169
2154
2249
2687
4359
5382
4459
6398
4596
3024
1887
2070
1351
2218
2461
3028
4784
4975
4607
6249
4809
3157
1910
2228
1594
2467
2222
3607
4685
4962
5770
5480
5000
3228
1993
2288
1580
2111
2192
3601
4665
4876
5813
5589
5331
3075
2002
2306
1507
1992
2487
3490
4647
5594
5611
5788
6204
3013
1931
2549


Summary of computational transaction
Raw Inputview raw input (R code)
Raw Outputview raw output of R engine
Computing time9 seconds
R Server'Gwilym Jenkins' @ 72.249.127.135

\begin{tabular}{lllllllll}
\hline
Summary of computational transaction \tabularnewline
Raw Input & view raw input (R code)  \tabularnewline
Raw Output & view raw output of R engine  \tabularnewline
Computing time & 9 seconds \tabularnewline
R Server & 'Gwilym Jenkins' @ 72.249.127.135 \tabularnewline
\hline
\end{tabular}
%Source: https://freestatistics.org/blog/index.php?pk=63450&T=0

[TABLE]
[ROW][C]Summary of computational transaction[/C][/ROW]
[ROW][C]Raw Input[/C][C]view raw input (R code) [/C][/ROW]
[ROW][C]Raw Output[/C][C]view raw output of R engine [/C][/ROW]
[ROW][C]Computing time[/C][C]9 seconds[/C][/ROW]
[ROW][C]R Server[/C][C]'Gwilym Jenkins' @ 72.249.127.135[/C][/ROW]
[/TABLE]
Source: https://freestatistics.org/blog/index.php?pk=63450&T=0

Globally Unique Identifier (entire table): ba.freestatistics.org/blog/index.php?pk=63450&T=0

As an alternative you can also use a QR Code:  

The GUIDs for individual cells are displayed in the table below:

Summary of computational transaction
Raw Inputview raw input (R code)
Raw Outputview raw output of R engine
Computing time9 seconds
R Server'Gwilym Jenkins' @ 72.249.127.135


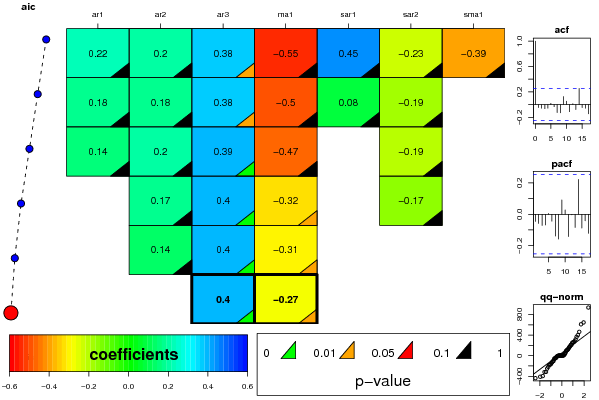
ARIMA Parameter Estimation and Backward Selection
Iterationar1ar2ar3ma1sar1sar2sma1
Estimates ( 1 )0.22270.19530.3764-0.54590.4486-0.2251-0.3855
(p-val)(0.5557 )(0.2358 )(0.0138 )(0.1929 )(0.6789 )(0.3206 )(0.7315 )
Estimates ( 2 )0.18240.18370.3776-0.50270.0786-0.19010
(p-val)(0.6261 )(0.2508 )(0.0117 )(0.2255 )(0.6734 )(0.3916 )(NA )
Estimates ( 3 )0.1440.19880.3884-0.47280-0.19430
(p-val)(0.715 )(0.2123 )(0.0094 )(0.2918 )(NA )(0.3838 )(NA )
Estimates ( 4 )00.16840.4042-0.31540-0.1680
(p-val)(NA )(0.228 )(0.0026 )(0.0394 )(NA )(0.4246 )(NA )
Estimates ( 5 )00.1430.4016-0.3087000
(p-val)(NA )(0.2909 )(0.0029 )(0.0395 )(NA )(NA )(NA )
Estimates ( 6 )000.3989-0.2691000
(p-val)(NA )(NA )(0.0039 )(0.0378 )(NA )(NA )(NA )
Estimates ( 7 )NANANANANANANA
(p-val)(NA )(NA )(NA )(NA )(NA )(NA )(NA )
Estimates ( 8 )NANANANANANANA
(p-val)(NA )(NA )(NA )(NA )(NA )(NA )(NA )
Estimates ( 9 )NANANANANANANA
(p-val)(NA )(NA )(NA )(NA )(NA )(NA )(NA )
Estimates ( 10 )NANANANANANANA
(p-val)(NA )(NA )(NA )(NA )(NA )(NA )(NA )
Estimates ( 11 )NANANANANANANA
(p-val)(NA )(NA )(NA )(NA )(NA )(NA )(NA )
Estimates ( 12 )NANANANANANANA
(p-val)(NA )(NA )(NA )(NA )(NA )(NA )(NA )
Estimates ( 13 )NANANANANANANA
(p-val)(NA )(NA )(NA )(NA )(NA )(NA )(NA )

\begin{tabular}{lllllllll}
\hline
ARIMA Parameter Estimation and Backward Selection \tabularnewline
Iteration & ar1 & ar2 & ar3 & ma1 & sar1 & sar2 & sma1 \tabularnewline
Estimates ( 1 ) & 0.2227 & 0.1953 & 0.3764 & -0.5459 & 0.4486 & -0.2251 & -0.3855 \tabularnewline
(p-val) & (0.5557 ) & (0.2358 ) & (0.0138 ) & (0.1929 ) & (0.6789 ) & (0.3206 ) & (0.7315 ) \tabularnewline
Estimates ( 2 ) & 0.1824 & 0.1837 & 0.3776 & -0.5027 & 0.0786 & -0.1901 & 0 \tabularnewline
(p-val) & (0.6261 ) & (0.2508 ) & (0.0117 ) & (0.2255 ) & (0.6734 ) & (0.3916 ) & (NA ) \tabularnewline
Estimates ( 3 ) & 0.144 & 0.1988 & 0.3884 & -0.4728 & 0 & -0.1943 & 0 \tabularnewline
(p-val) & (0.715 ) & (0.2123 ) & (0.0094 ) & (0.2918 ) & (NA ) & (0.3838 ) & (NA ) \tabularnewline
Estimates ( 4 ) & 0 & 0.1684 & 0.4042 & -0.3154 & 0 & -0.168 & 0 \tabularnewline
(p-val) & (NA ) & (0.228 ) & (0.0026 ) & (0.0394 ) & (NA ) & (0.4246 ) & (NA ) \tabularnewline
Estimates ( 5 ) & 0 & 0.143 & 0.4016 & -0.3087 & 0 & 0 & 0 \tabularnewline
(p-val) & (NA ) & (0.2909 ) & (0.0029 ) & (0.0395 ) & (NA ) & (NA ) & (NA ) \tabularnewline
Estimates ( 6 ) & 0 & 0 & 0.3989 & -0.2691 & 0 & 0 & 0 \tabularnewline
(p-val) & (NA ) & (NA ) & (0.0039 ) & (0.0378 ) & (NA ) & (NA ) & (NA ) \tabularnewline
Estimates ( 7 ) & NA & NA & NA & NA & NA & NA & NA \tabularnewline
(p-val) & (NA ) & (NA ) & (NA ) & (NA ) & (NA ) & (NA ) & (NA ) \tabularnewline
Estimates ( 8 ) & NA & NA & NA & NA & NA & NA & NA \tabularnewline
(p-val) & (NA ) & (NA ) & (NA ) & (NA ) & (NA ) & (NA ) & (NA ) \tabularnewline
Estimates ( 9 ) & NA & NA & NA & NA & NA & NA & NA \tabularnewline
(p-val) & (NA ) & (NA ) & (NA ) & (NA ) & (NA ) & (NA ) & (NA ) \tabularnewline
Estimates ( 10 ) & NA & NA & NA & NA & NA & NA & NA \tabularnewline
(p-val) & (NA ) & (NA ) & (NA ) & (NA ) & (NA ) & (NA ) & (NA ) \tabularnewline
Estimates ( 11 ) & NA & NA & NA & NA & NA & NA & NA \tabularnewline
(p-val) & (NA ) & (NA ) & (NA ) & (NA ) & (NA ) & (NA ) & (NA ) \tabularnewline
Estimates ( 12 ) & NA & NA & NA & NA & NA & NA & NA \tabularnewline
(p-val) & (NA ) & (NA ) & (NA ) & (NA ) & (NA ) & (NA ) & (NA ) \tabularnewline
Estimates ( 13 ) & NA & NA & NA & NA & NA & NA & NA \tabularnewline
(p-val) & (NA ) & (NA ) & (NA ) & (NA ) & (NA ) & (NA ) & (NA ) \tabularnewline
\hline
\end{tabular}
%Source: https://freestatistics.org/blog/index.php?pk=63450&T=1

[TABLE]
[ROW][C]ARIMA Parameter Estimation and Backward Selection[/C][/ROW]
[ROW][C]Iteration[/C][C]ar1[/C][C]ar2[/C][C]ar3[/C][C]ma1[/C][C]sar1[/C][C]sar2[/C][C]sma1[/C][/ROW]
[ROW][C]Estimates ( 1 )[/C][C]0.2227[/C][C]0.1953[/C][C]0.3764[/C][C]-0.5459[/C][C]0.4486[/C][C]-0.2251[/C][C]-0.3855[/C][/ROW]
[ROW][C](p-val)[/C][C](0.5557 )[/C][C](0.2358 )[/C][C](0.0138 )[/C][C](0.1929 )[/C][C](0.6789 )[/C][C](0.3206 )[/C][C](0.7315 )[/C][/ROW]
[ROW][C]Estimates ( 2 )[/C][C]0.1824[/C][C]0.1837[/C][C]0.3776[/C][C]-0.5027[/C][C]0.0786[/C][C]-0.1901[/C][C]0[/C][/ROW]
[ROW][C](p-val)[/C][C](0.6261 )[/C][C](0.2508 )[/C][C](0.0117 )[/C][C](0.2255 )[/C][C](0.6734 )[/C][C](0.3916 )[/C][C](NA )[/C][/ROW]
[ROW][C]Estimates ( 3 )[/C][C]0.144[/C][C]0.1988[/C][C]0.3884[/C][C]-0.4728[/C][C]0[/C][C]-0.1943[/C][C]0[/C][/ROW]
[ROW][C](p-val)[/C][C](0.715 )[/C][C](0.2123 )[/C][C](0.0094 )[/C][C](0.2918 )[/C][C](NA )[/C][C](0.3838 )[/C][C](NA )[/C][/ROW]
[ROW][C]Estimates ( 4 )[/C][C]0[/C][C]0.1684[/C][C]0.4042[/C][C]-0.3154[/C][C]0[/C][C]-0.168[/C][C]0[/C][/ROW]
[ROW][C](p-val)[/C][C](NA )[/C][C](0.228 )[/C][C](0.0026 )[/C][C](0.0394 )[/C][C](NA )[/C][C](0.4246 )[/C][C](NA )[/C][/ROW]
[ROW][C]Estimates ( 5 )[/C][C]0[/C][C]0.143[/C][C]0.4016[/C][C]-0.3087[/C][C]0[/C][C]0[/C][C]0[/C][/ROW]
[ROW][C](p-val)[/C][C](NA )[/C][C](0.2909 )[/C][C](0.0029 )[/C][C](0.0395 )[/C][C](NA )[/C][C](NA )[/C][C](NA )[/C][/ROW]
[ROW][C]Estimates ( 6 )[/C][C]0[/C][C]0[/C][C]0.3989[/C][C]-0.2691[/C][C]0[/C][C]0[/C][C]0[/C][/ROW]
[ROW][C](p-val)[/C][C](NA )[/C][C](NA )[/C][C](0.0039 )[/C][C](0.0378 )[/C][C](NA )[/C][C](NA )[/C][C](NA )[/C][/ROW]
[ROW][C]Estimates ( 7 )[/C][C]NA[/C][C]NA[/C][C]NA[/C][C]NA[/C][C]NA[/C][C]NA[/C][C]NA[/C][/ROW]
[ROW][C](p-val)[/C][C](NA )[/C][C](NA )[/C][C](NA )[/C][C](NA )[/C][C](NA )[/C][C](NA )[/C][C](NA )[/C][/ROW]
[ROW][C]Estimates ( 8 )[/C][C]NA[/C][C]NA[/C][C]NA[/C][C]NA[/C][C]NA[/C][C]NA[/C][C]NA[/C][/ROW]
[ROW][C](p-val)[/C][C](NA )[/C][C](NA )[/C][C](NA )[/C][C](NA )[/C][C](NA )[/C][C](NA )[/C][C](NA )[/C][/ROW]
[ROW][C]Estimates ( 9 )[/C][C]NA[/C][C]NA[/C][C]NA[/C][C]NA[/C][C]NA[/C][C]NA[/C][C]NA[/C][/ROW]
[ROW][C](p-val)[/C][C](NA )[/C][C](NA )[/C][C](NA )[/C][C](NA )[/C][C](NA )[/C][C](NA )[/C][C](NA )[/C][/ROW]
[ROW][C]Estimates ( 10 )[/C][C]NA[/C][C]NA[/C][C]NA[/C][C]NA[/C][C]NA[/C][C]NA[/C][C]NA[/C][/ROW]
[ROW][C](p-val)[/C][C](NA )[/C][C](NA )[/C][C](NA )[/C][C](NA )[/C][C](NA )[/C][C](NA )[/C][C](NA )[/C][/ROW]
[ROW][C]Estimates ( 11 )[/C][C]NA[/C][C]NA[/C][C]NA[/C][C]NA[/C][C]NA[/C][C]NA[/C][C]NA[/C][/ROW]
[ROW][C](p-val)[/C][C](NA )[/C][C](NA )[/C][C](NA )[/C][C](NA )[/C][C](NA )[/C][C](NA )[/C][C](NA )[/C][/ROW]
[ROW][C]Estimates ( 12 )[/C][C]NA[/C][C]NA[/C][C]NA[/C][C]NA[/C][C]NA[/C][C]NA[/C][C]NA[/C][/ROW]
[ROW][C](p-val)[/C][C](NA )[/C][C](NA )[/C][C](NA )[/C][C](NA )[/C][C](NA )[/C][C](NA )[/C][C](NA )[/C][/ROW]
[ROW][C]Estimates ( 13 )[/C][C]NA[/C][C]NA[/C][C]NA[/C][C]NA[/C][C]NA[/C][C]NA[/C][C]NA[/C][/ROW]
[ROW][C](p-val)[/C][C](NA )[/C][C](NA )[/C][C](NA )[/C][C](NA )[/C][C](NA )[/C][C](NA )[/C][C](NA )[/C][/ROW]
[/TABLE]
Source: https://freestatistics.org/blog/index.php?pk=63450&T=1

Globally Unique Identifier (entire table): ba.freestatistics.org/blog/index.php?pk=63450&T=1

As an alternative you can also use a QR Code:  

The GUIDs for individual cells are displayed in the table below:

ARIMA Parameter Estimation and Backward Selection
Iterationar1ar2ar3ma1sar1sar2sma1
Estimates ( 1 )0.22270.19530.3764-0.54590.4486-0.2251-0.3855
(p-val)(0.5557 )(0.2358 )(0.0138 )(0.1929 )(0.6789 )(0.3206 )(0.7315 )
Estimates ( 2 )0.18240.18370.3776-0.50270.0786-0.19010
(p-val)(0.6261 )(0.2508 )(0.0117 )(0.2255 )(0.6734 )(0.3916 )(NA )
Estimates ( 3 )0.1440.19880.3884-0.47280-0.19430
(p-val)(0.715 )(0.2123 )(0.0094 )(0.2918 )(NA )(0.3838 )(NA )
Estimates ( 4 )00.16840.4042-0.31540-0.1680
(p-val)(NA )(0.228 )(0.0026 )(0.0394 )(NA )(0.4246 )(NA )
Estimates ( 5 )00.1430.4016-0.3087000
(p-val)(NA )(0.2909 )(0.0029 )(0.0395 )(NA )(NA )(NA )
Estimates ( 6 )000.3989-0.2691000
(p-val)(NA )(NA )(0.0039 )(0.0378 )(NA )(NA )(NA )
Estimates ( 7 )NANANANANANANA
(p-val)(NA )(NA )(NA )(NA )(NA )(NA )(NA )
Estimates ( 8 )NANANANANANANA
(p-val)(NA )(NA )(NA )(NA )(NA )(NA )(NA )
Estimates ( 9 )NANANANANANANA
(p-val)(NA )(NA )(NA )(NA )(NA )(NA )(NA )
Estimates ( 10 )NANANANANANANA
(p-val)(NA )(NA )(NA )(NA )(NA )(NA )(NA )
Estimates ( 11 )NANANANANANANA
(p-val)(NA )(NA )(NA )(NA )(NA )(NA )(NA )
Estimates ( 12 )NANANANANANANA
(p-val)(NA )(NA )(NA )(NA )(NA )(NA )(NA )
Estimates ( 13 )NANANANANANANA
(p-val)(NA )(NA )(NA )(NA )(NA )(NA )(NA )


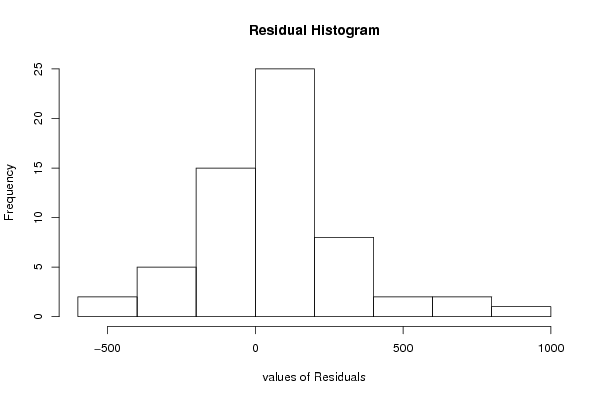
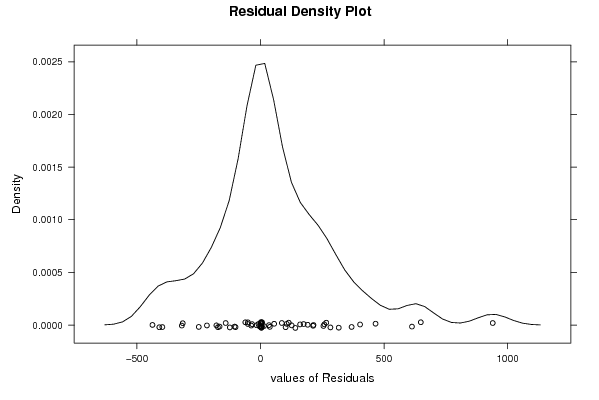
Estimated ARIMA Residuals
Value
2.06999634941504
160.160591901881
101.653825091510
214.425559357372
316.590851338859
465.571941647846
-397.29388919477
-172.386429648398
-314.692758977089
258.159546194238
174.559848444493
106.260345600553
86.224122974923
212.906532711516
282.88130978281
-249.900369741832
368.63984278492
-51.028869874848
-15.5825667335685
939.796644001414
-437.276688829219
-105.124179676387
-318.564349733256
266.210433528641
55.3034748117589
-37.3188154820368
-409.439536008771
-178.483811682255
-4.54683430232171
125.875128961007
-34.2365608908985
37.7025778430734
140.973336868474
402.907019936968
-61.4921611548084
-101.110451426134
-124.270782364199
-51.1954928244093
-140.992955593687
254.690538763783
13.9621115899849
-8.09308738515392
612.893560339995
34.3485265889221
114.123833759777
648.739662538549
190.922266255158
-216.874754257582
-165.716811320284

\begin{tabular}{lllllllll}
\hline
Estimated ARIMA Residuals \tabularnewline
Value \tabularnewline
2.06999634941504 \tabularnewline
160.160591901881 \tabularnewline
101.653825091510 \tabularnewline
214.425559357372 \tabularnewline
316.590851338859 \tabularnewline
465.571941647846 \tabularnewline
-397.29388919477 \tabularnewline
-172.386429648398 \tabularnewline
-314.692758977089 \tabularnewline
258.159546194238 \tabularnewline
174.559848444493 \tabularnewline
106.260345600553 \tabularnewline
86.224122974923 \tabularnewline
212.906532711516 \tabularnewline
282.88130978281 \tabularnewline
-249.900369741832 \tabularnewline
368.63984278492 \tabularnewline
-51.028869874848 \tabularnewline
-15.5825667335685 \tabularnewline
939.796644001414 \tabularnewline
-437.276688829219 \tabularnewline
-105.124179676387 \tabularnewline
-318.564349733256 \tabularnewline
266.210433528641 \tabularnewline
55.3034748117589 \tabularnewline
-37.3188154820368 \tabularnewline
-409.439536008771 \tabularnewline
-178.483811682255 \tabularnewline
-4.54683430232171 \tabularnewline
125.875128961007 \tabularnewline
-34.2365608908985 \tabularnewline
37.7025778430734 \tabularnewline
140.973336868474 \tabularnewline
402.907019936968 \tabularnewline
-61.4921611548084 \tabularnewline
-101.110451426134 \tabularnewline
-124.270782364199 \tabularnewline
-51.1954928244093 \tabularnewline
-140.992955593687 \tabularnewline
254.690538763783 \tabularnewline
13.9621115899849 \tabularnewline
-8.09308738515392 \tabularnewline
612.893560339995 \tabularnewline
34.3485265889221 \tabularnewline
114.123833759777 \tabularnewline
648.739662538549 \tabularnewline
190.922266255158 \tabularnewline
-216.874754257582 \tabularnewline
-165.716811320284 \tabularnewline
\hline
\end{tabular}
%Source: https://freestatistics.org/blog/index.php?pk=63450&T=2

[TABLE]
[ROW][C]Estimated ARIMA Residuals[/C][/ROW]
[ROW][C]Value[/C][/ROW]
[ROW][C]2.06999634941504[/C][/ROW]
[ROW][C]160.160591901881[/C][/ROW]
[ROW][C]101.653825091510[/C][/ROW]
[ROW][C]214.425559357372[/C][/ROW]
[ROW][C]316.590851338859[/C][/ROW]
[ROW][C]465.571941647846[/C][/ROW]
[ROW][C]-397.29388919477[/C][/ROW]
[ROW][C]-172.386429648398[/C][/ROW]
[ROW][C]-314.692758977089[/C][/ROW]
[ROW][C]258.159546194238[/C][/ROW]
[ROW][C]174.559848444493[/C][/ROW]
[ROW][C]106.260345600553[/C][/ROW]
[ROW][C]86.224122974923[/C][/ROW]
[ROW][C]212.906532711516[/C][/ROW]
[ROW][C]282.88130978281[/C][/ROW]
[ROW][C]-249.900369741832[/C][/ROW]
[ROW][C]368.63984278492[/C][/ROW]
[ROW][C]-51.028869874848[/C][/ROW]
[ROW][C]-15.5825667335685[/C][/ROW]
[ROW][C]939.796644001414[/C][/ROW]
[ROW][C]-437.276688829219[/C][/ROW]
[ROW][C]-105.124179676387[/C][/ROW]
[ROW][C]-318.564349733256[/C][/ROW]
[ROW][C]266.210433528641[/C][/ROW]
[ROW][C]55.3034748117589[/C][/ROW]
[ROW][C]-37.3188154820368[/C][/ROW]
[ROW][C]-409.439536008771[/C][/ROW]
[ROW][C]-178.483811682255[/C][/ROW]
[ROW][C]-4.54683430232171[/C][/ROW]
[ROW][C]125.875128961007[/C][/ROW]
[ROW][C]-34.2365608908985[/C][/ROW]
[ROW][C]37.7025778430734[/C][/ROW]
[ROW][C]140.973336868474[/C][/ROW]
[ROW][C]402.907019936968[/C][/ROW]
[ROW][C]-61.4921611548084[/C][/ROW]
[ROW][C]-101.110451426134[/C][/ROW]
[ROW][C]-124.270782364199[/C][/ROW]
[ROW][C]-51.1954928244093[/C][/ROW]
[ROW][C]-140.992955593687[/C][/ROW]
[ROW][C]254.690538763783[/C][/ROW]
[ROW][C]13.9621115899849[/C][/ROW]
[ROW][C]-8.09308738515392[/C][/ROW]
[ROW][C]612.893560339995[/C][/ROW]
[ROW][C]34.3485265889221[/C][/ROW]
[ROW][C]114.123833759777[/C][/ROW]
[ROW][C]648.739662538549[/C][/ROW]
[ROW][C]190.922266255158[/C][/ROW]
[ROW][C]-216.874754257582[/C][/ROW]
[ROW][C]-165.716811320284[/C][/ROW]
[/TABLE]
Source: https://freestatistics.org/blog/index.php?pk=63450&T=2

Globally Unique Identifier (entire table): ba.freestatistics.org/blog/index.php?pk=63450&T=2

As an alternative you can also use a QR Code:  

The GUIDs for individual cells are displayed in the table below:

Estimated ARIMA Residuals
Value
2.06999634941504
160.160591901881
101.653825091510
214.425559357372
316.590851338859
465.571941647846
-397.29388919477
-172.386429648398
-314.692758977089
258.159546194238
174.559848444493
106.260345600553
86.224122974923
212.906532711516
282.88130978281
-249.900369741832
368.63984278492
-51.028869874848
-15.5825667335685
939.796644001414
-437.276688829219
-105.124179676387
-318.564349733256
266.210433528641
55.3034748117589
-37.3188154820368
-409.439536008771
-178.483811682255
-4.54683430232171
125.875128961007
-34.2365608908985
37.7025778430734
140.973336868474
402.907019936968
-61.4921611548084
-101.110451426134
-124.270782364199
-51.1954928244093
-140.992955593687
254.690538763783
13.9621115899849
-8.09308738515392
612.893560339995
34.3485265889221
114.123833759777
648.739662538549
190.922266255158
-216.874754257582
-165.716811320284


Parameters (Session):
par1 = FALSE ; par2 = 1 ; par3 = 0 ; par4 = 1 ; par5 = 12 ; par6 = 3 ; par7 = 1 ; par8 = 2 ; par9 = 1 ;
Parameters (R input):
par1 = FALSE ; par2 = 1 ; par3 = 0 ; par4 = 1 ; par5 = 12 ; par6 = 3 ; par7 = 1 ; par8 = 2 ; par9 = 1 ;
R code (references can be found in the software module):
library(lattice)
if (par1 == 'TRUE') par1 <- TRUE
if (par1 == 'FALSE') par1 <- FALSE
par2 <- as.numeric(par2) #Box-Cox lambda transformation parameter
par3 <- as.numeric(par3) #degree of non-seasonal differencing
par4 <- as.numeric(par4) #degree of seasonal differencing
par5 <- as.numeric(par5) #seasonal period
par6 <- as.numeric(par6) #degree (p) of the non-seasonal AR(p) polynomial
par7 <- as.numeric(par7) #degree (q) of the non-seasonal MA(q) polynomial
par8 <- as.numeric(par8) #degree (P) of the seasonal AR(P) polynomial
par9 <- as.numeric(par9) #degree (Q) of the seasonal MA(Q) polynomial
armaGR <- function(arima.out, names, n){
try1 <- arima.out$coef
try2 <- sqrt(diag(arima.out$var.coef))
try.data.frame <- data.frame(matrix(NA,ncol=4,nrow=length(names)))
dimnames(try.data.frame) <- list(names,c('coef','std','tstat','pv'))
try.data.frame[,1] <- try1
for(i in 1:length(try2)) try.data.frame[which(rownames(try.data.frame)==names(try2)[i]),2] <- try2[i]
try.data.frame[,3] <- try.data.frame[,1] / try.data.frame[,2]
try.data.frame[,4] <- round((1-pt(abs(try.data.frame[,3]),df=n-(length(try2)+1)))*2,5)
vector <- rep(NA,length(names))
vector[is.na(try.data.frame[,4])] <- 0
maxi <- which.max(try.data.frame[,4])
continue <- max(try.data.frame[,4],na.rm=TRUE) > .05
vector[maxi] <- 0
list(summary=try.data.frame,next.vector=vector,continue=continue)
}
arimaSelect <- function(series, order=c(13,0,0), seasonal=list(order=c(2,0,0),period=12), include.mean=F){
nrc <- order[1]+order[3]+seasonal$order[1]+seasonal$order[3]
coeff <- matrix(NA, nrow=nrc*2, ncol=nrc)
pval <- matrix(NA, nrow=nrc*2, ncol=nrc)
mylist <- rep(list(NULL), nrc)
names <- NULL
if(order[1] > 0) names <- paste('ar',1:order[1],sep='')
if(order[3] > 0) names <- c( names , paste('ma',1:order[3],sep='') )
if(seasonal$order[1] > 0) names <- c(names, paste('sar',1:seasonal$order[1],sep=''))
if(seasonal$order[3] > 0) names <- c(names, paste('sma',1:seasonal$order[3],sep=''))
arima.out <- arima(series, order=order, seasonal=seasonal, include.mean=include.mean, method='ML')
mylist[[1]] <- arima.out
last.arma <- armaGR(arima.out, names, length(series))
mystop <- FALSE
i <- 1
coeff[i,] <- last.arma[[1]][,1]
pval [i,] <- last.arma[[1]][,4]
i <- 2
aic <- arima.out$aic
while(!mystop){
mylist[[i]] <- arima.out
arima.out <- arima(series, order=order, seasonal=seasonal, include.mean=include.mean, method='ML', fixed=last.arma$next.vector)
aic <- c(aic, arima.out$aic)
last.arma <- armaGR(arima.out, names, length(series))
mystop <- !last.arma$continue
coeff[i,] <- last.arma[[1]][,1]
pval [i,] <- last.arma[[1]][,4]
i <- i+1
}
list(coeff, pval, mylist, aic=aic)
}
arimaSelectplot <- function(arimaSelect.out,noms,choix){
noms <- names(arimaSelect.out[[3]][[1]]$coef)
coeff <- arimaSelect.out[[1]]
k <- min(which(is.na(coeff[,1])))-1
coeff <- coeff[1:k,]
pval <- arimaSelect.out[[2]][1:k,]
aic <- arimaSelect.out$aic[1:k]
coeff[coeff==0] <- NA
n <- ncol(coeff)
if(missing(choix)) choix <- k
layout(matrix(c(1,1,1,2,
3,3,3,2,
3,3,3,4,
5,6,7,7),nr=4),
widths=c(10,35,45,15),
heights=c(30,30,15,15))
couleurs <- rainbow(75)[1:50]#(50)
ticks <- pretty(coeff)
par(mar=c(1,1,3,1))
plot(aic,k:1-.5,type='o',pch=21,bg='blue',cex=2,axes=F,lty=2,xpd=NA)
points(aic[choix],k-choix+.5,pch=21,cex=4,bg=2,xpd=NA)
title('aic',line=2)
par(mar=c(3,0,0,0))
plot(0,axes=F,xlab='',ylab='',xlim=range(ticks),ylim=c(.1,1))
rect(xleft = min(ticks) + (0:49)/50*(max(ticks)-min(ticks)),
xright = min(ticks) + (1:50)/50*(max(ticks)-min(ticks)),
ytop = rep(1,50),
ybottom= rep(0,50),col=couleurs,border=NA)
axis(1,ticks)
rect(xleft=min(ticks),xright=max(ticks),ytop=1,ybottom=0)
text(mean(coeff,na.rm=T),.5,'coefficients',cex=2,font=2)
par(mar=c(1,1,3,1))
image(1:n,1:k,t(coeff[k:1,]),axes=F,col=couleurs,zlim=range(ticks))
for(i in 1:n) for(j in 1:k) if(!is.na(coeff[j,i])) {
if(pval[j,i]<.01) symb = 'green'
else if( (pval[j,i]<.05) & (pval[j,i]>=.01)) symb = 'orange'
else if( (pval[j,i]<.1) & (pval[j,i]>=.05)) symb = 'red'
else symb = 'black'
polygon(c(i+.5 ,i+.2 ,i+.5 ,i+.5),
c(k-j+0.5,k-j+0.5,k-j+0.8,k-j+0.5),
col=symb)
if(j==choix) {
rect(xleft=i-.5,
xright=i+.5,
ybottom=k-j+1.5,
ytop=k-j+.5,
lwd=4)
text(i,
k-j+1,
round(coeff[j,i],2),
cex=1.2,
font=2)
}
else{
rect(xleft=i-.5,xright=i+.5,ybottom=k-j+1.5,ytop=k-j+.5)
text(i,k-j+1,round(coeff[j,i],2),cex=1.2,font=1)
}
}
axis(3,1:n,noms)
par(mar=c(0.5,0,0,0.5))
plot(0,axes=F,xlab='',ylab='',type='n',xlim=c(0,8),ylim=c(-.2,.8))
cols <- c('green','orange','red','black')
niv <- c('0','0.01','0.05','0.1')
for(i in 0:3){
polygon(c(1+2*i ,1+2*i ,1+2*i-.5 ,1+2*i),
c(.4 ,.7 , .4 , .4),
col=cols[i+1])
text(2*i,0.5,niv[i+1],cex=1.5)
}
text(8,.5,1,cex=1.5)
text(4,0,'p-value',cex=2)
box()
residus <- arimaSelect.out[[3]][[choix]]$res
par(mar=c(1,2,4,1))
acf(residus,main='')
title('acf',line=.5)
par(mar=c(1,2,4,1))
pacf(residus,main='')
title('pacf',line=.5)
par(mar=c(2,2,4,1))
qqnorm(residus,main='')
title('qq-norm',line=.5)
qqline(residus)
residus
}
if (par2 == 0) x <- log(x)
if (par2 != 0) x <- x^par2
(selection <- arimaSelect(x, order=c(par6,par3,par7), seasonal=list(order=c(par8,par4,par9), period=par5)))
bitmap(file='test1.png')
resid <- arimaSelectplot(selection)
dev.off()
resid
bitmap(file='test2.png')
acf(resid,length(resid)/2, main='Residual Autocorrelation Function')
dev.off()
bitmap(file='test3.png')
pacf(resid,length(resid)/2, main='Residual Partial Autocorrelation Function')
dev.off()
bitmap(file='test4.png')
cpgram(resid, main='Residual Cumulative Periodogram')
dev.off()
bitmap(file='test5.png')
hist(resid, main='Residual Histogram', xlab='values of Residuals')
dev.off()
bitmap(file='test6.png')
densityplot(~resid,col='black',main='Residual Density Plot', xlab='values of Residuals')
dev.off()
bitmap(file='test7.png')
qqnorm(resid, main='Residual Normal Q-Q Plot')
qqline(resid)
dev.off()
ncols <- length(selection[[1]][1,])
nrows <- length(selection[[2]][,1])-1
load(file='createtable')
a<-table.start()
a<-table.row.start(a)
a<-table.element(a,'ARIMA Parameter Estimation and Backward Selection', ncols+1,TRUE)
a<-table.row.end(a)
a<-table.row.start(a)
a<-table.element(a,'Iteration', header=TRUE)
for (i in 1:ncols) {
a<-table.element(a,names(selection[[3]][[1]]$coef)[i],header=TRUE)
}
a<-table.row.end(a)
for (j in 1:nrows) {
a<-table.row.start(a)
mydum <- 'Estimates ('
mydum <- paste(mydum,j)
mydum <- paste(mydum,')')
a<-table.element(a,mydum, header=TRUE)
for (i in 1:ncols) {
a<-table.element(a,round(selection[[1]][j,i],4))
}
a<-table.row.end(a)
a<-table.row.start(a)
a<-table.element(a,'(p-val)', header=TRUE)
for (i in 1:ncols) {
mydum <- '('
mydum <- paste(mydum,round(selection[[2]][j,i],4),sep='')
mydum <- paste(mydum,')')
a<-table.element(a,mydum)
}
a<-table.row.end(a)
}
a<-table.end(a)
table.save(a,file='mytable.tab')
a<-table.start()
a<-table.row.start(a)
a<-table.element(a,'Estimated ARIMA Residuals', 1,TRUE)
a<-table.row.end(a)
a<-table.row.start(a)
a<-table.element(a,'Value', 1,TRUE)
a<-table.row.end(a)
for (i in (par4*par5+par3):length(resid)) {
a<-table.row.start(a)
a<-table.element(a,resid[i])
a<-table.row.end(a)
}
a<-table.end(a)
table.save(a,file='mytable1.tab')