Free Statistics

of Irreproducible Research!

Author's title

Author*The author of this computation has been verified*
R Software Modulerwasp_autocorrelation.wasp
Title produced by software(Partial) Autocorrelation Function
Date of computationFri, 04 Dec 2009 06:07:45 -0700
Cite this page as followsStatistical Computations at FreeStatistics.org, Office for Research Development and Education, URL https://freestatistics.org/blog/index.php?v=date/2009/Dec/04/t12599321076tgaelvm3e97cbq.htm/, Retrieved Sun, 28 Apr 2024 17:54:52 +0000
Statistical Computations at FreeStatistics.org, Office for Research Development and Education, URL https://freestatistics.org/blog/index.php?pk=63456, Retrieved Sun, 28 Apr 2024 17:54:52 +0000
QR Codes:

Original text written by user:
IsPrivate?No (this computation is public)
User-defined keywordsWorkshop 9 - Autocorrelatie 2
Estimated Impact133
Family? (F = Feedback message, R = changed R code, M = changed R Module, P = changed Parameters, D = changed Data)
-     [Univariate Data Series] [data set] [2008-12-01 19:54:57] [b98453cac15ba1066b407e146608df68]
- RMP   [(Partial) Autocorrelation Function] [] [2009-11-27 14:46:03] [b98453cac15ba1066b407e146608df68]
-    D    [(Partial) Autocorrelation Function] [BBWS9-Autocorella...] [2009-12-01 20:15:32] [408e92805dcb18620260f240a7fb9d53]
-   PD        [(Partial) Autocorrelation Function] [shw-ws9] [2009-12-04 13:07:45] [5b5bced41faf164488f2c271c918b21f] [Current]
Feedback Forum

Post a new message
Dataseries X:
1178
2141
2238
2685
4341
5376
4478
6404
4617
3024
1897
2075
1351
2211
2453
3042
4765
4992
4601
6266
4812
3159
1916
2237
1595
2453
2226
3597
4706
4974
5756
5493
5004
3225
2006
2291
1588
2105
2191
3591
4668
4885
5822
5599
5340
3082
2010
2301
1514
1979
2480
3499
4676
5585
5610
5796
6199
3030
1930
2552


Summary of computational transaction
Raw Inputview raw input (R code)
Raw Outputview raw output of R engine
Computing time1 seconds
R Server'Gwilym Jenkins' @ 72.249.127.135

\begin{tabular}{lllllllll}
\hline
Summary of computational transaction \tabularnewline
Raw Input & view raw input (R code)  \tabularnewline
Raw Output & view raw output of R engine  \tabularnewline
Computing time & 1 seconds \tabularnewline
R Server & 'Gwilym Jenkins' @ 72.249.127.135 \tabularnewline
\hline
\end{tabular}
%Source: https://freestatistics.org/blog/index.php?pk=63456&T=0

[TABLE]
[ROW][C]Summary of computational transaction[/C][/ROW]
[ROW][C]Raw Input[/C][C]view raw input (R code) [/C][/ROW]
[ROW][C]Raw Output[/C][C]view raw output of R engine [/C][/ROW]
[ROW][C]Computing time[/C][C]1 seconds[/C][/ROW]
[ROW][C]R Server[/C][C]'Gwilym Jenkins' @ 72.249.127.135[/C][/ROW]
[/TABLE]
Source: https://freestatistics.org/blog/index.php?pk=63456&T=0

Globally Unique Identifier (entire table): ba.freestatistics.org/blog/index.php?pk=63456&T=0

As an alternative you can also use a QR Code:  

The GUIDs for individual cells are displayed in the table below:

Summary of computational transaction
Raw Inputview raw input (R code)
Raw Outputview raw output of R engine
Computing time1 seconds
R Server'Gwilym Jenkins' @ 72.249.127.135


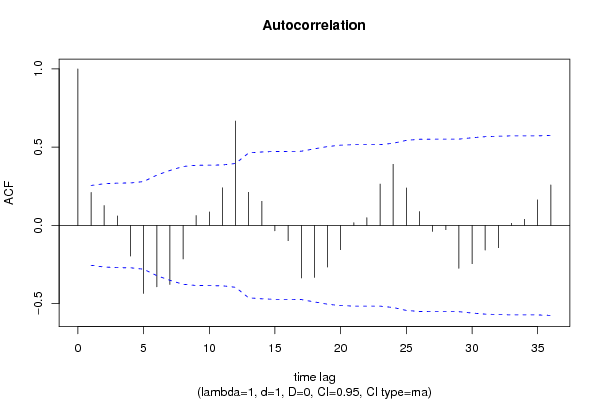
Autocorrelation Function
Time lag kACF(k)T-STATP-value
10.2108991.61990.055289
20.1267340.97350.167149
30.0605760.46530.321717
4-0.195778-1.50380.068984
5-0.435197-3.34280.000722
6-0.39303-3.01890.001872
7-0.377181-2.89720.002638
8-0.214386-1.64670.052465
90.0630970.48470.314858
100.0859270.660.255905
110.2402971.84580.034974
120.6665695.122e-06
130.2116571.62580.054664
140.153921.18230.120918
15-0.034505-0.2650.395952
16-0.097609-0.74970.228193
17-0.336299-2.58320.006144
18-0.332456-2.55360.006632
19-0.266746-2.04890.022463
20-0.155016-1.19070.119271
210.0168690.12960.448672
220.0488840.37550.354322
230.2641132.02870.023505
240.39083.00180.001965
250.2395661.84010.035389
260.087950.67560.250981
27-0.038431-0.29520.384441
28-0.027409-0.21050.416989
29-0.274419-2.10790.019651
30-0.244562-1.87850.032627
31-0.157571-1.21030.115491
32-0.142803-1.09690.138573
330.0134110.1030.459152
340.0390480.29990.382642
350.1630671.25250.107658
360.2586351.98660.025808

\begin{tabular}{lllllllll}
\hline
Autocorrelation Function \tabularnewline
Time lag k & ACF(k) & T-STAT & P-value \tabularnewline
1 & 0.210899 & 1.6199 & 0.055289 \tabularnewline
2 & 0.126734 & 0.9735 & 0.167149 \tabularnewline
3 & 0.060576 & 0.4653 & 0.321717 \tabularnewline
4 & -0.195778 & -1.5038 & 0.068984 \tabularnewline
5 & -0.435197 & -3.3428 & 0.000722 \tabularnewline
6 & -0.39303 & -3.0189 & 0.001872 \tabularnewline
7 & -0.377181 & -2.8972 & 0.002638 \tabularnewline
8 & -0.214386 & -1.6467 & 0.052465 \tabularnewline
9 & 0.063097 & 0.4847 & 0.314858 \tabularnewline
10 & 0.085927 & 0.66 & 0.255905 \tabularnewline
11 & 0.240297 & 1.8458 & 0.034974 \tabularnewline
12 & 0.666569 & 5.12 & 2e-06 \tabularnewline
13 & 0.211657 & 1.6258 & 0.054664 \tabularnewline
14 & 0.15392 & 1.1823 & 0.120918 \tabularnewline
15 & -0.034505 & -0.265 & 0.395952 \tabularnewline
16 & -0.097609 & -0.7497 & 0.228193 \tabularnewline
17 & -0.336299 & -2.5832 & 0.006144 \tabularnewline
18 & -0.332456 & -2.5536 & 0.006632 \tabularnewline
19 & -0.266746 & -2.0489 & 0.022463 \tabularnewline
20 & -0.155016 & -1.1907 & 0.119271 \tabularnewline
21 & 0.016869 & 0.1296 & 0.448672 \tabularnewline
22 & 0.048884 & 0.3755 & 0.354322 \tabularnewline
23 & 0.264113 & 2.0287 & 0.023505 \tabularnewline
24 & 0.3908 & 3.0018 & 0.001965 \tabularnewline
25 & 0.239566 & 1.8401 & 0.035389 \tabularnewline
26 & 0.08795 & 0.6756 & 0.250981 \tabularnewline
27 & -0.038431 & -0.2952 & 0.384441 \tabularnewline
28 & -0.027409 & -0.2105 & 0.416989 \tabularnewline
29 & -0.274419 & -2.1079 & 0.019651 \tabularnewline
30 & -0.244562 & -1.8785 & 0.032627 \tabularnewline
31 & -0.157571 & -1.2103 & 0.115491 \tabularnewline
32 & -0.142803 & -1.0969 & 0.138573 \tabularnewline
33 & 0.013411 & 0.103 & 0.459152 \tabularnewline
34 & 0.039048 & 0.2999 & 0.382642 \tabularnewline
35 & 0.163067 & 1.2525 & 0.107658 \tabularnewline
36 & 0.258635 & 1.9866 & 0.025808 \tabularnewline
\hline
\end{tabular}
%Source: https://freestatistics.org/blog/index.php?pk=63456&T=1

[TABLE]
[ROW][C]Autocorrelation Function[/C][/ROW]
[ROW][C]Time lag k[/C][C]ACF(k)[/C][C]T-STAT[/C][C]P-value[/C][/ROW]
[ROW][C]1[/C][C]0.210899[/C][C]1.6199[/C][C]0.055289[/C][/ROW]
[ROW][C]2[/C][C]0.126734[/C][C]0.9735[/C][C]0.167149[/C][/ROW]
[ROW][C]3[/C][C]0.060576[/C][C]0.4653[/C][C]0.321717[/C][/ROW]
[ROW][C]4[/C][C]-0.195778[/C][C]-1.5038[/C][C]0.068984[/C][/ROW]
[ROW][C]5[/C][C]-0.435197[/C][C]-3.3428[/C][C]0.000722[/C][/ROW]
[ROW][C]6[/C][C]-0.39303[/C][C]-3.0189[/C][C]0.001872[/C][/ROW]
[ROW][C]7[/C][C]-0.377181[/C][C]-2.8972[/C][C]0.002638[/C][/ROW]
[ROW][C]8[/C][C]-0.214386[/C][C]-1.6467[/C][C]0.052465[/C][/ROW]
[ROW][C]9[/C][C]0.063097[/C][C]0.4847[/C][C]0.314858[/C][/ROW]
[ROW][C]10[/C][C]0.085927[/C][C]0.66[/C][C]0.255905[/C][/ROW]
[ROW][C]11[/C][C]0.240297[/C][C]1.8458[/C][C]0.034974[/C][/ROW]
[ROW][C]12[/C][C]0.666569[/C][C]5.12[/C][C]2e-06[/C][/ROW]
[ROW][C]13[/C][C]0.211657[/C][C]1.6258[/C][C]0.054664[/C][/ROW]
[ROW][C]14[/C][C]0.15392[/C][C]1.1823[/C][C]0.120918[/C][/ROW]
[ROW][C]15[/C][C]-0.034505[/C][C]-0.265[/C][C]0.395952[/C][/ROW]
[ROW][C]16[/C][C]-0.097609[/C][C]-0.7497[/C][C]0.228193[/C][/ROW]
[ROW][C]17[/C][C]-0.336299[/C][C]-2.5832[/C][C]0.006144[/C][/ROW]
[ROW][C]18[/C][C]-0.332456[/C][C]-2.5536[/C][C]0.006632[/C][/ROW]
[ROW][C]19[/C][C]-0.266746[/C][C]-2.0489[/C][C]0.022463[/C][/ROW]
[ROW][C]20[/C][C]-0.155016[/C][C]-1.1907[/C][C]0.119271[/C][/ROW]
[ROW][C]21[/C][C]0.016869[/C][C]0.1296[/C][C]0.448672[/C][/ROW]
[ROW][C]22[/C][C]0.048884[/C][C]0.3755[/C][C]0.354322[/C][/ROW]
[ROW][C]23[/C][C]0.264113[/C][C]2.0287[/C][C]0.023505[/C][/ROW]
[ROW][C]24[/C][C]0.3908[/C][C]3.0018[/C][C]0.001965[/C][/ROW]
[ROW][C]25[/C][C]0.239566[/C][C]1.8401[/C][C]0.035389[/C][/ROW]
[ROW][C]26[/C][C]0.08795[/C][C]0.6756[/C][C]0.250981[/C][/ROW]
[ROW][C]27[/C][C]-0.038431[/C][C]-0.2952[/C][C]0.384441[/C][/ROW]
[ROW][C]28[/C][C]-0.027409[/C][C]-0.2105[/C][C]0.416989[/C][/ROW]
[ROW][C]29[/C][C]-0.274419[/C][C]-2.1079[/C][C]0.019651[/C][/ROW]
[ROW][C]30[/C][C]-0.244562[/C][C]-1.8785[/C][C]0.032627[/C][/ROW]
[ROW][C]31[/C][C]-0.157571[/C][C]-1.2103[/C][C]0.115491[/C][/ROW]
[ROW][C]32[/C][C]-0.142803[/C][C]-1.0969[/C][C]0.138573[/C][/ROW]
[ROW][C]33[/C][C]0.013411[/C][C]0.103[/C][C]0.459152[/C][/ROW]
[ROW][C]34[/C][C]0.039048[/C][C]0.2999[/C][C]0.382642[/C][/ROW]
[ROW][C]35[/C][C]0.163067[/C][C]1.2525[/C][C]0.107658[/C][/ROW]
[ROW][C]36[/C][C]0.258635[/C][C]1.9866[/C][C]0.025808[/C][/ROW]
[/TABLE]
Source: https://freestatistics.org/blog/index.php?pk=63456&T=1

Globally Unique Identifier (entire table): ba.freestatistics.org/blog/index.php?pk=63456&T=1

As an alternative you can also use a QR Code:  

The GUIDs for individual cells are displayed in the table below:

Autocorrelation Function
Time lag kACF(k)T-STATP-value
10.2108991.61990.055289
20.1267340.97350.167149
30.0605760.46530.321717
4-0.195778-1.50380.068984
5-0.435197-3.34280.000722
6-0.39303-3.01890.001872
7-0.377181-2.89720.002638
8-0.214386-1.64670.052465
90.0630970.48470.314858
100.0859270.660.255905
110.2402971.84580.034974
120.6665695.122e-06
130.2116571.62580.054664
140.153921.18230.120918
15-0.034505-0.2650.395952
16-0.097609-0.74970.228193
17-0.336299-2.58320.006144
18-0.332456-2.55360.006632
19-0.266746-2.04890.022463
20-0.155016-1.19070.119271
210.0168690.12960.448672
220.0488840.37550.354322
230.2641132.02870.023505
240.39083.00180.001965
250.2395661.84010.035389
260.087950.67560.250981
27-0.038431-0.29520.384441
28-0.027409-0.21050.416989
29-0.274419-2.10790.019651
30-0.244562-1.87850.032627
31-0.157571-1.21030.115491
32-0.142803-1.09690.138573
330.0134110.1030.459152
340.0390480.29990.382642
350.1630671.25250.107658
360.2586351.98660.025808


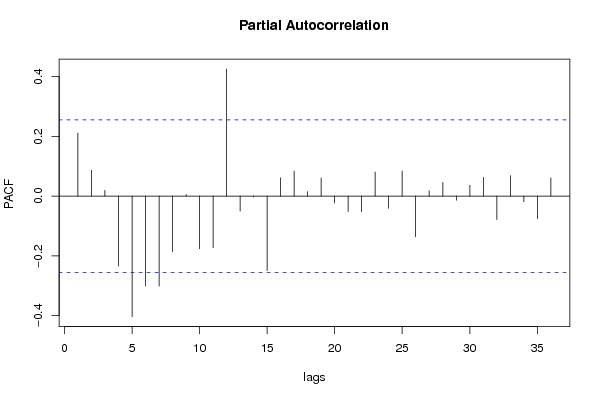
Partial Autocorrelation Function
Time lag kPACF(k)T-STATP-value
10.2108991.61990.055289
20.0860840.66120.25552
30.0189720.14570.442316
4-0.233944-1.7970.038731
5-0.403707-3.10090.001478
6-0.3008-2.31050.012188
7-0.301229-2.31380.012091
8-0.186845-1.43520.078258
90.0054520.04190.483368
10-0.176225-1.35360.090512
11-0.173411-1.3320.093992
120.4255123.26840.000903
13-0.050269-0.38610.350397
14-0.003544-0.02720.489186
15-0.249232-1.91440.030212
160.0612430.47040.319895
170.0835950.64210.261646
180.0151730.11650.453808
190.0601370.46190.322918
20-0.023365-0.17950.429093
21-0.051956-0.39910.345637
22-0.052675-0.40460.343615
230.0803830.61740.269662
24-0.040498-0.31110.378423
250.0842480.64710.260031
26-0.136441-1.0480.149451
270.017450.1340.446915
280.0455590.34990.363814
29-0.01385-0.10640.45782
300.036070.27710.391352
310.0623150.47870.316977
32-0.078596-0.60370.274176
330.0688130.52860.299545
34-0.01882-0.14460.442775
35-0.076164-0.5850.280379
360.0606740.4660.32145

\begin{tabular}{lllllllll}
\hline
Partial Autocorrelation Function \tabularnewline
Time lag k & PACF(k) & T-STAT & P-value \tabularnewline
1 & 0.210899 & 1.6199 & 0.055289 \tabularnewline
2 & 0.086084 & 0.6612 & 0.25552 \tabularnewline
3 & 0.018972 & 0.1457 & 0.442316 \tabularnewline
4 & -0.233944 & -1.797 & 0.038731 \tabularnewline
5 & -0.403707 & -3.1009 & 0.001478 \tabularnewline
6 & -0.3008 & -2.3105 & 0.012188 \tabularnewline
7 & -0.301229 & -2.3138 & 0.012091 \tabularnewline
8 & -0.186845 & -1.4352 & 0.078258 \tabularnewline
9 & 0.005452 & 0.0419 & 0.483368 \tabularnewline
10 & -0.176225 & -1.3536 & 0.090512 \tabularnewline
11 & -0.173411 & -1.332 & 0.093992 \tabularnewline
12 & 0.425512 & 3.2684 & 0.000903 \tabularnewline
13 & -0.050269 & -0.3861 & 0.350397 \tabularnewline
14 & -0.003544 & -0.0272 & 0.489186 \tabularnewline
15 & -0.249232 & -1.9144 & 0.030212 \tabularnewline
16 & 0.061243 & 0.4704 & 0.319895 \tabularnewline
17 & 0.083595 & 0.6421 & 0.261646 \tabularnewline
18 & 0.015173 & 0.1165 & 0.453808 \tabularnewline
19 & 0.060137 & 0.4619 & 0.322918 \tabularnewline
20 & -0.023365 & -0.1795 & 0.429093 \tabularnewline
21 & -0.051956 & -0.3991 & 0.345637 \tabularnewline
22 & -0.052675 & -0.4046 & 0.343615 \tabularnewline
23 & 0.080383 & 0.6174 & 0.269662 \tabularnewline
24 & -0.040498 & -0.3111 & 0.378423 \tabularnewline
25 & 0.084248 & 0.6471 & 0.260031 \tabularnewline
26 & -0.136441 & -1.048 & 0.149451 \tabularnewline
27 & 0.01745 & 0.134 & 0.446915 \tabularnewline
28 & 0.045559 & 0.3499 & 0.363814 \tabularnewline
29 & -0.01385 & -0.1064 & 0.45782 \tabularnewline
30 & 0.03607 & 0.2771 & 0.391352 \tabularnewline
31 & 0.062315 & 0.4787 & 0.316977 \tabularnewline
32 & -0.078596 & -0.6037 & 0.274176 \tabularnewline
33 & 0.068813 & 0.5286 & 0.299545 \tabularnewline
34 & -0.01882 & -0.1446 & 0.442775 \tabularnewline
35 & -0.076164 & -0.585 & 0.280379 \tabularnewline
36 & 0.060674 & 0.466 & 0.32145 \tabularnewline
\hline
\end{tabular}
%Source: https://freestatistics.org/blog/index.php?pk=63456&T=2

[TABLE]
[ROW][C]Partial Autocorrelation Function[/C][/ROW]
[ROW][C]Time lag k[/C][C]PACF(k)[/C][C]T-STAT[/C][C]P-value[/C][/ROW]
[ROW][C]1[/C][C]0.210899[/C][C]1.6199[/C][C]0.055289[/C][/ROW]
[ROW][C]2[/C][C]0.086084[/C][C]0.6612[/C][C]0.25552[/C][/ROW]
[ROW][C]3[/C][C]0.018972[/C][C]0.1457[/C][C]0.442316[/C][/ROW]
[ROW][C]4[/C][C]-0.233944[/C][C]-1.797[/C][C]0.038731[/C][/ROW]
[ROW][C]5[/C][C]-0.403707[/C][C]-3.1009[/C][C]0.001478[/C][/ROW]
[ROW][C]6[/C][C]-0.3008[/C][C]-2.3105[/C][C]0.012188[/C][/ROW]
[ROW][C]7[/C][C]-0.301229[/C][C]-2.3138[/C][C]0.012091[/C][/ROW]
[ROW][C]8[/C][C]-0.186845[/C][C]-1.4352[/C][C]0.078258[/C][/ROW]
[ROW][C]9[/C][C]0.005452[/C][C]0.0419[/C][C]0.483368[/C][/ROW]
[ROW][C]10[/C][C]-0.176225[/C][C]-1.3536[/C][C]0.090512[/C][/ROW]
[ROW][C]11[/C][C]-0.173411[/C][C]-1.332[/C][C]0.093992[/C][/ROW]
[ROW][C]12[/C][C]0.425512[/C][C]3.2684[/C][C]0.000903[/C][/ROW]
[ROW][C]13[/C][C]-0.050269[/C][C]-0.3861[/C][C]0.350397[/C][/ROW]
[ROW][C]14[/C][C]-0.003544[/C][C]-0.0272[/C][C]0.489186[/C][/ROW]
[ROW][C]15[/C][C]-0.249232[/C][C]-1.9144[/C][C]0.030212[/C][/ROW]
[ROW][C]16[/C][C]0.061243[/C][C]0.4704[/C][C]0.319895[/C][/ROW]
[ROW][C]17[/C][C]0.083595[/C][C]0.6421[/C][C]0.261646[/C][/ROW]
[ROW][C]18[/C][C]0.015173[/C][C]0.1165[/C][C]0.453808[/C][/ROW]
[ROW][C]19[/C][C]0.060137[/C][C]0.4619[/C][C]0.322918[/C][/ROW]
[ROW][C]20[/C][C]-0.023365[/C][C]-0.1795[/C][C]0.429093[/C][/ROW]
[ROW][C]21[/C][C]-0.051956[/C][C]-0.3991[/C][C]0.345637[/C][/ROW]
[ROW][C]22[/C][C]-0.052675[/C][C]-0.4046[/C][C]0.343615[/C][/ROW]
[ROW][C]23[/C][C]0.080383[/C][C]0.6174[/C][C]0.269662[/C][/ROW]
[ROW][C]24[/C][C]-0.040498[/C][C]-0.3111[/C][C]0.378423[/C][/ROW]
[ROW][C]25[/C][C]0.084248[/C][C]0.6471[/C][C]0.260031[/C][/ROW]
[ROW][C]26[/C][C]-0.136441[/C][C]-1.048[/C][C]0.149451[/C][/ROW]
[ROW][C]27[/C][C]0.01745[/C][C]0.134[/C][C]0.446915[/C][/ROW]
[ROW][C]28[/C][C]0.045559[/C][C]0.3499[/C][C]0.363814[/C][/ROW]
[ROW][C]29[/C][C]-0.01385[/C][C]-0.1064[/C][C]0.45782[/C][/ROW]
[ROW][C]30[/C][C]0.03607[/C][C]0.2771[/C][C]0.391352[/C][/ROW]
[ROW][C]31[/C][C]0.062315[/C][C]0.4787[/C][C]0.316977[/C][/ROW]
[ROW][C]32[/C][C]-0.078596[/C][C]-0.6037[/C][C]0.274176[/C][/ROW]
[ROW][C]33[/C][C]0.068813[/C][C]0.5286[/C][C]0.299545[/C][/ROW]
[ROW][C]34[/C][C]-0.01882[/C][C]-0.1446[/C][C]0.442775[/C][/ROW]
[ROW][C]35[/C][C]-0.076164[/C][C]-0.585[/C][C]0.280379[/C][/ROW]
[ROW][C]36[/C][C]0.060674[/C][C]0.466[/C][C]0.32145[/C][/ROW]
[/TABLE]
Source: https://freestatistics.org/blog/index.php?pk=63456&T=2

Globally Unique Identifier (entire table): ba.freestatistics.org/blog/index.php?pk=63456&T=2

As an alternative you can also use a QR Code:  

The GUIDs for individual cells are displayed in the table below:

Partial Autocorrelation Function
Time lag kPACF(k)T-STATP-value
10.2108991.61990.055289
20.0860840.66120.25552
30.0189720.14570.442316
4-0.233944-1.7970.038731
5-0.403707-3.10090.001478
6-0.3008-2.31050.012188
7-0.301229-2.31380.012091
8-0.186845-1.43520.078258
90.0054520.04190.483368
10-0.176225-1.35360.090512
11-0.173411-1.3320.093992
120.4255123.26840.000903
13-0.050269-0.38610.350397
14-0.003544-0.02720.489186
15-0.249232-1.91440.030212
160.0612430.47040.319895
170.0835950.64210.261646
180.0151730.11650.453808
190.0601370.46190.322918
20-0.023365-0.17950.429093
21-0.051956-0.39910.345637
22-0.052675-0.40460.343615
230.0803830.61740.269662
24-0.040498-0.31110.378423
250.0842480.64710.260031
26-0.136441-1.0480.149451
270.017450.1340.446915
280.0455590.34990.363814
29-0.01385-0.10640.45782
300.036070.27710.391352
310.0623150.47870.316977
32-0.078596-0.60370.274176
330.0688130.52860.299545
34-0.01882-0.14460.442775
35-0.076164-0.5850.280379
360.0606740.4660.32145


Parameters (Session):
par1 = 36 ; par2 = 1 ; par3 = 1 ; par4 = 0 ; par5 = 12 ; par6 = MA ; par7 = 0.95 ;
Parameters (R input):
par1 = 36 ; par2 = 1 ; par3 = 1 ; par4 = 0 ; par5 = 12 ; par6 = MA ; par7 = 0.95 ;
R code (references can be found in the software module):
if (par1 == 'Default') {
par1 = 10*log10(length(x))
} else {
par1 <- as.numeric(par1)
}
par2 <- as.numeric(par2)
par3 <- as.numeric(par3)
par4 <- as.numeric(par4)
par5 <- as.numeric(par5)
if (par6 == 'White Noise') par6 <- 'white' else par6 <- 'ma'
par7 <- as.numeric(par7)
if (par2 == 0) {
x <- log(x)
} else {
x <- (x ^ par2 - 1) / par2
}
if (par3 > 0) x <- diff(x,lag=1,difference=par3)
if (par4 > 0) x <- diff(x,lag=par5,difference=par4)
bitmap(file='pic1.png')
racf <- acf(x, par1, main='Autocorrelation', xlab='time lag', ylab='ACF', ci.type=par6, ci=par7, sub=paste('(lambda=',par2,', d=',par3,', D=',par4,', CI=', par7, ', CI type=',par6,')',sep=''))
dev.off()
bitmap(file='pic2.png')
rpacf <- pacf(x,par1,main='Partial Autocorrelation',xlab='lags',ylab='PACF')
dev.off()
(myacf <- c(racf$acf))
(mypacf <- c(rpacf$acf))
lengthx <- length(x)
sqrtn <- sqrt(lengthx)
load(file='createtable')
a<-table.start()
a<-table.row.start(a)
a<-table.element(a,'Autocorrelation Function',4,TRUE)
a<-table.row.end(a)
a<-table.row.start(a)
a<-table.element(a,'Time lag k',header=TRUE)
a<-table.element(a,hyperlink('basics.htm','ACF(k)','click here for more information about the Autocorrelation Function'),header=TRUE)
a<-table.element(a,'T-STAT',header=TRUE)
a<-table.element(a,'P-value',header=TRUE)
a<-table.row.end(a)
for (i in 2:(par1+1)) {
a<-table.row.start(a)
a<-table.element(a,i-1,header=TRUE)
a<-table.element(a,round(myacf[i],6))
mytstat <- myacf[i]*sqrtn
a<-table.element(a,round(mytstat,4))
a<-table.element(a,round(1-pt(abs(mytstat),lengthx),6))
a<-table.row.end(a)
}
a<-table.end(a)
table.save(a,file='mytable.tab')
a<-table.start()
a<-table.row.start(a)
a<-table.element(a,'Partial Autocorrelation Function',4,TRUE)
a<-table.row.end(a)
a<-table.row.start(a)
a<-table.element(a,'Time lag k',header=TRUE)
a<-table.element(a,hyperlink('basics.htm','PACF(k)','click here for more information about the Partial Autocorrelation Function'),header=TRUE)
a<-table.element(a,'T-STAT',header=TRUE)
a<-table.element(a,'P-value',header=TRUE)
a<-table.row.end(a)
for (i in 1:par1) {
a<-table.row.start(a)
a<-table.element(a,i,header=TRUE)
a<-table.element(a,round(mypacf[i],6))
mytstat <- mypacf[i]*sqrtn
a<-table.element(a,round(mytstat,4))
a<-table.element(a,round(1-pt(abs(mytstat),lengthx),6))
a<-table.row.end(a)
}
a<-table.end(a)
table.save(a,file='mytable1.tab')