Free Statistics

of Irreproducible Research!

Author's title

Author*The author of this computation has been verified*
R Software Modulerwasp_arimabackwardselection.wasp
Title produced by softwareARIMA Backward Selection
Date of computationFri, 04 Dec 2009 06:09:01 -0700
Cite this page as followsStatistical Computations at FreeStatistics.org, Office for Research Development and Education, URL https://freestatistics.org/blog/index.php?v=date/2009/Dec/04/t12599322130ihrgctkqrxgv32.htm/, Retrieved Sun, 28 Apr 2024 05:54:09 +0000
Statistical Computations at FreeStatistics.org, Office for Research Development and Education, URL https://freestatistics.org/blog/index.php?pk=63461, Retrieved Sun, 28 Apr 2024 05:54:09 +0000
QR Codes:

Original text written by user:
IsPrivate?No (this computation is public)
User-defined keywords
Estimated Impact105
Family? (F = Feedback message, R = changed R code, M = changed R Module, P = changed Parameters, D = changed Data)
-     [Univariate Data Series] [data set] [2008-12-01 19:54:57] [b98453cac15ba1066b407e146608df68]
- RMP   [ARIMA Backward Selection] [] [2009-11-27 14:53:14] [b98453cac15ba1066b407e146608df68]
- R PD      [ARIMA Backward Selection] [ws9] [2009-12-04 13:09:01] [b243db81ea3e1f02fb3382887fb0f701] [Current]
Feedback Forum

Post a new message
Dataseries X:
5594
5585
5710
5511
5403
5826
5884
5965
5960
6064
6046
5954
5952
5960
5983
5996
6021
6094
6202
6276
6306
6342
6345
6328
6191
6261
6253
6198
6247
6293
6381
6448
6470
6516
6532
6526
6533
6498
6507
6464
6453
6468
6497
6808
6793
6907
6792
6757
6734
6654
6589
6469
6521
6448
6410
6528
6445
6458
6215
6167


Summary of computational transaction
Raw Inputview raw input (R code)
Raw Outputview raw output of R engine
Computing time11 seconds
R Server'Gwilym Jenkins' @ 72.249.127.135

\begin{tabular}{lllllllll}
\hline
Summary of computational transaction \tabularnewline
Raw Input & view raw input (R code)  \tabularnewline
Raw Output & view raw output of R engine  \tabularnewline
Computing time & 11 seconds \tabularnewline
R Server & 'Gwilym Jenkins' @ 72.249.127.135 \tabularnewline
\hline
\end{tabular}
%Source: https://freestatistics.org/blog/index.php?pk=63461&T=0

[TABLE]
[ROW][C]Summary of computational transaction[/C][/ROW]
[ROW][C]Raw Input[/C][C]view raw input (R code) [/C][/ROW]
[ROW][C]Raw Output[/C][C]view raw output of R engine [/C][/ROW]
[ROW][C]Computing time[/C][C]11 seconds[/C][/ROW]
[ROW][C]R Server[/C][C]'Gwilym Jenkins' @ 72.249.127.135[/C][/ROW]
[/TABLE]
Source: https://freestatistics.org/blog/index.php?pk=63461&T=0

Globally Unique Identifier (entire table): ba.freestatistics.org/blog/index.php?pk=63461&T=0

As an alternative you can also use a QR Code:  

The GUIDs for individual cells are displayed in the table below:

Summary of computational transaction
Raw Inputview raw input (R code)
Raw Outputview raw output of R engine
Computing time11 seconds
R Server'Gwilym Jenkins' @ 72.249.127.135


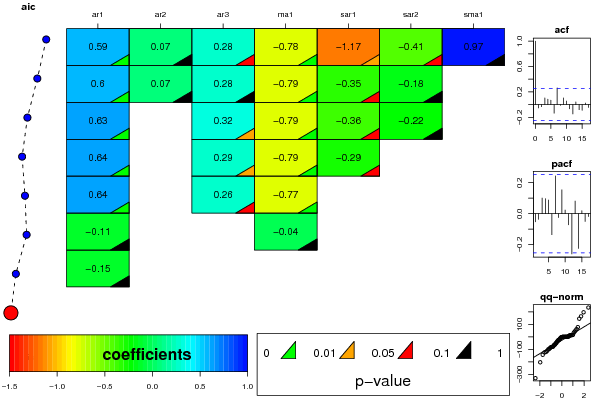
ARIMA Parameter Estimation and Backward Selection
Iterationar1ar2ar3ma1sar1sar2sma1
Estimates ( 1 )0.59330.06970.28-0.7844-1.1659-0.41080.9659
(p-val)(0.0015 )(0.7033 )(0.0937 )(0 )(0.0361 )(0.0626 )(0.7285 )
Estimates ( 2 )0.59520.07430.2791-0.7923-0.3482-0.17710
(p-val)(0.0014 )(0.6894 )(0.1041 )(0 )(0.0825 )(0.4572 )(NA )
Estimates ( 3 )0.628600.3196-0.7927-0.3597-0.21910
(p-val)(2e-04 )(NA )(0.0194 )(0 )(0.0688 )(0.2976 )(NA )
Estimates ( 4 )0.636200.2892-0.7863-0.293800
(p-val)(0.0014 )(NA )(0.0388 )(0 )(0.0996 )(NA )(NA )
Estimates ( 5 )0.637800.2572-0.7742000
(p-val)(0.0066 )(NA )(0.0654 )(2e-04 )(NA )(NA )(NA )
Estimates ( 6 )-0.109200-0.0414000
(p-val)(0.8523 )(NA )(NA )(0.943 )(NA )(NA )(NA )
Estimates ( 7 )-0.1495000000
(p-val)(0.299 )(NA )(NA )(NA )(NA )(NA )(NA )
Estimates ( 8 )0000000
(p-val)(NA )(NA )(NA )(NA )(NA )(NA )(NA )
Estimates ( 9 )NANANANANANANA
(p-val)(NA )(NA )(NA )(NA )(NA )(NA )(NA )
Estimates ( 10 )NANANANANANANA
(p-val)(NA )(NA )(NA )(NA )(NA )(NA )(NA )
Estimates ( 11 )NANANANANANANA
(p-val)(NA )(NA )(NA )(NA )(NA )(NA )(NA )
Estimates ( 12 )NANANANANANANA
(p-val)(NA )(NA )(NA )(NA )(NA )(NA )(NA )
Estimates ( 13 )NANANANANANANA
(p-val)(NA )(NA )(NA )(NA )(NA )(NA )(NA )

\begin{tabular}{lllllllll}
\hline
ARIMA Parameter Estimation and Backward Selection \tabularnewline
Iteration & ar1 & ar2 & ar3 & ma1 & sar1 & sar2 & sma1 \tabularnewline
Estimates ( 1 ) & 0.5933 & 0.0697 & 0.28 & -0.7844 & -1.1659 & -0.4108 & 0.9659 \tabularnewline
(p-val) & (0.0015 ) & (0.7033 ) & (0.0937 ) & (0 ) & (0.0361 ) & (0.0626 ) & (0.7285 ) \tabularnewline
Estimates ( 2 ) & 0.5952 & 0.0743 & 0.2791 & -0.7923 & -0.3482 & -0.1771 & 0 \tabularnewline
(p-val) & (0.0014 ) & (0.6894 ) & (0.1041 ) & (0 ) & (0.0825 ) & (0.4572 ) & (NA ) \tabularnewline
Estimates ( 3 ) & 0.6286 & 0 & 0.3196 & -0.7927 & -0.3597 & -0.2191 & 0 \tabularnewline
(p-val) & (2e-04 ) & (NA ) & (0.0194 ) & (0 ) & (0.0688 ) & (0.2976 ) & (NA ) \tabularnewline
Estimates ( 4 ) & 0.6362 & 0 & 0.2892 & -0.7863 & -0.2938 & 0 & 0 \tabularnewline
(p-val) & (0.0014 ) & (NA ) & (0.0388 ) & (0 ) & (0.0996 ) & (NA ) & (NA ) \tabularnewline
Estimates ( 5 ) & 0.6378 & 0 & 0.2572 & -0.7742 & 0 & 0 & 0 \tabularnewline
(p-val) & (0.0066 ) & (NA ) & (0.0654 ) & (2e-04 ) & (NA ) & (NA ) & (NA ) \tabularnewline
Estimates ( 6 ) & -0.1092 & 0 & 0 & -0.0414 & 0 & 0 & 0 \tabularnewline
(p-val) & (0.8523 ) & (NA ) & (NA ) & (0.943 ) & (NA ) & (NA ) & (NA ) \tabularnewline
Estimates ( 7 ) & -0.1495 & 0 & 0 & 0 & 0 & 0 & 0 \tabularnewline
(p-val) & (0.299 ) & (NA ) & (NA ) & (NA ) & (NA ) & (NA ) & (NA ) \tabularnewline
Estimates ( 8 ) & 0 & 0 & 0 & 0 & 0 & 0 & 0 \tabularnewline
(p-val) & (NA ) & (NA ) & (NA ) & (NA ) & (NA ) & (NA ) & (NA ) \tabularnewline
Estimates ( 9 ) & NA & NA & NA & NA & NA & NA & NA \tabularnewline
(p-val) & (NA ) & (NA ) & (NA ) & (NA ) & (NA ) & (NA ) & (NA ) \tabularnewline
Estimates ( 10 ) & NA & NA & NA & NA & NA & NA & NA \tabularnewline
(p-val) & (NA ) & (NA ) & (NA ) & (NA ) & (NA ) & (NA ) & (NA ) \tabularnewline
Estimates ( 11 ) & NA & NA & NA & NA & NA & NA & NA \tabularnewline
(p-val) & (NA ) & (NA ) & (NA ) & (NA ) & (NA ) & (NA ) & (NA ) \tabularnewline
Estimates ( 12 ) & NA & NA & NA & NA & NA & NA & NA \tabularnewline
(p-val) & (NA ) & (NA ) & (NA ) & (NA ) & (NA ) & (NA ) & (NA ) \tabularnewline
Estimates ( 13 ) & NA & NA & NA & NA & NA & NA & NA \tabularnewline
(p-val) & (NA ) & (NA ) & (NA ) & (NA ) & (NA ) & (NA ) & (NA ) \tabularnewline
\hline
\end{tabular}
%Source: https://freestatistics.org/blog/index.php?pk=63461&T=1

[TABLE]
[ROW][C]ARIMA Parameter Estimation and Backward Selection[/C][/ROW]
[ROW][C]Iteration[/C][C]ar1[/C][C]ar2[/C][C]ar3[/C][C]ma1[/C][C]sar1[/C][C]sar2[/C][C]sma1[/C][/ROW]
[ROW][C]Estimates ( 1 )[/C][C]0.5933[/C][C]0.0697[/C][C]0.28[/C][C]-0.7844[/C][C]-1.1659[/C][C]-0.4108[/C][C]0.9659[/C][/ROW]
[ROW][C](p-val)[/C][C](0.0015 )[/C][C](0.7033 )[/C][C](0.0937 )[/C][C](0 )[/C][C](0.0361 )[/C][C](0.0626 )[/C][C](0.7285 )[/C][/ROW]
[ROW][C]Estimates ( 2 )[/C][C]0.5952[/C][C]0.0743[/C][C]0.2791[/C][C]-0.7923[/C][C]-0.3482[/C][C]-0.1771[/C][C]0[/C][/ROW]
[ROW][C](p-val)[/C][C](0.0014 )[/C][C](0.6894 )[/C][C](0.1041 )[/C][C](0 )[/C][C](0.0825 )[/C][C](0.4572 )[/C][C](NA )[/C][/ROW]
[ROW][C]Estimates ( 3 )[/C][C]0.6286[/C][C]0[/C][C]0.3196[/C][C]-0.7927[/C][C]-0.3597[/C][C]-0.2191[/C][C]0[/C][/ROW]
[ROW][C](p-val)[/C][C](2e-04 )[/C][C](NA )[/C][C](0.0194 )[/C][C](0 )[/C][C](0.0688 )[/C][C](0.2976 )[/C][C](NA )[/C][/ROW]
[ROW][C]Estimates ( 4 )[/C][C]0.6362[/C][C]0[/C][C]0.2892[/C][C]-0.7863[/C][C]-0.2938[/C][C]0[/C][C]0[/C][/ROW]
[ROW][C](p-val)[/C][C](0.0014 )[/C][C](NA )[/C][C](0.0388 )[/C][C](0 )[/C][C](0.0996 )[/C][C](NA )[/C][C](NA )[/C][/ROW]
[ROW][C]Estimates ( 5 )[/C][C]0.6378[/C][C]0[/C][C]0.2572[/C][C]-0.7742[/C][C]0[/C][C]0[/C][C]0[/C][/ROW]
[ROW][C](p-val)[/C][C](0.0066 )[/C][C](NA )[/C][C](0.0654 )[/C][C](2e-04 )[/C][C](NA )[/C][C](NA )[/C][C](NA )[/C][/ROW]
[ROW][C]Estimates ( 6 )[/C][C]-0.1092[/C][C]0[/C][C]0[/C][C]-0.0414[/C][C]0[/C][C]0[/C][C]0[/C][/ROW]
[ROW][C](p-val)[/C][C](0.8523 )[/C][C](NA )[/C][C](NA )[/C][C](0.943 )[/C][C](NA )[/C][C](NA )[/C][C](NA )[/C][/ROW]
[ROW][C]Estimates ( 7 )[/C][C]-0.1495[/C][C]0[/C][C]0[/C][C]0[/C][C]0[/C][C]0[/C][C]0[/C][/ROW]
[ROW][C](p-val)[/C][C](0.299 )[/C][C](NA )[/C][C](NA )[/C][C](NA )[/C][C](NA )[/C][C](NA )[/C][C](NA )[/C][/ROW]
[ROW][C]Estimates ( 8 )[/C][C]0[/C][C]0[/C][C]0[/C][C]0[/C][C]0[/C][C]0[/C][C]0[/C][/ROW]
[ROW][C](p-val)[/C][C](NA )[/C][C](NA )[/C][C](NA )[/C][C](NA )[/C][C](NA )[/C][C](NA )[/C][C](NA )[/C][/ROW]
[ROW][C]Estimates ( 9 )[/C][C]NA[/C][C]NA[/C][C]NA[/C][C]NA[/C][C]NA[/C][C]NA[/C][C]NA[/C][/ROW]
[ROW][C](p-val)[/C][C](NA )[/C][C](NA )[/C][C](NA )[/C][C](NA )[/C][C](NA )[/C][C](NA )[/C][C](NA )[/C][/ROW]
[ROW][C]Estimates ( 10 )[/C][C]NA[/C][C]NA[/C][C]NA[/C][C]NA[/C][C]NA[/C][C]NA[/C][C]NA[/C][/ROW]
[ROW][C](p-val)[/C][C](NA )[/C][C](NA )[/C][C](NA )[/C][C](NA )[/C][C](NA )[/C][C](NA )[/C][C](NA )[/C][/ROW]
[ROW][C]Estimates ( 11 )[/C][C]NA[/C][C]NA[/C][C]NA[/C][C]NA[/C][C]NA[/C][C]NA[/C][C]NA[/C][/ROW]
[ROW][C](p-val)[/C][C](NA )[/C][C](NA )[/C][C](NA )[/C][C](NA )[/C][C](NA )[/C][C](NA )[/C][C](NA )[/C][/ROW]
[ROW][C]Estimates ( 12 )[/C][C]NA[/C][C]NA[/C][C]NA[/C][C]NA[/C][C]NA[/C][C]NA[/C][C]NA[/C][/ROW]
[ROW][C](p-val)[/C][C](NA )[/C][C](NA )[/C][C](NA )[/C][C](NA )[/C][C](NA )[/C][C](NA )[/C][C](NA )[/C][/ROW]
[ROW][C]Estimates ( 13 )[/C][C]NA[/C][C]NA[/C][C]NA[/C][C]NA[/C][C]NA[/C][C]NA[/C][C]NA[/C][/ROW]
[ROW][C](p-val)[/C][C](NA )[/C][C](NA )[/C][C](NA )[/C][C](NA )[/C][C](NA )[/C][C](NA )[/C][C](NA )[/C][/ROW]
[/TABLE]
Source: https://freestatistics.org/blog/index.php?pk=63461&T=1

Globally Unique Identifier (entire table): ba.freestatistics.org/blog/index.php?pk=63461&T=1

As an alternative you can also use a QR Code:  

The GUIDs for individual cells are displayed in the table below:

ARIMA Parameter Estimation and Backward Selection
Iterationar1ar2ar3ma1sar1sar2sma1
Estimates ( 1 )0.59330.06970.28-0.7844-1.1659-0.41080.9659
(p-val)(0.0015 )(0.7033 )(0.0937 )(0 )(0.0361 )(0.0626 )(0.7285 )
Estimates ( 2 )0.59520.07430.2791-0.7923-0.3482-0.17710
(p-val)(0.0014 )(0.6894 )(0.1041 )(0 )(0.0825 )(0.4572 )(NA )
Estimates ( 3 )0.628600.3196-0.7927-0.3597-0.21910
(p-val)(2e-04 )(NA )(0.0194 )(0 )(0.0688 )(0.2976 )(NA )
Estimates ( 4 )0.636200.2892-0.7863-0.293800
(p-val)(0.0014 )(NA )(0.0388 )(0 )(0.0996 )(NA )(NA )
Estimates ( 5 )0.637800.2572-0.7742000
(p-val)(0.0066 )(NA )(0.0654 )(2e-04 )(NA )(NA )(NA )
Estimates ( 6 )-0.109200-0.0414000
(p-val)(0.8523 )(NA )(NA )(0.943 )(NA )(NA )(NA )
Estimates ( 7 )-0.1495000000
(p-val)(0.299 )(NA )(NA )(NA )(NA )(NA )(NA )
Estimates ( 8 )0000000
(p-val)(NA )(NA )(NA )(NA )(NA )(NA )(NA )
Estimates ( 9 )NANANANANANANA
(p-val)(NA )(NA )(NA )(NA )(NA )(NA )(NA )
Estimates ( 10 )NANANANANANANA
(p-val)(NA )(NA )(NA )(NA )(NA )(NA )(NA )
Estimates ( 11 )NANANANANANANA
(p-val)(NA )(NA )(NA )(NA )(NA )(NA )(NA )
Estimates ( 12 )NANANANANANANA
(p-val)(NA )(NA )(NA )(NA )(NA )(NA )(NA )
Estimates ( 13 )NANANANANANANA
(p-val)(NA )(NA )(NA )(NA )(NA )(NA )(NA )


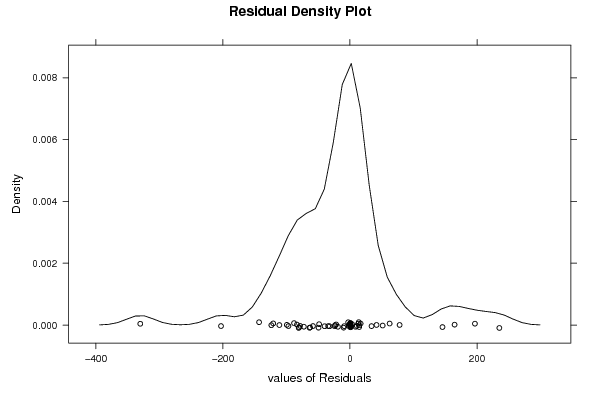
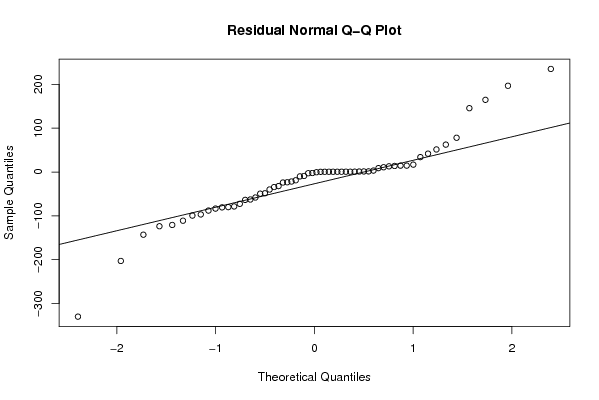
Estimated ARIMA Residuals
Value
-18.9199982900071
16.7987931300386
-99.4584620893339
196.750772491148
164.694472875306
-330.116203295995
-2.32578072185578
0.475111524462407
33.9534843854976
-62.7674219294779
10.8338483235171
78.1395468421279
-123.787332702873
41.8171988721256
-21.7308617040085
-72.6345691480146
13.8338483204816
-23.4119464660525
-24.0365602256879
-9.99004461162167
-9.04651561407081
8.80398215534933
14.4950223058122
12.9435289975572
145.644524536395
-83.4716787963162
1.30226578897964
14.5415379198785
-58.2059732330272
-39.9701338348677
-63.6345691480156
235.179368395709
-0.521455738202349
62.4684174684999
-120.833848320481
-48.5847922061303
-34.3355646868549
-49.4850669174366
-80.7276003761508
-88.0631650630048
51.4883282452529
-78.5813594733873
-80.1561962911419
-203.016649448937
-96.8539305021577
-111.166151679517
-143.099725288698
-32.1362855143880

\begin{tabular}{lllllllll}
\hline
Estimated ARIMA Residuals \tabularnewline
Value \tabularnewline
-18.9199982900071 \tabularnewline
16.7987931300386 \tabularnewline
-99.4584620893339 \tabularnewline
196.750772491148 \tabularnewline
164.694472875306 \tabularnewline
-330.116203295995 \tabularnewline
-2.32578072185578 \tabularnewline
0.475111524462407 \tabularnewline
33.9534843854976 \tabularnewline
-62.7674219294779 \tabularnewline
10.8338483235171 \tabularnewline
78.1395468421279 \tabularnewline
-123.787332702873 \tabularnewline
41.8171988721256 \tabularnewline
-21.7308617040085 \tabularnewline
-72.6345691480146 \tabularnewline
13.8338483204816 \tabularnewline
-23.4119464660525 \tabularnewline
-24.0365602256879 \tabularnewline
-9.99004461162167 \tabularnewline
-9.04651561407081 \tabularnewline
8.80398215534933 \tabularnewline
14.4950223058122 \tabularnewline
12.9435289975572 \tabularnewline
145.644524536395 \tabularnewline
-83.4716787963162 \tabularnewline
1.30226578897964 \tabularnewline
14.5415379198785 \tabularnewline
-58.2059732330272 \tabularnewline
-39.9701338348677 \tabularnewline
-63.6345691480156 \tabularnewline
235.179368395709 \tabularnewline
-0.521455738202349 \tabularnewline
62.4684174684999 \tabularnewline
-120.833848320481 \tabularnewline
-48.5847922061303 \tabularnewline
-34.3355646868549 \tabularnewline
-49.4850669174366 \tabularnewline
-80.7276003761508 \tabularnewline
-88.0631650630048 \tabularnewline
51.4883282452529 \tabularnewline
-78.5813594733873 \tabularnewline
-80.1561962911419 \tabularnewline
-203.016649448937 \tabularnewline
-96.8539305021577 \tabularnewline
-111.166151679517 \tabularnewline
-143.099725288698 \tabularnewline
-32.1362855143880 \tabularnewline
\hline
\end{tabular}
%Source: https://freestatistics.org/blog/index.php?pk=63461&T=2

[TABLE]
[ROW][C]Estimated ARIMA Residuals[/C][/ROW]
[ROW][C]Value[/C][/ROW]
[ROW][C]-18.9199982900071[/C][/ROW]
[ROW][C]16.7987931300386[/C][/ROW]
[ROW][C]-99.4584620893339[/C][/ROW]
[ROW][C]196.750772491148[/C][/ROW]
[ROW][C]164.694472875306[/C][/ROW]
[ROW][C]-330.116203295995[/C][/ROW]
[ROW][C]-2.32578072185578[/C][/ROW]
[ROW][C]0.475111524462407[/C][/ROW]
[ROW][C]33.9534843854976[/C][/ROW]
[ROW][C]-62.7674219294779[/C][/ROW]
[ROW][C]10.8338483235171[/C][/ROW]
[ROW][C]78.1395468421279[/C][/ROW]
[ROW][C]-123.787332702873[/C][/ROW]
[ROW][C]41.8171988721256[/C][/ROW]
[ROW][C]-21.7308617040085[/C][/ROW]
[ROW][C]-72.6345691480146[/C][/ROW]
[ROW][C]13.8338483204816[/C][/ROW]
[ROW][C]-23.4119464660525[/C][/ROW]
[ROW][C]-24.0365602256879[/C][/ROW]
[ROW][C]-9.99004461162167[/C][/ROW]
[ROW][C]-9.04651561407081[/C][/ROW]
[ROW][C]8.80398215534933[/C][/ROW]
[ROW][C]14.4950223058122[/C][/ROW]
[ROW][C]12.9435289975572[/C][/ROW]
[ROW][C]145.644524536395[/C][/ROW]
[ROW][C]-83.4716787963162[/C][/ROW]
[ROW][C]1.30226578897964[/C][/ROW]
[ROW][C]14.5415379198785[/C][/ROW]
[ROW][C]-58.2059732330272[/C][/ROW]
[ROW][C]-39.9701338348677[/C][/ROW]
[ROW][C]-63.6345691480156[/C][/ROW]
[ROW][C]235.179368395709[/C][/ROW]
[ROW][C]-0.521455738202349[/C][/ROW]
[ROW][C]62.4684174684999[/C][/ROW]
[ROW][C]-120.833848320481[/C][/ROW]
[ROW][C]-48.5847922061303[/C][/ROW]
[ROW][C]-34.3355646868549[/C][/ROW]
[ROW][C]-49.4850669174366[/C][/ROW]
[ROW][C]-80.7276003761508[/C][/ROW]
[ROW][C]-88.0631650630048[/C][/ROW]
[ROW][C]51.4883282452529[/C][/ROW]
[ROW][C]-78.5813594733873[/C][/ROW]
[ROW][C]-80.1561962911419[/C][/ROW]
[ROW][C]-203.016649448937[/C][/ROW]
[ROW][C]-96.8539305021577[/C][/ROW]
[ROW][C]-111.166151679517[/C][/ROW]
[ROW][C]-143.099725288698[/C][/ROW]
[ROW][C]-32.1362855143880[/C][/ROW]
[/TABLE]
Source: https://freestatistics.org/blog/index.php?pk=63461&T=2

Globally Unique Identifier (entire table): ba.freestatistics.org/blog/index.php?pk=63461&T=2

As an alternative you can also use a QR Code:  

The GUIDs for individual cells are displayed in the table below:

Estimated ARIMA Residuals
Value
-18.9199982900071
16.7987931300386
-99.4584620893339
196.750772491148
164.694472875306
-330.116203295995
-2.32578072185578
0.475111524462407
33.9534843854976
-62.7674219294779
10.8338483235171
78.1395468421279
-123.787332702873
41.8171988721256
-21.7308617040085
-72.6345691480146
13.8338483204816
-23.4119464660525
-24.0365602256879
-9.99004461162167
-9.04651561407081
8.80398215534933
14.4950223058122
12.9435289975572
145.644524536395
-83.4716787963162
1.30226578897964
14.5415379198785
-58.2059732330272
-39.9701338348677
-63.6345691480156
235.179368395709
-0.521455738202349
62.4684174684999
-120.833848320481
-48.5847922061303
-34.3355646868549
-49.4850669174366
-80.7276003761508
-88.0631650630048
51.4883282452529
-78.5813594733873
-80.1561962911419
-203.016649448937
-96.8539305021577
-111.166151679517
-143.099725288698
-32.1362855143880


Parameters (Session):
par1 = FALSE ; par2 = 1 ; par3 = 1 ; par4 = 1 ; par5 = 12 ; par6 = 3 ; par7 = 1 ; par8 = 2 ; par9 = 1 ;
Parameters (R input):
par1 = FALSE ; par2 = 1 ; par3 = 1 ; par4 = 1 ; par5 = 12 ; par6 = 3 ; par7 = 1 ; par8 = 2 ; par9 = 1 ;
R code (references can be found in the software module):
library(lattice)
if (par1 == 'TRUE') par1 <- TRUE
if (par1 == 'FALSE') par1 <- FALSE
par2 <- as.numeric(par2) #Box-Cox lambda transformation parameter
par3 <- as.numeric(par3) #degree of non-seasonal differencing
par4 <- as.numeric(par4) #degree of seasonal differencing
par5 <- as.numeric(par5) #seasonal period
par6 <- as.numeric(par6) #degree (p) of the non-seasonal AR(p) polynomial
par7 <- as.numeric(par7) #degree (q) of the non-seasonal MA(q) polynomial
par8 <- as.numeric(par8) #degree (P) of the seasonal AR(P) polynomial
par9 <- as.numeric(par9) #degree (Q) of the seasonal MA(Q) polynomial
armaGR <- function(arima.out, names, n){
try1 <- arima.out$coef
try2 <- sqrt(diag(arima.out$var.coef))
try.data.frame <- data.frame(matrix(NA,ncol=4,nrow=length(names)))
dimnames(try.data.frame) <- list(names,c('coef','std','tstat','pv'))
try.data.frame[,1] <- try1
for(i in 1:length(try2)) try.data.frame[which(rownames(try.data.frame)==names(try2)[i]),2] <- try2[i]
try.data.frame[,3] <- try.data.frame[,1] / try.data.frame[,2]
try.data.frame[,4] <- round((1-pt(abs(try.data.frame[,3]),df=n-(length(try2)+1)))*2,5)
vector <- rep(NA,length(names))
vector[is.na(try.data.frame[,4])] <- 0
maxi <- which.max(try.data.frame[,4])
continue <- max(try.data.frame[,4],na.rm=TRUE) > .05
vector[maxi] <- 0
list(summary=try.data.frame,next.vector=vector,continue=continue)
}
arimaSelect <- function(series, order=c(13,0,0), seasonal=list(order=c(2,0,0),period=12), include.mean=F){
nrc <- order[1]+order[3]+seasonal$order[1]+seasonal$order[3]
coeff <- matrix(NA, nrow=nrc*2, ncol=nrc)
pval <- matrix(NA, nrow=nrc*2, ncol=nrc)
mylist <- rep(list(NULL), nrc)
names <- NULL
if(order[1] > 0) names <- paste('ar',1:order[1],sep='')
if(order[3] > 0) names <- c( names , paste('ma',1:order[3],sep='') )
if(seasonal$order[1] > 0) names <- c(names, paste('sar',1:seasonal$order[1],sep=''))
if(seasonal$order[3] > 0) names <- c(names, paste('sma',1:seasonal$order[3],sep=''))
arima.out <- arima(series, order=order, seasonal=seasonal, include.mean=include.mean, method='ML')
mylist[[1]] <- arima.out
last.arma <- armaGR(arima.out, names, length(series))
mystop <- FALSE
i <- 1
coeff[i,] <- last.arma[[1]][,1]
pval [i,] <- last.arma[[1]][,4]
i <- 2
aic <- arima.out$aic
while(!mystop){
mylist[[i]] <- arima.out
arima.out <- arima(series, order=order, seasonal=seasonal, include.mean=include.mean, method='ML', fixed=last.arma$next.vector)
aic <- c(aic, arima.out$aic)
last.arma <- armaGR(arima.out, names, length(series))
mystop <- !last.arma$continue
coeff[i,] <- last.arma[[1]][,1]
pval [i,] <- last.arma[[1]][,4]
i <- i+1
}
list(coeff, pval, mylist, aic=aic)
}
arimaSelectplot <- function(arimaSelect.out,noms,choix){
noms <- names(arimaSelect.out[[3]][[1]]$coef)
coeff <- arimaSelect.out[[1]]
k <- min(which(is.na(coeff[,1])))-1
coeff <- coeff[1:k,]
pval <- arimaSelect.out[[2]][1:k,]
aic <- arimaSelect.out$aic[1:k]
coeff[coeff==0] <- NA
n <- ncol(coeff)
if(missing(choix)) choix <- k
layout(matrix(c(1,1,1,2,
3,3,3,2,
3,3,3,4,
5,6,7,7),nr=4),
widths=c(10,35,45,15),
heights=c(30,30,15,15))
couleurs <- rainbow(75)[1:50]#(50)
ticks <- pretty(coeff)
par(mar=c(1,1,3,1))
plot(aic,k:1-.5,type='o',pch=21,bg='blue',cex=2,axes=F,lty=2,xpd=NA)
points(aic[choix],k-choix+.5,pch=21,cex=4,bg=2,xpd=NA)
title('aic',line=2)
par(mar=c(3,0,0,0))
plot(0,axes=F,xlab='',ylab='',xlim=range(ticks),ylim=c(.1,1))
rect(xleft = min(ticks) + (0:49)/50*(max(ticks)-min(ticks)),
xright = min(ticks) + (1:50)/50*(max(ticks)-min(ticks)),
ytop = rep(1,50),
ybottom= rep(0,50),col=couleurs,border=NA)
axis(1,ticks)
rect(xleft=min(ticks),xright=max(ticks),ytop=1,ybottom=0)
text(mean(coeff,na.rm=T),.5,'coefficients',cex=2,font=2)
par(mar=c(1,1,3,1))
image(1:n,1:k,t(coeff[k:1,]),axes=F,col=couleurs,zlim=range(ticks))
for(i in 1:n) for(j in 1:k) if(!is.na(coeff[j,i])) {
if(pval[j,i]<.01) symb = 'green'
else if( (pval[j,i]<.05) & (pval[j,i]>=.01)) symb = 'orange'
else if( (pval[j,i]<.1) & (pval[j,i]>=.05)) symb = 'red'
else symb = 'black'
polygon(c(i+.5 ,i+.2 ,i+.5 ,i+.5),
c(k-j+0.5,k-j+0.5,k-j+0.8,k-j+0.5),
col=symb)
if(j==choix) {
rect(xleft=i-.5,
xright=i+.5,
ybottom=k-j+1.5,
ytop=k-j+.5,
lwd=4)
text(i,
k-j+1,
round(coeff[j,i],2),
cex=1.2,
font=2)
}
else{
rect(xleft=i-.5,xright=i+.5,ybottom=k-j+1.5,ytop=k-j+.5)
text(i,k-j+1,round(coeff[j,i],2),cex=1.2,font=1)
}
}
axis(3,1:n,noms)
par(mar=c(0.5,0,0,0.5))
plot(0,axes=F,xlab='',ylab='',type='n',xlim=c(0,8),ylim=c(-.2,.8))
cols <- c('green','orange','red','black')
niv <- c('0','0.01','0.05','0.1')
for(i in 0:3){
polygon(c(1+2*i ,1+2*i ,1+2*i-.5 ,1+2*i),
c(.4 ,.7 , .4 , .4),
col=cols[i+1])
text(2*i,0.5,niv[i+1],cex=1.5)
}
text(8,.5,1,cex=1.5)
text(4,0,'p-value',cex=2)
box()
residus <- arimaSelect.out[[3]][[choix]]$res
par(mar=c(1,2,4,1))
acf(residus,main='')
title('acf',line=.5)
par(mar=c(1,2,4,1))
pacf(residus,main='')
title('pacf',line=.5)
par(mar=c(2,2,4,1))
qqnorm(residus,main='')
title('qq-norm',line=.5)
qqline(residus)
residus
}
if (par2 == 0) x <- log(x)
if (par2 != 0) x <- x^par2
(selection <- arimaSelect(x, order=c(par6,par3,par7), seasonal=list(order=c(par8,par4,par9), period=par5)))
bitmap(file='test1.png')
resid <- arimaSelectplot(selection)
dev.off()
resid
bitmap(file='test2.png')
acf(resid,length(resid)/2, main='Residual Autocorrelation Function')
dev.off()
bitmap(file='test3.png')
pacf(resid,length(resid)/2, main='Residual Partial Autocorrelation Function')
dev.off()
bitmap(file='test4.png')
cpgram(resid, main='Residual Cumulative Periodogram')
dev.off()
bitmap(file='test5.png')
hist(resid, main='Residual Histogram', xlab='values of Residuals')
dev.off()
bitmap(file='test6.png')
densityplot(~resid,col='black',main='Residual Density Plot', xlab='values of Residuals')
dev.off()
bitmap(file='test7.png')
qqnorm(resid, main='Residual Normal Q-Q Plot')
qqline(resid)
dev.off()
ncols <- length(selection[[1]][1,])
nrows <- length(selection[[2]][,1])-1
load(file='createtable')
a<-table.start()
a<-table.row.start(a)
a<-table.element(a,'ARIMA Parameter Estimation and Backward Selection', ncols+1,TRUE)
a<-table.row.end(a)
a<-table.row.start(a)
a<-table.element(a,'Iteration', header=TRUE)
for (i in 1:ncols) {
a<-table.element(a,names(selection[[3]][[1]]$coef)[i],header=TRUE)
}
a<-table.row.end(a)
for (j in 1:nrows) {
a<-table.row.start(a)
mydum <- 'Estimates ('
mydum <- paste(mydum,j)
mydum <- paste(mydum,')')
a<-table.element(a,mydum, header=TRUE)
for (i in 1:ncols) {
a<-table.element(a,round(selection[[1]][j,i],4))
}
a<-table.row.end(a)
a<-table.row.start(a)
a<-table.element(a,'(p-val)', header=TRUE)
for (i in 1:ncols) {
mydum <- '('
mydum <- paste(mydum,round(selection[[2]][j,i],4),sep='')
mydum <- paste(mydum,')')
a<-table.element(a,mydum)
}
a<-table.row.end(a)
}
a<-table.end(a)
table.save(a,file='mytable.tab')
a<-table.start()
a<-table.row.start(a)
a<-table.element(a,'Estimated ARIMA Residuals', 1,TRUE)
a<-table.row.end(a)
a<-table.row.start(a)
a<-table.element(a,'Value', 1,TRUE)
a<-table.row.end(a)
for (i in (par4*par5+par3):length(resid)) {
a<-table.row.start(a)
a<-table.element(a,resid[i])
a<-table.row.end(a)
}
a<-table.end(a)
table.save(a,file='mytable1.tab')