Free Statistics

of Irreproducible Research!

Author's title

Author*The author of this computation has been verified*
R Software Modulerwasp_exponentialsmoothing.wasp
Title produced by softwareExponential Smoothing
Date of computationFri, 04 Dec 2009 06:28:30 -0700
Cite this page as followsStatistical Computations at FreeStatistics.org, Office for Research Development and Education, URL https://freestatistics.org/blog/index.php?v=date/2009/Dec/04/t1259933368bswh2541go9y3og.htm/, Retrieved Sat, 27 Apr 2024 14:44:22 +0000
Statistical Computations at FreeStatistics.org, Office for Research Development and Education, URL https://freestatistics.org/blog/index.php?pk=63484, Retrieved Sat, 27 Apr 2024 14:44:22 +0000
QR Codes:

Original text written by user:
IsPrivate?No (this computation is public)
User-defined keywords
Estimated Impact95
Family? (F = Feedback message, R = changed R code, M = changed R Module, P = changed Parameters, D = changed Data)
-     [Univariate Data Series] [data set] [2008-12-01 19:54:57] [b98453cac15ba1066b407e146608df68]
- RMP   [Exponential Smoothing] [] [2009-11-27 15:04:36] [b98453cac15ba1066b407e146608df68]
- R  D      [Exponential Smoothing] [ws9] [2009-12-04 13:28:30] [b243db81ea3e1f02fb3382887fb0f701] [Current]
Feedback Forum

Post a new message
Dataseries X:
5594
5585
5710
5511
5403
5826
5884
5965
5960
6064
6046
5954
5952
5960
5983
5996
6021
6094
6202
6276
6306
6342
6345
6328
6191
6261
6253
6198
6247
6293
6381
6448
6470
6516
6532
6526
6533
6498
6507
6464
6453
6468
6497
6808
6793
6907
6792
6757
6734
6654
6589
6469
6521
6448
6410
6528
6445
6458
6215
6167


Summary of computational transaction
Raw Inputview raw input (R code)
Raw Outputview raw output of R engine
Computing time2 seconds
R Server'Gwilym Jenkins' @ 72.249.127.135

\begin{tabular}{lllllllll}
\hline
Summary of computational transaction \tabularnewline
Raw Input & view raw input (R code)  \tabularnewline
Raw Output & view raw output of R engine  \tabularnewline
Computing time & 2 seconds \tabularnewline
R Server & 'Gwilym Jenkins' @ 72.249.127.135 \tabularnewline
\hline
\end{tabular}
%Source: https://freestatistics.org/blog/index.php?pk=63484&T=0

[TABLE]
[ROW][C]Summary of computational transaction[/C][/ROW]
[ROW][C]Raw Input[/C][C]view raw input (R code) [/C][/ROW]
[ROW][C]Raw Output[/C][C]view raw output of R engine [/C][/ROW]
[ROW][C]Computing time[/C][C]2 seconds[/C][/ROW]
[ROW][C]R Server[/C][C]'Gwilym Jenkins' @ 72.249.127.135[/C][/ROW]
[/TABLE]
Source: https://freestatistics.org/blog/index.php?pk=63484&T=0

Globally Unique Identifier (entire table): ba.freestatistics.org/blog/index.php?pk=63484&T=0

As an alternative you can also use a QR Code:  

The GUIDs for individual cells are displayed in the table below:

Summary of computational transaction
Raw Inputview raw input (R code)
Raw Outputview raw output of R engine
Computing time2 seconds
R Server'Gwilym Jenkins' @ 72.249.127.135


Estimated Parameters of Exponential Smoothing
ParameterValue
alpha0.59512425238397
beta0.241357167807255
gamma0.812552195322275

\begin{tabular}{lllllllll}
\hline
Estimated Parameters of Exponential Smoothing \tabularnewline
Parameter & Value \tabularnewline
alpha & 0.59512425238397 \tabularnewline
beta & 0.241357167807255 \tabularnewline
gamma & 0.812552195322275 \tabularnewline
\hline
\end{tabular}
%Source: https://freestatistics.org/blog/index.php?pk=63484&T=1

[TABLE]
[ROW][C]Estimated Parameters of Exponential Smoothing[/C][/ROW]
[ROW][C]Parameter[/C][C]Value[/C][/ROW]
[ROW][C]alpha[/C][C]0.59512425238397[/C][/ROW]
[ROW][C]beta[/C][C]0.241357167807255[/C][/ROW]
[ROW][C]gamma[/C][C]0.812552195322275[/C][/ROW]
[/TABLE]
Source: https://freestatistics.org/blog/index.php?pk=63484&T=1

Globally Unique Identifier (entire table): ba.freestatistics.org/blog/index.php?pk=63484&T=1

As an alternative you can also use a QR Code:  

The GUIDs for individual cells are displayed in the table below:

Estimated Parameters of Exponential Smoothing
ParameterValue
alpha0.59512425238397
beta0.241357167807255
gamma0.812552195322275


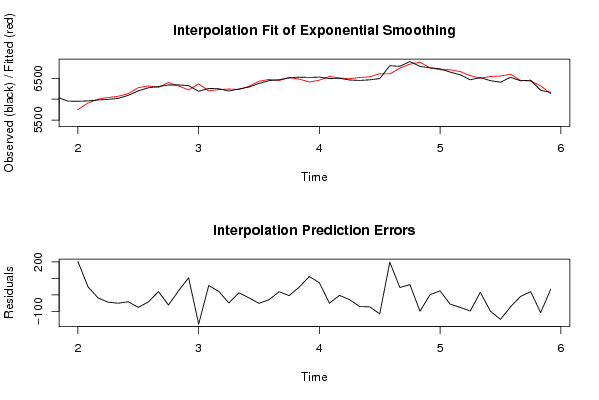
Interpolation Forecasts of Exponential Smoothing
tObservedFittedResiduals
1359525749.65534450099202.344655499006
1459605911.2410104188848.7589895811234
1559836002.01512275132-19.0151227513152
1659966040.97366911689-44.9736691168873
1760216071.981422266-50.9814222659961
1860946136.4592164406-42.4592164405967
1962026278.27614189613-76.2761418961327
2062766319.24273569651-43.2427356965136
2163066286.5383666160719.4616333839258
2263426404.10743769132-62.1074376913193
2363456320.4073530138124.5926469861906
2463286224.39089273991103.609107260093
2561916368.77173543585-177.771735435846
2662616204.5143626621756.4856373378261
2762536232.3613372241620.6386627758429
2861986247.24943893843-49.2494389384347
2962476234.857402984412.1425970155988
3062936311.42053795636-18.4205379563582
3163816432.94724172827-51.9472417282723
3264486477.39136024148-29.3913602414814
3364706451.3764462861418.6235537138627
3465166520.64288345998-4.64288345998193
3565326484.8203047984447.1796952015557
3665266414.64098934762111.359010652383
3765336459.575497578473.4245024216043
3864986548.63686574423-50.636865744229
3965076510.42969602792-3.42969602792073
4064646493.70919961818-29.7091996181771
4164536524.45815370116-71.4581537011618
4264686541.14356032191-73.1435603219106
4364976612.77564821377-115.775648213775
4468086609.45989989865198.540100101353
4567936748.704139372744.2958606272987
4669076845.1470660887761.8529339112338
4767926891.5565931881-99.5565931880992
4867576756.350298068620.649701931378331
4967346710.3453828668723.6546171331274
5066546710.65600682782-56.6560068278213
5165896665.73934906081-76.7393490608147
5264696567.49733204843-98.4973320484341
5365216505.2785036649915.7214963350125
5464486547.62319574845-99.6231957484451
5564106559.15089808502-149.150898085023
5665286601.28872337265-73.2887233726478
5764456454.90272938832-9.90272938832004
5864586439.0948842052118.9051157947924
5962156323.33499546291-108.334995462912
6061676132.0341056101834.9658943898166

\begin{tabular}{lllllllll}
\hline
Interpolation Forecasts of Exponential Smoothing \tabularnewline
t & Observed & Fitted & Residuals \tabularnewline
13 & 5952 & 5749.65534450099 & 202.344655499006 \tabularnewline
14 & 5960 & 5911.24101041888 & 48.7589895811234 \tabularnewline
15 & 5983 & 6002.01512275132 & -19.0151227513152 \tabularnewline
16 & 5996 & 6040.97366911689 & -44.9736691168873 \tabularnewline
17 & 6021 & 6071.981422266 & -50.9814222659961 \tabularnewline
18 & 6094 & 6136.4592164406 & -42.4592164405967 \tabularnewline
19 & 6202 & 6278.27614189613 & -76.2761418961327 \tabularnewline
20 & 6276 & 6319.24273569651 & -43.2427356965136 \tabularnewline
21 & 6306 & 6286.53836661607 & 19.4616333839258 \tabularnewline
22 & 6342 & 6404.10743769132 & -62.1074376913193 \tabularnewline
23 & 6345 & 6320.40735301381 & 24.5926469861906 \tabularnewline
24 & 6328 & 6224.39089273991 & 103.609107260093 \tabularnewline
25 & 6191 & 6368.77173543585 & -177.771735435846 \tabularnewline
26 & 6261 & 6204.51436266217 & 56.4856373378261 \tabularnewline
27 & 6253 & 6232.36133722416 & 20.6386627758429 \tabularnewline
28 & 6198 & 6247.24943893843 & -49.2494389384347 \tabularnewline
29 & 6247 & 6234.8574029844 & 12.1425970155988 \tabularnewline
30 & 6293 & 6311.42053795636 & -18.4205379563582 \tabularnewline
31 & 6381 & 6432.94724172827 & -51.9472417282723 \tabularnewline
32 & 6448 & 6477.39136024148 & -29.3913602414814 \tabularnewline
33 & 6470 & 6451.37644628614 & 18.6235537138627 \tabularnewline
34 & 6516 & 6520.64288345998 & -4.64288345998193 \tabularnewline
35 & 6532 & 6484.82030479844 & 47.1796952015557 \tabularnewline
36 & 6526 & 6414.64098934762 & 111.359010652383 \tabularnewline
37 & 6533 & 6459.5754975784 & 73.4245024216043 \tabularnewline
38 & 6498 & 6548.63686574423 & -50.636865744229 \tabularnewline
39 & 6507 & 6510.42969602792 & -3.42969602792073 \tabularnewline
40 & 6464 & 6493.70919961818 & -29.7091996181771 \tabularnewline
41 & 6453 & 6524.45815370116 & -71.4581537011618 \tabularnewline
42 & 6468 & 6541.14356032191 & -73.1435603219106 \tabularnewline
43 & 6497 & 6612.77564821377 & -115.775648213775 \tabularnewline
44 & 6808 & 6609.45989989865 & 198.540100101353 \tabularnewline
45 & 6793 & 6748.7041393727 & 44.2958606272987 \tabularnewline
46 & 6907 & 6845.14706608877 & 61.8529339112338 \tabularnewline
47 & 6792 & 6891.5565931881 & -99.5565931880992 \tabularnewline
48 & 6757 & 6756.35029806862 & 0.649701931378331 \tabularnewline
49 & 6734 & 6710.34538286687 & 23.6546171331274 \tabularnewline
50 & 6654 & 6710.65600682782 & -56.6560068278213 \tabularnewline
51 & 6589 & 6665.73934906081 & -76.7393490608147 \tabularnewline
52 & 6469 & 6567.49733204843 & -98.4973320484341 \tabularnewline
53 & 6521 & 6505.27850366499 & 15.7214963350125 \tabularnewline
54 & 6448 & 6547.62319574845 & -99.6231957484451 \tabularnewline
55 & 6410 & 6559.15089808502 & -149.150898085023 \tabularnewline
56 & 6528 & 6601.28872337265 & -73.2887233726478 \tabularnewline
57 & 6445 & 6454.90272938832 & -9.90272938832004 \tabularnewline
58 & 6458 & 6439.09488420521 & 18.9051157947924 \tabularnewline
59 & 6215 & 6323.33499546291 & -108.334995462912 \tabularnewline
60 & 6167 & 6132.03410561018 & 34.9658943898166 \tabularnewline
\hline
\end{tabular}
%Source: https://freestatistics.org/blog/index.php?pk=63484&T=2

[TABLE]
[ROW][C]Interpolation Forecasts of Exponential Smoothing[/C][/ROW]
[ROW][C]t[/C][C]Observed[/C][C]Fitted[/C][C]Residuals[/C][/ROW]
[ROW][C]13[/C][C]5952[/C][C]5749.65534450099[/C][C]202.344655499006[/C][/ROW]
[ROW][C]14[/C][C]5960[/C][C]5911.24101041888[/C][C]48.7589895811234[/C][/ROW]
[ROW][C]15[/C][C]5983[/C][C]6002.01512275132[/C][C]-19.0151227513152[/C][/ROW]
[ROW][C]16[/C][C]5996[/C][C]6040.97366911689[/C][C]-44.9736691168873[/C][/ROW]
[ROW][C]17[/C][C]6021[/C][C]6071.981422266[/C][C]-50.9814222659961[/C][/ROW]
[ROW][C]18[/C][C]6094[/C][C]6136.4592164406[/C][C]-42.4592164405967[/C][/ROW]
[ROW][C]19[/C][C]6202[/C][C]6278.27614189613[/C][C]-76.2761418961327[/C][/ROW]
[ROW][C]20[/C][C]6276[/C][C]6319.24273569651[/C][C]-43.2427356965136[/C][/ROW]
[ROW][C]21[/C][C]6306[/C][C]6286.53836661607[/C][C]19.4616333839258[/C][/ROW]
[ROW][C]22[/C][C]6342[/C][C]6404.10743769132[/C][C]-62.1074376913193[/C][/ROW]
[ROW][C]23[/C][C]6345[/C][C]6320.40735301381[/C][C]24.5926469861906[/C][/ROW]
[ROW][C]24[/C][C]6328[/C][C]6224.39089273991[/C][C]103.609107260093[/C][/ROW]
[ROW][C]25[/C][C]6191[/C][C]6368.77173543585[/C][C]-177.771735435846[/C][/ROW]
[ROW][C]26[/C][C]6261[/C][C]6204.51436266217[/C][C]56.4856373378261[/C][/ROW]
[ROW][C]27[/C][C]6253[/C][C]6232.36133722416[/C][C]20.6386627758429[/C][/ROW]
[ROW][C]28[/C][C]6198[/C][C]6247.24943893843[/C][C]-49.2494389384347[/C][/ROW]
[ROW][C]29[/C][C]6247[/C][C]6234.8574029844[/C][C]12.1425970155988[/C][/ROW]
[ROW][C]30[/C][C]6293[/C][C]6311.42053795636[/C][C]-18.4205379563582[/C][/ROW]
[ROW][C]31[/C][C]6381[/C][C]6432.94724172827[/C][C]-51.9472417282723[/C][/ROW]
[ROW][C]32[/C][C]6448[/C][C]6477.39136024148[/C][C]-29.3913602414814[/C][/ROW]
[ROW][C]33[/C][C]6470[/C][C]6451.37644628614[/C][C]18.6235537138627[/C][/ROW]
[ROW][C]34[/C][C]6516[/C][C]6520.64288345998[/C][C]-4.64288345998193[/C][/ROW]
[ROW][C]35[/C][C]6532[/C][C]6484.82030479844[/C][C]47.1796952015557[/C][/ROW]
[ROW][C]36[/C][C]6526[/C][C]6414.64098934762[/C][C]111.359010652383[/C][/ROW]
[ROW][C]37[/C][C]6533[/C][C]6459.5754975784[/C][C]73.4245024216043[/C][/ROW]
[ROW][C]38[/C][C]6498[/C][C]6548.63686574423[/C][C]-50.636865744229[/C][/ROW]
[ROW][C]39[/C][C]6507[/C][C]6510.42969602792[/C][C]-3.42969602792073[/C][/ROW]
[ROW][C]40[/C][C]6464[/C][C]6493.70919961818[/C][C]-29.7091996181771[/C][/ROW]
[ROW][C]41[/C][C]6453[/C][C]6524.45815370116[/C][C]-71.4581537011618[/C][/ROW]
[ROW][C]42[/C][C]6468[/C][C]6541.14356032191[/C][C]-73.1435603219106[/C][/ROW]
[ROW][C]43[/C][C]6497[/C][C]6612.77564821377[/C][C]-115.775648213775[/C][/ROW]
[ROW][C]44[/C][C]6808[/C][C]6609.45989989865[/C][C]198.540100101353[/C][/ROW]
[ROW][C]45[/C][C]6793[/C][C]6748.7041393727[/C][C]44.2958606272987[/C][/ROW]
[ROW][C]46[/C][C]6907[/C][C]6845.14706608877[/C][C]61.8529339112338[/C][/ROW]
[ROW][C]47[/C][C]6792[/C][C]6891.5565931881[/C][C]-99.5565931880992[/C][/ROW]
[ROW][C]48[/C][C]6757[/C][C]6756.35029806862[/C][C]0.649701931378331[/C][/ROW]
[ROW][C]49[/C][C]6734[/C][C]6710.34538286687[/C][C]23.6546171331274[/C][/ROW]
[ROW][C]50[/C][C]6654[/C][C]6710.65600682782[/C][C]-56.6560068278213[/C][/ROW]
[ROW][C]51[/C][C]6589[/C][C]6665.73934906081[/C][C]-76.7393490608147[/C][/ROW]
[ROW][C]52[/C][C]6469[/C][C]6567.49733204843[/C][C]-98.4973320484341[/C][/ROW]
[ROW][C]53[/C][C]6521[/C][C]6505.27850366499[/C][C]15.7214963350125[/C][/ROW]
[ROW][C]54[/C][C]6448[/C][C]6547.62319574845[/C][C]-99.6231957484451[/C][/ROW]
[ROW][C]55[/C][C]6410[/C][C]6559.15089808502[/C][C]-149.150898085023[/C][/ROW]
[ROW][C]56[/C][C]6528[/C][C]6601.28872337265[/C][C]-73.2887233726478[/C][/ROW]
[ROW][C]57[/C][C]6445[/C][C]6454.90272938832[/C][C]-9.90272938832004[/C][/ROW]
[ROW][C]58[/C][C]6458[/C][C]6439.09488420521[/C][C]18.9051157947924[/C][/ROW]
[ROW][C]59[/C][C]6215[/C][C]6323.33499546291[/C][C]-108.334995462912[/C][/ROW]
[ROW][C]60[/C][C]6167[/C][C]6132.03410561018[/C][C]34.9658943898166[/C][/ROW]
[/TABLE]
Source: https://freestatistics.org/blog/index.php?pk=63484&T=2

Globally Unique Identifier (entire table): ba.freestatistics.org/blog/index.php?pk=63484&T=2

As an alternative you can also use a QR Code:  

The GUIDs for individual cells are displayed in the table below:

Interpolation Forecasts of Exponential Smoothing
tObservedFittedResiduals
1359525749.65534450099202.344655499006
1459605911.2410104188848.7589895811234
1559836002.01512275132-19.0151227513152
1659966040.97366911689-44.9736691168873
1760216071.981422266-50.9814222659961
1860946136.4592164406-42.4592164405967
1962026278.27614189613-76.2761418961327
2062766319.24273569651-43.2427356965136
2163066286.5383666160719.4616333839258
2263426404.10743769132-62.1074376913193
2363456320.4073530138124.5926469861906
2463286224.39089273991103.609107260093
2561916368.77173543585-177.771735435846
2662616204.5143626621756.4856373378261
2762536232.3613372241620.6386627758429
2861986247.24943893843-49.2494389384347
2962476234.857402984412.1425970155988
3062936311.42053795636-18.4205379563582
3163816432.94724172827-51.9472417282723
3264486477.39136024148-29.3913602414814
3364706451.3764462861418.6235537138627
3465166520.64288345998-4.64288345998193
3565326484.8203047984447.1796952015557
3665266414.64098934762111.359010652383
3765336459.575497578473.4245024216043
3864986548.63686574423-50.636865744229
3965076510.42969602792-3.42969602792073
4064646493.70919961818-29.7091996181771
4164536524.45815370116-71.4581537011618
4264686541.14356032191-73.1435603219106
4364976612.77564821377-115.775648213775
4468086609.45989989865198.540100101353
4567936748.704139372744.2958606272987
4669076845.1470660887761.8529339112338
4767926891.5565931881-99.5565931880992
4867576756.350298068620.649701931378331
4967346710.3453828668723.6546171331274
5066546710.65600682782-56.6560068278213
5165896665.73934906081-76.7393490608147
5264696567.49733204843-98.4973320484341
5365216505.2785036649915.7214963350125
5464486547.62319574845-99.6231957484451
5564106559.15089808502-149.150898085023
5665286601.28872337265-73.2887233726478
5764456454.90272938832-9.90272938832004
5864586439.0948842052118.9051157947924
5962156323.33499546291-108.334995462912
6061676132.0341056101834.9658943898166


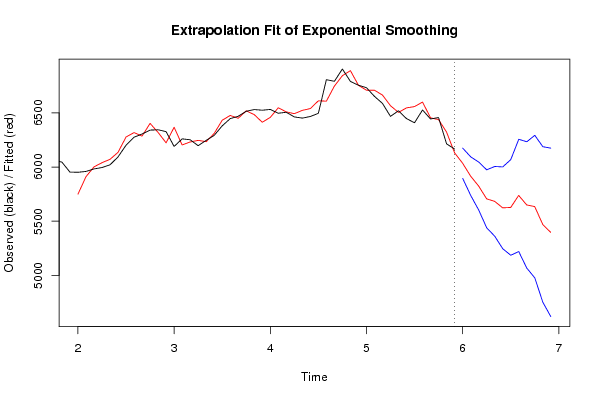
Extrapolation Forecasts of Exponential Smoothing
tForecast95% Lower Bound95% Upper Bound
616036.069435975425896.35358560756175.78528634335
625916.567060995195738.347344573636094.78677741674
635824.974316099945603.240229018976046.70840318091
645706.759370322075438.489252605815975.02948803834
655683.542840487625361.427686511936005.65799446331
665623.721886119795245.654214503796001.78955773578
675627.285413988575185.496082255566069.07474572157
685738.363730437595219.371382470846257.35607840434
695650.412050399185066.684474962986234.13962583538
705635.039373406834976.394413509066293.6843333046
715470.076977684574751.564473561886188.58948180725
725396.682599655474618.12062818456175.24457112644

\begin{tabular}{lllllllll}
\hline
Extrapolation Forecasts of Exponential Smoothing \tabularnewline
t & Forecast & 95% Lower Bound & 95% Upper Bound \tabularnewline
61 & 6036.06943597542 & 5896.3535856075 & 6175.78528634335 \tabularnewline
62 & 5916.56706099519 & 5738.34734457363 & 6094.78677741674 \tabularnewline
63 & 5824.97431609994 & 5603.24022901897 & 6046.70840318091 \tabularnewline
64 & 5706.75937032207 & 5438.48925260581 & 5975.02948803834 \tabularnewline
65 & 5683.54284048762 & 5361.42768651193 & 6005.65799446331 \tabularnewline
66 & 5623.72188611979 & 5245.65421450379 & 6001.78955773578 \tabularnewline
67 & 5627.28541398857 & 5185.49608225556 & 6069.07474572157 \tabularnewline
68 & 5738.36373043759 & 5219.37138247084 & 6257.35607840434 \tabularnewline
69 & 5650.41205039918 & 5066.68447496298 & 6234.13962583538 \tabularnewline
70 & 5635.03937340683 & 4976.39441350906 & 6293.6843333046 \tabularnewline
71 & 5470.07697768457 & 4751.56447356188 & 6188.58948180725 \tabularnewline
72 & 5396.68259965547 & 4618.1206281845 & 6175.24457112644 \tabularnewline
\hline
\end{tabular}
%Source: https://freestatistics.org/blog/index.php?pk=63484&T=3

[TABLE]
[ROW][C]Extrapolation Forecasts of Exponential Smoothing[/C][/ROW]
[ROW][C]t[/C][C]Forecast[/C][C]95% Lower Bound[/C][C]95% Upper Bound[/C][/ROW]
[ROW][C]61[/C][C]6036.06943597542[/C][C]5896.3535856075[/C][C]6175.78528634335[/C][/ROW]
[ROW][C]62[/C][C]5916.56706099519[/C][C]5738.34734457363[/C][C]6094.78677741674[/C][/ROW]
[ROW][C]63[/C][C]5824.97431609994[/C][C]5603.24022901897[/C][C]6046.70840318091[/C][/ROW]
[ROW][C]64[/C][C]5706.75937032207[/C][C]5438.48925260581[/C][C]5975.02948803834[/C][/ROW]
[ROW][C]65[/C][C]5683.54284048762[/C][C]5361.42768651193[/C][C]6005.65799446331[/C][/ROW]
[ROW][C]66[/C][C]5623.72188611979[/C][C]5245.65421450379[/C][C]6001.78955773578[/C][/ROW]
[ROW][C]67[/C][C]5627.28541398857[/C][C]5185.49608225556[/C][C]6069.07474572157[/C][/ROW]
[ROW][C]68[/C][C]5738.36373043759[/C][C]5219.37138247084[/C][C]6257.35607840434[/C][/ROW]
[ROW][C]69[/C][C]5650.41205039918[/C][C]5066.68447496298[/C][C]6234.13962583538[/C][/ROW]
[ROW][C]70[/C][C]5635.03937340683[/C][C]4976.39441350906[/C][C]6293.6843333046[/C][/ROW]
[ROW][C]71[/C][C]5470.07697768457[/C][C]4751.56447356188[/C][C]6188.58948180725[/C][/ROW]
[ROW][C]72[/C][C]5396.68259965547[/C][C]4618.1206281845[/C][C]6175.24457112644[/C][/ROW]
[/TABLE]
Source: https://freestatistics.org/blog/index.php?pk=63484&T=3

Globally Unique Identifier (entire table): ba.freestatistics.org/blog/index.php?pk=63484&T=3

As an alternative you can also use a QR Code:  

The GUIDs for individual cells are displayed in the table below:

Extrapolation Forecasts of Exponential Smoothing
tForecast95% Lower Bound95% Upper Bound
616036.069435975425896.35358560756175.78528634335
625916.567060995195738.347344573636094.78677741674
635824.974316099945603.240229018976046.70840318091
645706.759370322075438.489252605815975.02948803834
655683.542840487625361.427686511936005.65799446331
665623.721886119795245.654214503796001.78955773578
675627.285413988575185.496082255566069.07474572157
685738.363730437595219.371382470846257.35607840434
695650.412050399185066.684474962986234.13962583538
705635.039373406834976.394413509066293.6843333046
715470.076977684574751.564473561886188.58948180725
725396.682599655474618.12062818456175.24457112644


Parameters (Session):
par1 = 12 ; par2 = Triple ; par3 = multiplicative ;
Parameters (R input):
par1 = 12 ; par2 = Triple ; par3 = multiplicative ;
R code (references can be found in the software module):
par1 <- as.numeric(par1)
if (par2 == 'Single') K <- 1
if (par2 == 'Double') K <- 2
if (par2 == 'Triple') K <- par1
nx <- length(x)
nxmK <- nx - K
x <- ts(x, frequency = par1)
if (par2 == 'Single') fit <- HoltWinters(x, gamma=0, beta=0)
if (par2 == 'Double') fit <- HoltWinters(x, gamma=0)
if (par2 == 'Triple') fit <- HoltWinters(x, seasonal=par3)
fit
myresid <- x - fit$fitted[,'xhat']
bitmap(file='test1.png')
op <- par(mfrow=c(2,1))
plot(fit,ylab='Observed (black) / Fitted (red)',main='Interpolation Fit of Exponential Smoothing')
plot(myresid,ylab='Residuals',main='Interpolation Prediction Errors')
par(op)
dev.off()
bitmap(file='test2.png')
p <- predict(fit, par1, prediction.interval=TRUE)
np <- length(p[,1])
plot(fit,p,ylab='Observed (black) / Fitted (red)',main='Extrapolation Fit of Exponential Smoothing')
dev.off()
bitmap(file='test3.png')
op <- par(mfrow = c(2,2))
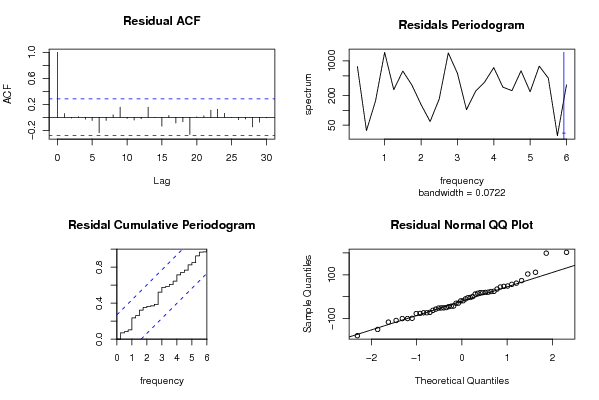
acf(as.numeric(myresid),lag.max = nx/2,main='Residual ACF')
spectrum(myresid,main='Residals Periodogram')
cpgram(myresid,main='Residal Cumulative Periodogram')
qqnorm(myresid,main='Residual Normal QQ Plot')
qqline(myresid)
par(op)
dev.off()
load(file='createtable')
a<-table.start()
a<-table.row.start(a)
a<-table.element(a,'Estimated Parameters of Exponential Smoothing',2,TRUE)
a<-table.row.end(a)
a<-table.row.start(a)
a<-table.element(a,'Parameter',header=TRUE)
a<-table.element(a,'Value',header=TRUE)
a<-table.row.end(a)
a<-table.row.start(a)
a<-table.element(a,'alpha',header=TRUE)
a<-table.element(a,fit$alpha)
a<-table.row.end(a)
a<-table.row.start(a)
a<-table.element(a,'beta',header=TRUE)
a<-table.element(a,fit$beta)
a<-table.row.end(a)
a<-table.row.start(a)
a<-table.element(a,'gamma',header=TRUE)
a<-table.element(a,fit$gamma)
a<-table.row.end(a)
a<-table.end(a)
table.save(a,file='mytable.tab')
a<-table.start()
a<-table.row.start(a)
a<-table.element(a,'Interpolation Forecasts of Exponential Smoothing',4,TRUE)
a<-table.row.end(a)
a<-table.row.start(a)
a<-table.element(a,'t',header=TRUE)
a<-table.element(a,'Observed',header=TRUE)
a<-table.element(a,'Fitted',header=TRUE)
a<-table.element(a,'Residuals',header=TRUE)
a<-table.row.end(a)
for (i in 1:nxmK) {
a<-table.row.start(a)
a<-table.element(a,i+K,header=TRUE)
a<-table.element(a,x[i+K])
a<-table.element(a,fit$fitted[i,'xhat'])
a<-table.element(a,myresid[i])
a<-table.row.end(a)
}
a<-table.end(a)
table.save(a,file='mytable1.tab')
a<-table.start()
a<-table.row.start(a)
a<-table.element(a,'Extrapolation Forecasts of Exponential Smoothing',4,TRUE)
a<-table.row.end(a)
a<-table.row.start(a)
a<-table.element(a,'t',header=TRUE)
a<-table.element(a,'Forecast',header=TRUE)
a<-table.element(a,'95% Lower Bound',header=TRUE)
a<-table.element(a,'95% Upper Bound',header=TRUE)
a<-table.row.end(a)
for (i in 1:np) {
a<-table.row.start(a)
a<-table.element(a,nx+i,header=TRUE)
a<-table.element(a,p[i,'fit'])
a<-table.element(a,p[i,'lwr'])
a<-table.element(a,p[i,'upr'])
a<-table.row.end(a)
}
a<-table.end(a)
table.save(a,file='mytable2.tab')