Free Statistics

of Irreproducible Research!

Author's title

Author*The author of this computation has been verified*
R Software Modulerwasp_arimabackwardselection.wasp
Title produced by softwareARIMA Backward Selection
Date of computationFri, 04 Dec 2009 06:28:38 -0700
Cite this page as followsStatistical Computations at FreeStatistics.org, Office for Research Development and Education, URL https://freestatistics.org/blog/index.php?v=date/2009/Dec/04/t12599334376cwjh7jzj00vs9b.htm/, Retrieved Sat, 27 Apr 2024 19:29:09 +0000
Statistical Computations at FreeStatistics.org, Office for Research Development and Education, URL https://freestatistics.org/blog/index.php?pk=63486, Retrieved Sat, 27 Apr 2024 19:29:09 +0000
QR Codes:

Original text written by user:
IsPrivate?No (this computation is public)
User-defined keywordsKVN WS9
Estimated Impact126
Family? (F = Feedback message, R = changed R code, M = changed R Module, P = changed Parameters, D = changed Data)
-     [Univariate Data Series] [data set] [2008-12-01 19:54:57] [b98453cac15ba1066b407e146608df68]
- RMP   [ARIMA Backward Selection] [] [2009-11-27 14:53:14] [b98453cac15ba1066b407e146608df68]
-   PD    [ARIMA Backward Selection] [WS 9 Backward ARI...] [2009-12-04 13:21:23] [1b4c3bbe3f2ba180dd536c5a6a81a8e6]
-   P         [ARIMA Backward Selection] [WS 9 Backward ARI...] [2009-12-04 13:28:38] [f1100e00818182135823a11ccbd0f3b9] [Current]
Feedback Forum

Post a new message
Dataseries X:
9487
8700
9627
8947
9283
8829
9947
9628
9318
9605
8640
9214
9567
8547
9185
9470
9123
9278
10170
9434
9655
9429
8739
9552
9687
9019
9672
9206
9069
9788
10312
10105
9863
9656
9295
9946
9701
9049
10190
9706
9765
9893
9994
10433
10073
10112
9266
9820
10097
9115
10411
9678
10408
10153
10368
10581
10597
10680
9738
9556


Summary of computational transaction
Raw Inputview raw input (R code)
Raw Outputview raw output of R engine
Computing time9 seconds
R Server'Gwilym Jenkins' @ 72.249.127.135

\begin{tabular}{lllllllll}
\hline
Summary of computational transaction \tabularnewline
Raw Input & view raw input (R code)  \tabularnewline
Raw Output & view raw output of R engine  \tabularnewline
Computing time & 9 seconds \tabularnewline
R Server & 'Gwilym Jenkins' @ 72.249.127.135 \tabularnewline
\hline
\end{tabular}
%Source: https://freestatistics.org/blog/index.php?pk=63486&T=0

[TABLE]
[ROW][C]Summary of computational transaction[/C][/ROW]
[ROW][C]Raw Input[/C][C]view raw input (R code) [/C][/ROW]
[ROW][C]Raw Output[/C][C]view raw output of R engine [/C][/ROW]
[ROW][C]Computing time[/C][C]9 seconds[/C][/ROW]
[ROW][C]R Server[/C][C]'Gwilym Jenkins' @ 72.249.127.135[/C][/ROW]
[/TABLE]
Source: https://freestatistics.org/blog/index.php?pk=63486&T=0

Globally Unique Identifier (entire table): ba.freestatistics.org/blog/index.php?pk=63486&T=0

As an alternative you can also use a QR Code:  

The GUIDs for individual cells are displayed in the table below:

Summary of computational transaction
Raw Inputview raw input (R code)
Raw Outputview raw output of R engine
Computing time9 seconds
R Server'Gwilym Jenkins' @ 72.249.127.135


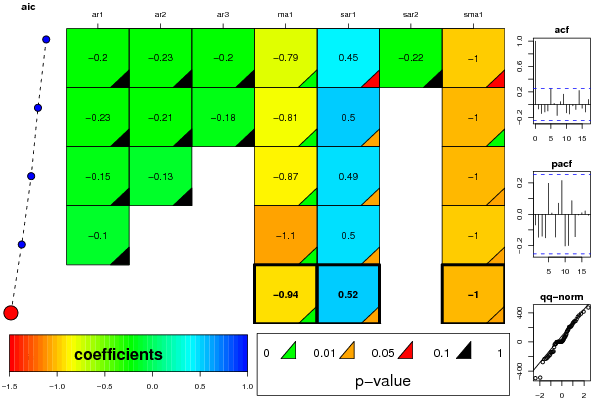
ARIMA Parameter Estimation and Backward Selection
Iterationar1ar2ar3ma1sar1sar2sma1
Estimates ( 1 )-0.2031-0.2306-0.2019-0.78980.4498-0.2166-0.9998
(p-val)(0.3266 )(0.222 )(0.2673 )(0 )(0.0628 )(0.3633 )(0.0967 )
Estimates ( 2 )-0.2258-0.2127-0.1786-0.81170.50450-1
(p-val)(0.2557 )(0.2583 )(0.3114 )(0 )(0.0358 )(NA )(0.01 )
Estimates ( 3 )-0.1506-0.13060-0.87370.48860-1.0001
(p-val)(0.4107 )(0.4453 )(NA )(0 )(0.0458 )(NA )(0.0204 )
Estimates ( 4 )-0.10400-1.09720.49860-1
(p-val)(0.5426 )(NA )(NA )(0 )(0.0393 )(NA )(0.0254 )
Estimates ( 5 )000-0.93810.51850-1
(p-val)(NA )(NA )(NA )(0 )(0.0292 )(NA )(0.014 )
Estimates ( 6 )NANANANANANANA
(p-val)(NA )(NA )(NA )(NA )(NA )(NA )(NA )
Estimates ( 7 )NANANANANANANA
(p-val)(NA )(NA )(NA )(NA )(NA )(NA )(NA )
Estimates ( 8 )NANANANANANANA
(p-val)(NA )(NA )(NA )(NA )(NA )(NA )(NA )
Estimates ( 9 )NANANANANANANA
(p-val)(NA )(NA )(NA )(NA )(NA )(NA )(NA )
Estimates ( 10 )NANANANANANANA
(p-val)(NA )(NA )(NA )(NA )(NA )(NA )(NA )
Estimates ( 11 )NANANANANANANA
(p-val)(NA )(NA )(NA )(NA )(NA )(NA )(NA )
Estimates ( 12 )NANANANANANANA
(p-val)(NA )(NA )(NA )(NA )(NA )(NA )(NA )
Estimates ( 13 )NANANANANANANA
(p-val)(NA )(NA )(NA )(NA )(NA )(NA )(NA )

\begin{tabular}{lllllllll}
\hline
ARIMA Parameter Estimation and Backward Selection \tabularnewline
Iteration & ar1 & ar2 & ar3 & ma1 & sar1 & sar2 & sma1 \tabularnewline
Estimates ( 1 ) & -0.2031 & -0.2306 & -0.2019 & -0.7898 & 0.4498 & -0.2166 & -0.9998 \tabularnewline
(p-val) & (0.3266 ) & (0.222 ) & (0.2673 ) & (0 ) & (0.0628 ) & (0.3633 ) & (0.0967 ) \tabularnewline
Estimates ( 2 ) & -0.2258 & -0.2127 & -0.1786 & -0.8117 & 0.5045 & 0 & -1 \tabularnewline
(p-val) & (0.2557 ) & (0.2583 ) & (0.3114 ) & (0 ) & (0.0358 ) & (NA ) & (0.01 ) \tabularnewline
Estimates ( 3 ) & -0.1506 & -0.1306 & 0 & -0.8737 & 0.4886 & 0 & -1.0001 \tabularnewline
(p-val) & (0.4107 ) & (0.4453 ) & (NA ) & (0 ) & (0.0458 ) & (NA ) & (0.0204 ) \tabularnewline
Estimates ( 4 ) & -0.104 & 0 & 0 & -1.0972 & 0.4986 & 0 & -1 \tabularnewline
(p-val) & (0.5426 ) & (NA ) & (NA ) & (0 ) & (0.0393 ) & (NA ) & (0.0254 ) \tabularnewline
Estimates ( 5 ) & 0 & 0 & 0 & -0.9381 & 0.5185 & 0 & -1 \tabularnewline
(p-val) & (NA ) & (NA ) & (NA ) & (0 ) & (0.0292 ) & (NA ) & (0.014 ) \tabularnewline
Estimates ( 6 ) & NA & NA & NA & NA & NA & NA & NA \tabularnewline
(p-val) & (NA ) & (NA ) & (NA ) & (NA ) & (NA ) & (NA ) & (NA ) \tabularnewline
Estimates ( 7 ) & NA & NA & NA & NA & NA & NA & NA \tabularnewline
(p-val) & (NA ) & (NA ) & (NA ) & (NA ) & (NA ) & (NA ) & (NA ) \tabularnewline
Estimates ( 8 ) & NA & NA & NA & NA & NA & NA & NA \tabularnewline
(p-val) & (NA ) & (NA ) & (NA ) & (NA ) & (NA ) & (NA ) & (NA ) \tabularnewline
Estimates ( 9 ) & NA & NA & NA & NA & NA & NA & NA \tabularnewline
(p-val) & (NA ) & (NA ) & (NA ) & (NA ) & (NA ) & (NA ) & (NA ) \tabularnewline
Estimates ( 10 ) & NA & NA & NA & NA & NA & NA & NA \tabularnewline
(p-val) & (NA ) & (NA ) & (NA ) & (NA ) & (NA ) & (NA ) & (NA ) \tabularnewline
Estimates ( 11 ) & NA & NA & NA & NA & NA & NA & NA \tabularnewline
(p-val) & (NA ) & (NA ) & (NA ) & (NA ) & (NA ) & (NA ) & (NA ) \tabularnewline
Estimates ( 12 ) & NA & NA & NA & NA & NA & NA & NA \tabularnewline
(p-val) & (NA ) & (NA ) & (NA ) & (NA ) & (NA ) & (NA ) & (NA ) \tabularnewline
Estimates ( 13 ) & NA & NA & NA & NA & NA & NA & NA \tabularnewline
(p-val) & (NA ) & (NA ) & (NA ) & (NA ) & (NA ) & (NA ) & (NA ) \tabularnewline
\hline
\end{tabular}
%Source: https://freestatistics.org/blog/index.php?pk=63486&T=1

[TABLE]
[ROW][C]ARIMA Parameter Estimation and Backward Selection[/C][/ROW]
[ROW][C]Iteration[/C][C]ar1[/C][C]ar2[/C][C]ar3[/C][C]ma1[/C][C]sar1[/C][C]sar2[/C][C]sma1[/C][/ROW]
[ROW][C]Estimates ( 1 )[/C][C]-0.2031[/C][C]-0.2306[/C][C]-0.2019[/C][C]-0.7898[/C][C]0.4498[/C][C]-0.2166[/C][C]-0.9998[/C][/ROW]
[ROW][C](p-val)[/C][C](0.3266 )[/C][C](0.222 )[/C][C](0.2673 )[/C][C](0 )[/C][C](0.0628 )[/C][C](0.3633 )[/C][C](0.0967 )[/C][/ROW]
[ROW][C]Estimates ( 2 )[/C][C]-0.2258[/C][C]-0.2127[/C][C]-0.1786[/C][C]-0.8117[/C][C]0.5045[/C][C]0[/C][C]-1[/C][/ROW]
[ROW][C](p-val)[/C][C](0.2557 )[/C][C](0.2583 )[/C][C](0.3114 )[/C][C](0 )[/C][C](0.0358 )[/C][C](NA )[/C][C](0.01 )[/C][/ROW]
[ROW][C]Estimates ( 3 )[/C][C]-0.1506[/C][C]-0.1306[/C][C]0[/C][C]-0.8737[/C][C]0.4886[/C][C]0[/C][C]-1.0001[/C][/ROW]
[ROW][C](p-val)[/C][C](0.4107 )[/C][C](0.4453 )[/C][C](NA )[/C][C](0 )[/C][C](0.0458 )[/C][C](NA )[/C][C](0.0204 )[/C][/ROW]
[ROW][C]Estimates ( 4 )[/C][C]-0.104[/C][C]0[/C][C]0[/C][C]-1.0972[/C][C]0.4986[/C][C]0[/C][C]-1[/C][/ROW]
[ROW][C](p-val)[/C][C](0.5426 )[/C][C](NA )[/C][C](NA )[/C][C](0 )[/C][C](0.0393 )[/C][C](NA )[/C][C](0.0254 )[/C][/ROW]
[ROW][C]Estimates ( 5 )[/C][C]0[/C][C]0[/C][C]0[/C][C]-0.9381[/C][C]0.5185[/C][C]0[/C][C]-1[/C][/ROW]
[ROW][C](p-val)[/C][C](NA )[/C][C](NA )[/C][C](NA )[/C][C](0 )[/C][C](0.0292 )[/C][C](NA )[/C][C](0.014 )[/C][/ROW]
[ROW][C]Estimates ( 6 )[/C][C]NA[/C][C]NA[/C][C]NA[/C][C]NA[/C][C]NA[/C][C]NA[/C][C]NA[/C][/ROW]
[ROW][C](p-val)[/C][C](NA )[/C][C](NA )[/C][C](NA )[/C][C](NA )[/C][C](NA )[/C][C](NA )[/C][C](NA )[/C][/ROW]
[ROW][C]Estimates ( 7 )[/C][C]NA[/C][C]NA[/C][C]NA[/C][C]NA[/C][C]NA[/C][C]NA[/C][C]NA[/C][/ROW]
[ROW][C](p-val)[/C][C](NA )[/C][C](NA )[/C][C](NA )[/C][C](NA )[/C][C](NA )[/C][C](NA )[/C][C](NA )[/C][/ROW]
[ROW][C]Estimates ( 8 )[/C][C]NA[/C][C]NA[/C][C]NA[/C][C]NA[/C][C]NA[/C][C]NA[/C][C]NA[/C][/ROW]
[ROW][C](p-val)[/C][C](NA )[/C][C](NA )[/C][C](NA )[/C][C](NA )[/C][C](NA )[/C][C](NA )[/C][C](NA )[/C][/ROW]
[ROW][C]Estimates ( 9 )[/C][C]NA[/C][C]NA[/C][C]NA[/C][C]NA[/C][C]NA[/C][C]NA[/C][C]NA[/C][/ROW]
[ROW][C](p-val)[/C][C](NA )[/C][C](NA )[/C][C](NA )[/C][C](NA )[/C][C](NA )[/C][C](NA )[/C][C](NA )[/C][/ROW]
[ROW][C]Estimates ( 10 )[/C][C]NA[/C][C]NA[/C][C]NA[/C][C]NA[/C][C]NA[/C][C]NA[/C][C]NA[/C][/ROW]
[ROW][C](p-val)[/C][C](NA )[/C][C](NA )[/C][C](NA )[/C][C](NA )[/C][C](NA )[/C][C](NA )[/C][C](NA )[/C][/ROW]
[ROW][C]Estimates ( 11 )[/C][C]NA[/C][C]NA[/C][C]NA[/C][C]NA[/C][C]NA[/C][C]NA[/C][C]NA[/C][/ROW]
[ROW][C](p-val)[/C][C](NA )[/C][C](NA )[/C][C](NA )[/C][C](NA )[/C][C](NA )[/C][C](NA )[/C][C](NA )[/C][/ROW]
[ROW][C]Estimates ( 12 )[/C][C]NA[/C][C]NA[/C][C]NA[/C][C]NA[/C][C]NA[/C][C]NA[/C][C]NA[/C][/ROW]
[ROW][C](p-val)[/C][C](NA )[/C][C](NA )[/C][C](NA )[/C][C](NA )[/C][C](NA )[/C][C](NA )[/C][C](NA )[/C][/ROW]
[ROW][C]Estimates ( 13 )[/C][C]NA[/C][C]NA[/C][C]NA[/C][C]NA[/C][C]NA[/C][C]NA[/C][C]NA[/C][/ROW]
[ROW][C](p-val)[/C][C](NA )[/C][C](NA )[/C][C](NA )[/C][C](NA )[/C][C](NA )[/C][C](NA )[/C][C](NA )[/C][/ROW]
[/TABLE]
Source: https://freestatistics.org/blog/index.php?pk=63486&T=1

Globally Unique Identifier (entire table): ba.freestatistics.org/blog/index.php?pk=63486&T=1

As an alternative you can also use a QR Code:  

The GUIDs for individual cells are displayed in the table below:

ARIMA Parameter Estimation and Backward Selection
Iterationar1ar2ar3ma1sar1sar2sma1
Estimates ( 1 )-0.2031-0.2306-0.2019-0.78980.4498-0.2166-0.9998
(p-val)(0.3266 )(0.222 )(0.2673 )(0 )(0.0628 )(0.3633 )(0.0967 )
Estimates ( 2 )-0.2258-0.2127-0.1786-0.81170.50450-1
(p-val)(0.2557 )(0.2583 )(0.3114 )(0 )(0.0358 )(NA )(0.01 )
Estimates ( 3 )-0.1506-0.13060-0.87370.48860-1.0001
(p-val)(0.4107 )(0.4453 )(NA )(0 )(0.0458 )(NA )(0.0204 )
Estimates ( 4 )-0.10400-1.09720.49860-1
(p-val)(0.5426 )(NA )(NA )(0 )(0.0393 )(NA )(0.0254 )
Estimates ( 5 )000-0.93810.51850-1
(p-val)(NA )(NA )(NA )(0 )(0.0292 )(NA )(0.014 )
Estimates ( 6 )NANANANANANANA
(p-val)(NA )(NA )(NA )(NA )(NA )(NA )(NA )
Estimates ( 7 )NANANANANANANA
(p-val)(NA )(NA )(NA )(NA )(NA )(NA )(NA )
Estimates ( 8 )NANANANANANANA
(p-val)(NA )(NA )(NA )(NA )(NA )(NA )(NA )
Estimates ( 9 )NANANANANANANA
(p-val)(NA )(NA )(NA )(NA )(NA )(NA )(NA )
Estimates ( 10 )NANANANANANANA
(p-val)(NA )(NA )(NA )(NA )(NA )(NA )(NA )
Estimates ( 11 )NANANANANANANA
(p-val)(NA )(NA )(NA )(NA )(NA )(NA )(NA )
Estimates ( 12 )NANANANANANANA
(p-val)(NA )(NA )(NA )(NA )(NA )(NA )(NA )
Estimates ( 13 )NANANANANANANA
(p-val)(NA )(NA )(NA )(NA )(NA )(NA )(NA )


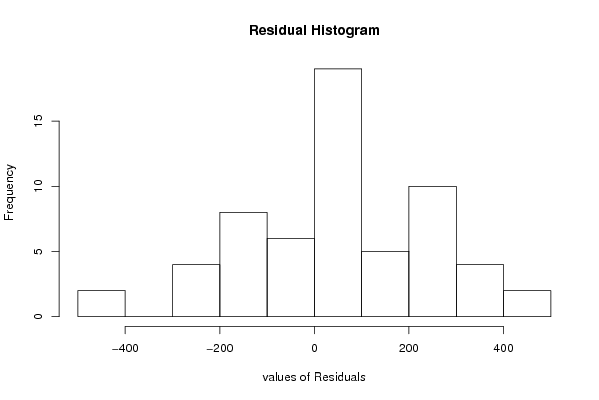
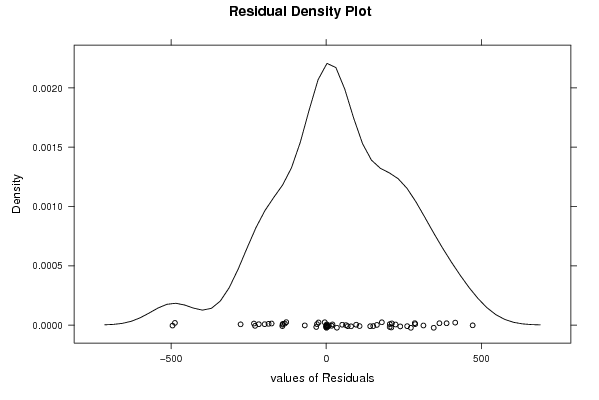
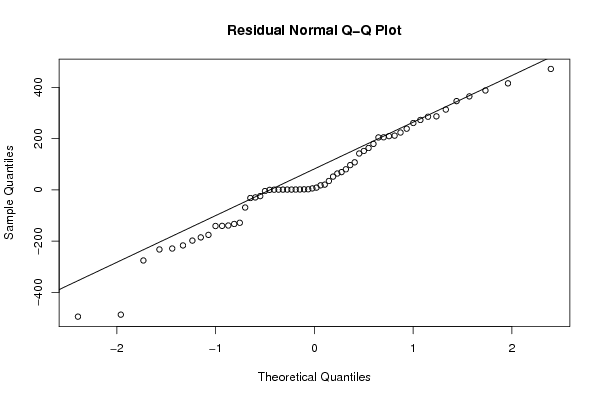
Estimated ARIMA Residuals
Value
-32.0928134170003
-128.744158053173
-275.904809333092
471.760903738039
-69.1654637163138
346.218578823237
163.216457137027
-198.373745010757
204.401273185691
-175.940320227463
17.4783262653075
223.539436263922
51.4668945111487
260.738288102879
204.977677230572
-232.867546347215
-217.221406054262
387.746049688947
63.5945545423544
364.638829260013
96.4516787351593
-29.7694719663539
286.722082027268
211.416619028106
-185.782838773910
-141.320849733312
238.502069839504
209.511569776478
285.264826114983
20.084745860321
-487.431942052935
107.320923964348
34.3269970752997
141.696685920852
-133.438481853825
-229.255640647698
69.0555896372578
-139.443214460286
80.0405548902168
-140.866735807813
415.577107396144
151.513504277031
-24.7248794807892
8.4258084117008
272.69433043438
313.164475266341
179.140854480554
-495.203375413695

\begin{tabular}{lllllllll}
\hline
Estimated ARIMA Residuals \tabularnewline
Value \tabularnewline
-32.0928134170003 \tabularnewline
-128.744158053173 \tabularnewline
-275.904809333092 \tabularnewline
471.760903738039 \tabularnewline
-69.1654637163138 \tabularnewline
346.218578823237 \tabularnewline
163.216457137027 \tabularnewline
-198.373745010757 \tabularnewline
204.401273185691 \tabularnewline
-175.940320227463 \tabularnewline
17.4783262653075 \tabularnewline
223.539436263922 \tabularnewline
51.4668945111487 \tabularnewline
260.738288102879 \tabularnewline
204.977677230572 \tabularnewline
-232.867546347215 \tabularnewline
-217.221406054262 \tabularnewline
387.746049688947 \tabularnewline
63.5945545423544 \tabularnewline
364.638829260013 \tabularnewline
96.4516787351593 \tabularnewline
-29.7694719663539 \tabularnewline
286.722082027268 \tabularnewline
211.416619028106 \tabularnewline
-185.782838773910 \tabularnewline
-141.320849733312 \tabularnewline
238.502069839504 \tabularnewline
209.511569776478 \tabularnewline
285.264826114983 \tabularnewline
20.084745860321 \tabularnewline
-487.431942052935 \tabularnewline
107.320923964348 \tabularnewline
34.3269970752997 \tabularnewline
141.696685920852 \tabularnewline
-133.438481853825 \tabularnewline
-229.255640647698 \tabularnewline
69.0555896372578 \tabularnewline
-139.443214460286 \tabularnewline
80.0405548902168 \tabularnewline
-140.866735807813 \tabularnewline
415.577107396144 \tabularnewline
151.513504277031 \tabularnewline
-24.7248794807892 \tabularnewline
8.4258084117008 \tabularnewline
272.69433043438 \tabularnewline
313.164475266341 \tabularnewline
179.140854480554 \tabularnewline
-495.203375413695 \tabularnewline
\hline
\end{tabular}
%Source: https://freestatistics.org/blog/index.php?pk=63486&T=2

[TABLE]
[ROW][C]Estimated ARIMA Residuals[/C][/ROW]
[ROW][C]Value[/C][/ROW]
[ROW][C]-32.0928134170003[/C][/ROW]
[ROW][C]-128.744158053173[/C][/ROW]
[ROW][C]-275.904809333092[/C][/ROW]
[ROW][C]471.760903738039[/C][/ROW]
[ROW][C]-69.1654637163138[/C][/ROW]
[ROW][C]346.218578823237[/C][/ROW]
[ROW][C]163.216457137027[/C][/ROW]
[ROW][C]-198.373745010757[/C][/ROW]
[ROW][C]204.401273185691[/C][/ROW]
[ROW][C]-175.940320227463[/C][/ROW]
[ROW][C]17.4783262653075[/C][/ROW]
[ROW][C]223.539436263922[/C][/ROW]
[ROW][C]51.4668945111487[/C][/ROW]
[ROW][C]260.738288102879[/C][/ROW]
[ROW][C]204.977677230572[/C][/ROW]
[ROW][C]-232.867546347215[/C][/ROW]
[ROW][C]-217.221406054262[/C][/ROW]
[ROW][C]387.746049688947[/C][/ROW]
[ROW][C]63.5945545423544[/C][/ROW]
[ROW][C]364.638829260013[/C][/ROW]
[ROW][C]96.4516787351593[/C][/ROW]
[ROW][C]-29.7694719663539[/C][/ROW]
[ROW][C]286.722082027268[/C][/ROW]
[ROW][C]211.416619028106[/C][/ROW]
[ROW][C]-185.782838773910[/C][/ROW]
[ROW][C]-141.320849733312[/C][/ROW]
[ROW][C]238.502069839504[/C][/ROW]
[ROW][C]209.511569776478[/C][/ROW]
[ROW][C]285.264826114983[/C][/ROW]
[ROW][C]20.084745860321[/C][/ROW]
[ROW][C]-487.431942052935[/C][/ROW]
[ROW][C]107.320923964348[/C][/ROW]
[ROW][C]34.3269970752997[/C][/ROW]
[ROW][C]141.696685920852[/C][/ROW]
[ROW][C]-133.438481853825[/C][/ROW]
[ROW][C]-229.255640647698[/C][/ROW]
[ROW][C]69.0555896372578[/C][/ROW]
[ROW][C]-139.443214460286[/C][/ROW]
[ROW][C]80.0405548902168[/C][/ROW]
[ROW][C]-140.866735807813[/C][/ROW]
[ROW][C]415.577107396144[/C][/ROW]
[ROW][C]151.513504277031[/C][/ROW]
[ROW][C]-24.7248794807892[/C][/ROW]
[ROW][C]8.4258084117008[/C][/ROW]
[ROW][C]272.69433043438[/C][/ROW]
[ROW][C]313.164475266341[/C][/ROW]
[ROW][C]179.140854480554[/C][/ROW]
[ROW][C]-495.203375413695[/C][/ROW]
[/TABLE]
Source: https://freestatistics.org/blog/index.php?pk=63486&T=2

Globally Unique Identifier (entire table): ba.freestatistics.org/blog/index.php?pk=63486&T=2

As an alternative you can also use a QR Code:  

The GUIDs for individual cells are displayed in the table below:

Estimated ARIMA Residuals
Value
-32.0928134170003
-128.744158053173
-275.904809333092
471.760903738039
-69.1654637163138
346.218578823237
163.216457137027
-198.373745010757
204.401273185691
-175.940320227463
17.4783262653075
223.539436263922
51.4668945111487
260.738288102879
204.977677230572
-232.867546347215
-217.221406054262
387.746049688947
63.5945545423544
364.638829260013
96.4516787351593
-29.7694719663539
286.722082027268
211.416619028106
-185.782838773910
-141.320849733312
238.502069839504
209.511569776478
285.264826114983
20.084745860321
-487.431942052935
107.320923964348
34.3269970752997
141.696685920852
-133.438481853825
-229.255640647698
69.0555896372578
-139.443214460286
80.0405548902168
-140.866735807813
415.577107396144
151.513504277031
-24.7248794807892
8.4258084117008
272.69433043438
313.164475266341
179.140854480554
-495.203375413695


Parameters (Session):
par1 = FALSE ; par2 = 1 ; par3 = 1 ; par4 = 1 ; par5 = 12 ; par6 = 3 ; par7 = 1 ; par8 = 2 ; par9 = 1 ;
Parameters (R input):
par1 = FALSE ; par2 = 1 ; par3 = 1 ; par4 = 1 ; par5 = 12 ; par6 = 3 ; par7 = 1 ; par8 = 2 ; par9 = 1 ;
R code (references can be found in the software module):
library(lattice)
if (par1 == 'TRUE') par1 <- TRUE
if (par1 == 'FALSE') par1 <- FALSE
par2 <- as.numeric(par2) #Box-Cox lambda transformation parameter
par3 <- as.numeric(par3) #degree of non-seasonal differencing
par4 <- as.numeric(par4) #degree of seasonal differencing
par5 <- as.numeric(par5) #seasonal period
par6 <- as.numeric(par6) #degree (p) of the non-seasonal AR(p) polynomial
par7 <- as.numeric(par7) #degree (q) of the non-seasonal MA(q) polynomial
par8 <- as.numeric(par8) #degree (P) of the seasonal AR(P) polynomial
par9 <- as.numeric(par9) #degree (Q) of the seasonal MA(Q) polynomial
armaGR <- function(arima.out, names, n){
try1 <- arima.out$coef
try2 <- sqrt(diag(arima.out$var.coef))
try.data.frame <- data.frame(matrix(NA,ncol=4,nrow=length(names)))
dimnames(try.data.frame) <- list(names,c('coef','std','tstat','pv'))
try.data.frame[,1] <- try1
for(i in 1:length(try2)) try.data.frame[which(rownames(try.data.frame)==names(try2)[i]),2] <- try2[i]
try.data.frame[,3] <- try.data.frame[,1] / try.data.frame[,2]
try.data.frame[,4] <- round((1-pt(abs(try.data.frame[,3]),df=n-(length(try2)+1)))*2,5)
vector <- rep(NA,length(names))
vector[is.na(try.data.frame[,4])] <- 0
maxi <- which.max(try.data.frame[,4])
continue <- max(try.data.frame[,4],na.rm=TRUE) > .05
vector[maxi] <- 0
list(summary=try.data.frame,next.vector=vector,continue=continue)
}
arimaSelect <- function(series, order=c(13,0,0), seasonal=list(order=c(2,0,0),period=12), include.mean=F){
nrc <- order[1]+order[3]+seasonal$order[1]+seasonal$order[3]
coeff <- matrix(NA, nrow=nrc*2, ncol=nrc)
pval <- matrix(NA, nrow=nrc*2, ncol=nrc)
mylist <- rep(list(NULL), nrc)
names <- NULL
if(order[1] > 0) names <- paste('ar',1:order[1],sep='')
if(order[3] > 0) names <- c( names , paste('ma',1:order[3],sep='') )
if(seasonal$order[1] > 0) names <- c(names, paste('sar',1:seasonal$order[1],sep=''))
if(seasonal$order[3] > 0) names <- c(names, paste('sma',1:seasonal$order[3],sep=''))
arima.out <- arima(series, order=order, seasonal=seasonal, include.mean=include.mean, method='ML')
mylist[[1]] <- arima.out
last.arma <- armaGR(arima.out, names, length(series))
mystop <- FALSE
i <- 1
coeff[i,] <- last.arma[[1]][,1]
pval [i,] <- last.arma[[1]][,4]
i <- 2
aic <- arima.out$aic
while(!mystop){
mylist[[i]] <- arima.out
arima.out <- arima(series, order=order, seasonal=seasonal, include.mean=include.mean, method='ML', fixed=last.arma$next.vector)
aic <- c(aic, arima.out$aic)
last.arma <- armaGR(arima.out, names, length(series))
mystop <- !last.arma$continue
coeff[i,] <- last.arma[[1]][,1]
pval [i,] <- last.arma[[1]][,4]
i <- i+1
}
list(coeff, pval, mylist, aic=aic)
}
arimaSelectplot <- function(arimaSelect.out,noms,choix){
noms <- names(arimaSelect.out[[3]][[1]]$coef)
coeff <- arimaSelect.out[[1]]
k <- min(which(is.na(coeff[,1])))-1
coeff <- coeff[1:k,]
pval <- arimaSelect.out[[2]][1:k,]
aic <- arimaSelect.out$aic[1:k]
coeff[coeff==0] <- NA
n <- ncol(coeff)
if(missing(choix)) choix <- k
layout(matrix(c(1,1,1,2,
3,3,3,2,
3,3,3,4,
5,6,7,7),nr=4),
widths=c(10,35,45,15),
heights=c(30,30,15,15))
couleurs <- rainbow(75)[1:50]#(50)
ticks <- pretty(coeff)
par(mar=c(1,1,3,1))
plot(aic,k:1-.5,type='o',pch=21,bg='blue',cex=2,axes=F,lty=2,xpd=NA)
points(aic[choix],k-choix+.5,pch=21,cex=4,bg=2,xpd=NA)
title('aic',line=2)
par(mar=c(3,0,0,0))
plot(0,axes=F,xlab='',ylab='',xlim=range(ticks),ylim=c(.1,1))
rect(xleft = min(ticks) + (0:49)/50*(max(ticks)-min(ticks)),
xright = min(ticks) + (1:50)/50*(max(ticks)-min(ticks)),
ytop = rep(1,50),
ybottom= rep(0,50),col=couleurs,border=NA)
axis(1,ticks)
rect(xleft=min(ticks),xright=max(ticks),ytop=1,ybottom=0)
text(mean(coeff,na.rm=T),.5,'coefficients',cex=2,font=2)
par(mar=c(1,1,3,1))
image(1:n,1:k,t(coeff[k:1,]),axes=F,col=couleurs,zlim=range(ticks))
for(i in 1:n) for(j in 1:k) if(!is.na(coeff[j,i])) {
if(pval[j,i]<.01) symb = 'green'
else if( (pval[j,i]<.05) & (pval[j,i]>=.01)) symb = 'orange'
else if( (pval[j,i]<.1) & (pval[j,i]>=.05)) symb = 'red'
else symb = 'black'
polygon(c(i+.5 ,i+.2 ,i+.5 ,i+.5),
c(k-j+0.5,k-j+0.5,k-j+0.8,k-j+0.5),
col=symb)
if(j==choix) {
rect(xleft=i-.5,
xright=i+.5,
ybottom=k-j+1.5,
ytop=k-j+.5,
lwd=4)
text(i,
k-j+1,
round(coeff[j,i],2),
cex=1.2,
font=2)
}
else{
rect(xleft=i-.5,xright=i+.5,ybottom=k-j+1.5,ytop=k-j+.5)
text(i,k-j+1,round(coeff[j,i],2),cex=1.2,font=1)
}
}
axis(3,1:n,noms)
par(mar=c(0.5,0,0,0.5))
plot(0,axes=F,xlab='',ylab='',type='n',xlim=c(0,8),ylim=c(-.2,.8))
cols <- c('green','orange','red','black')
niv <- c('0','0.01','0.05','0.1')
for(i in 0:3){
polygon(c(1+2*i ,1+2*i ,1+2*i-.5 ,1+2*i),
c(.4 ,.7 , .4 , .4),
col=cols[i+1])
text(2*i,0.5,niv[i+1],cex=1.5)
}
text(8,.5,1,cex=1.5)
text(4,0,'p-value',cex=2)
box()
residus <- arimaSelect.out[[3]][[choix]]$res
par(mar=c(1,2,4,1))
acf(residus,main='')
title('acf',line=.5)
par(mar=c(1,2,4,1))
pacf(residus,main='')
title('pacf',line=.5)
par(mar=c(2,2,4,1))
qqnorm(residus,main='')
title('qq-norm',line=.5)
qqline(residus)
residus
}
if (par2 == 0) x <- log(x)
if (par2 != 0) x <- x^par2
(selection <- arimaSelect(x, order=c(par6,par3,par7), seasonal=list(order=c(par8,par4,par9), period=par5)))
bitmap(file='test1.png')
resid <- arimaSelectplot(selection)
dev.off()
resid
bitmap(file='test2.png')
acf(resid,length(resid)/2, main='Residual Autocorrelation Function')
dev.off()
bitmap(file='test3.png')
pacf(resid,length(resid)/2, main='Residual Partial Autocorrelation Function')
dev.off()
bitmap(file='test4.png')
cpgram(resid, main='Residual Cumulative Periodogram')
dev.off()
bitmap(file='test5.png')
hist(resid, main='Residual Histogram', xlab='values of Residuals')
dev.off()
bitmap(file='test6.png')
densityplot(~resid,col='black',main='Residual Density Plot', xlab='values of Residuals')
dev.off()
bitmap(file='test7.png')
qqnorm(resid, main='Residual Normal Q-Q Plot')
qqline(resid)
dev.off()
ncols <- length(selection[[1]][1,])
nrows <- length(selection[[2]][,1])-1
load(file='createtable')
a<-table.start()
a<-table.row.start(a)
a<-table.element(a,'ARIMA Parameter Estimation and Backward Selection', ncols+1,TRUE)
a<-table.row.end(a)
a<-table.row.start(a)
a<-table.element(a,'Iteration', header=TRUE)
for (i in 1:ncols) {
a<-table.element(a,names(selection[[3]][[1]]$coef)[i],header=TRUE)
}
a<-table.row.end(a)
for (j in 1:nrows) {
a<-table.row.start(a)
mydum <- 'Estimates ('
mydum <- paste(mydum,j)
mydum <- paste(mydum,')')
a<-table.element(a,mydum, header=TRUE)
for (i in 1:ncols) {
a<-table.element(a,round(selection[[1]][j,i],4))
}
a<-table.row.end(a)
a<-table.row.start(a)
a<-table.element(a,'(p-val)', header=TRUE)
for (i in 1:ncols) {
mydum <- '('
mydum <- paste(mydum,round(selection[[2]][j,i],4),sep='')
mydum <- paste(mydum,')')
a<-table.element(a,mydum)
}
a<-table.row.end(a)
}
a<-table.end(a)
table.save(a,file='mytable.tab')
a<-table.start()
a<-table.row.start(a)
a<-table.element(a,'Estimated ARIMA Residuals', 1,TRUE)
a<-table.row.end(a)
a<-table.row.start(a)
a<-table.element(a,'Value', 1,TRUE)
a<-table.row.end(a)
for (i in (par4*par5+par3):length(resid)) {
a<-table.row.start(a)
a<-table.element(a,resid[i])
a<-table.row.end(a)
}
a<-table.end(a)
table.save(a,file='mytable1.tab')