Free Statistics

of Irreproducible Research!

Author's title

Author*The author of this computation has been verified*
R Software Modulerwasp_multipleregression.wasp
Title produced by softwareMultiple Regression
Date of computationFri, 04 Dec 2009 06:31:58 -0700
Cite this page as followsStatistical Computations at FreeStatistics.org, Office for Research Development and Education, URL https://freestatistics.org/blog/index.php?v=date/2009/Dec/04/t1259933633fd1ifvd8tp1zolg.htm/, Retrieved Sat, 27 Apr 2024 23:46:54 +0000
Statistical Computations at FreeStatistics.org, Office for Research Development and Education, URL https://freestatistics.org/blog/index.php?pk=63490, Retrieved Sat, 27 Apr 2024 23:46:54 +0000
QR Codes:

Original text written by user:
IsPrivate?No (this computation is public)
User-defined keywordsLineaire trend Geen seasonal dummies
Estimated Impact110
Family? (F = Feedback message, R = changed R code, M = changed R Module, P = changed Parameters, D = changed Data)
-     [Notched Boxplots] [3/11/2009] [2009-11-02 21:10:41] [b98453cac15ba1066b407e146608df68]
- RMPD  [Multiple Regression] [Paper:Bryan Beute...] [2009-12-04 12:54:13] [408e92805dcb18620260f240a7fb9d53]
-   P       [Multiple Regression] [Paper:Bryan Beute...] [2009-12-04 13:31:58] [b32ceebc68d054278e6bda97f3d57f91] [Current]
Feedback Forum

Post a new message
Dataseries X:
100	.309	2.99
83	.333	3.45
83	.317	2.99
83	.305	3.26
82	.314	3.26
71	.310	3.42
82	.317	3.39
86	.317	2.94
64	.311	3.77
66	.314	3.87
63	.312	3.84
67	.319	3.85
41	.309	3.55
65	.305	3.88
68	.298	3.68
90	.320	3.60
98	.323	3.11
108	.338	3.11
92	.338	3.84
100	.324	2.91
87	.310	3.29
91	.322	3.42
77	.317	3.56
72	.309	3.66
59	.305	4.05
55	.310	4.13
69	.327	3.88
71	.323	4.22
88	.329	3.95
88	.328	3.77
97	.361	4.27
94	.346	4.16
82	.323	4.07
75	.322	3.89
66	.314	4.48
71	.317	4.09
83	.322	3.76
97	.334	4.14
88	.342	4.26
89	.340	4.07
70	.335	4.45


Summary of computational transaction
Raw Inputview raw input (R code)
Raw Outputview raw output of R engine
Computing time3 seconds
R Server'Gwilym Jenkins' @ 72.249.127.135

\begin{tabular}{lllllllll}
\hline
Summary of computational transaction \tabularnewline
Raw Input & view raw input (R code)  \tabularnewline
Raw Output & view raw output of R engine  \tabularnewline
Computing time & 3 seconds \tabularnewline
R Server & 'Gwilym Jenkins' @ 72.249.127.135 \tabularnewline
\hline
\end{tabular}
%Source: https://freestatistics.org/blog/index.php?pk=63490&T=0

[TABLE]
[ROW][C]Summary of computational transaction[/C][/ROW]
[ROW][C]Raw Input[/C][C]view raw input (R code) [/C][/ROW]
[ROW][C]Raw Output[/C][C]view raw output of R engine [/C][/ROW]
[ROW][C]Computing time[/C][C]3 seconds[/C][/ROW]
[ROW][C]R Server[/C][C]'Gwilym Jenkins' @ 72.249.127.135[/C][/ROW]
[/TABLE]
Source: https://freestatistics.org/blog/index.php?pk=63490&T=0

Globally Unique Identifier (entire table): ba.freestatistics.org/blog/index.php?pk=63490&T=0

As an alternative you can also use a QR Code:  

The GUIDs for individual cells are displayed in the table below:

Summary of computational transaction
Raw Inputview raw input (R code)
Raw Outputview raw output of R engine
Computing time3 seconds
R Server'Gwilym Jenkins' @ 72.249.127.135


Multiple Linear Regression - Estimated Regression Equation
WINS[t] = -65.0727521149872 + 740.308810456642OBP[t] -27.3151188564579ERA[t] + 0.394195599619473t + e[t]

\begin{tabular}{lllllllll}
\hline
Multiple Linear Regression - Estimated Regression Equation \tabularnewline
WINS[t] =  -65.0727521149872 +  740.308810456642OBP[t] -27.3151188564579ERA[t] +  0.394195599619473t  + e[t] \tabularnewline
\hline
\end{tabular}
%Source: https://freestatistics.org/blog/index.php?pk=63490&T=1

[TABLE]
[ROW][C]Multiple Linear Regression - Estimated Regression Equation[/C][/ROW]
[ROW][C]WINS[t] =  -65.0727521149872 +  740.308810456642OBP[t] -27.3151188564579ERA[t] +  0.394195599619473t  + e[t][/C][/ROW]
[/TABLE]
Source: https://freestatistics.org/blog/index.php?pk=63490&T=1

Globally Unique Identifier (entire table): ba.freestatistics.org/blog/index.php?pk=63490&T=1

As an alternative you can also use a QR Code:  

The GUIDs for individual cells are displayed in the table below:

Multiple Linear Regression - Estimated Regression Equation
WINS[t] = -65.0727521149872 + 740.308810456642OBP[t] -27.3151188564579ERA[t] + 0.394195599619473t + e[t]


Multiple Linear Regression - Ordinary Least Squares
VariableParameterS.D.T-STATH0: parameter = 02-tail p-value1-tail p-value
(Intercept)-65.072752114987238.281106-1.69990.0975490.048775
OBP740.308810456642112.3517456.589200
ERA-27.31511885645794.340911-6.292500
t0.3941955996194730.1689532.33320.0251830.012592

\begin{tabular}{lllllllll}
\hline
Multiple Linear Regression - Ordinary Least Squares \tabularnewline
Variable & Parameter & S.D. & T-STATH0: parameter = 0 & 2-tail p-value & 1-tail p-value \tabularnewline
(Intercept) & -65.0727521149872 & 38.281106 & -1.6999 & 0.097549 & 0.048775 \tabularnewline
OBP & 740.308810456642 & 112.351745 & 6.5892 & 0 & 0 \tabularnewline
ERA & -27.3151188564579 & 4.340911 & -6.2925 & 0 & 0 \tabularnewline
t & 0.394195599619473 & 0.168953 & 2.3332 & 0.025183 & 0.012592 \tabularnewline
\hline
\end{tabular}
%Source: https://freestatistics.org/blog/index.php?pk=63490&T=2

[TABLE]
[ROW][C]Multiple Linear Regression - Ordinary Least Squares[/C][/ROW]
[ROW][C]Variable[/C][C]Parameter[/C][C]S.D.[/C][C]T-STATH0: parameter = 0[/C][C]2-tail p-value[/C][C]1-tail p-value[/C][/ROW]
[ROW][C](Intercept)[/C][C]-65.0727521149872[/C][C]38.281106[/C][C]-1.6999[/C][C]0.097549[/C][C]0.048775[/C][/ROW]
[ROW][C]OBP[/C][C]740.308810456642[/C][C]112.351745[/C][C]6.5892[/C][C]0[/C][C]0[/C][/ROW]
[ROW][C]ERA[/C][C]-27.3151188564579[/C][C]4.340911[/C][C]-6.2925[/C][C]0[/C][C]0[/C][/ROW]
[ROW][C]t[/C][C]0.394195599619473[/C][C]0.168953[/C][C]2.3332[/C][C]0.025183[/C][C]0.012592[/C][/ROW]
[/TABLE]
Source: https://freestatistics.org/blog/index.php?pk=63490&T=2

Globally Unique Identifier (entire table): ba.freestatistics.org/blog/index.php?pk=63490&T=2

As an alternative you can also use a QR Code:  

The GUIDs for individual cells are displayed in the table below:

Multiple Linear Regression - Ordinary Least Squares
VariableParameterS.D.T-STATH0: parameter = 02-tail p-value1-tail p-value
(Intercept)-65.072752114987238.281106-1.69990.0975490.048775
OBP740.308810456642112.3517456.589200
ERA-27.31511885645794.340911-6.292500
t0.3941955996194730.1689532.33320.0251830.012592


Multiple Linear Regression - Regression Statistics
Multiple R0.840583294456203
R-squared0.706580274918843
Adjusted R-squared0.68278948639875
F-TEST (value)29.6997417434089
F-TEST (DF numerator)3
F-TEST (DF denominator)37
p-value5.92074611560633e-10
Multiple Linear Regression - Residual Statistics
Residual Standard Deviation7.99893167627598
Sum Squared Residuals2367.36759458406

\begin{tabular}{lllllllll}
\hline
Multiple Linear Regression - Regression Statistics \tabularnewline
Multiple R & 0.840583294456203 \tabularnewline
R-squared & 0.706580274918843 \tabularnewline
Adjusted R-squared & 0.68278948639875 \tabularnewline
F-TEST (value) & 29.6997417434089 \tabularnewline
F-TEST (DF numerator) & 3 \tabularnewline
F-TEST (DF denominator) & 37 \tabularnewline
p-value & 5.92074611560633e-10 \tabularnewline
Multiple Linear Regression - Residual Statistics \tabularnewline
Residual Standard Deviation & 7.99893167627598 \tabularnewline
Sum Squared Residuals & 2367.36759458406 \tabularnewline
\hline
\end{tabular}
%Source: https://freestatistics.org/blog/index.php?pk=63490&T=3

[TABLE]
[ROW][C]Multiple Linear Regression - Regression Statistics[/C][/ROW]
[ROW][C]Multiple R[/C][C]0.840583294456203[/C][/ROW]
[ROW][C]R-squared[/C][C]0.706580274918843[/C][/ROW]
[ROW][C]Adjusted R-squared[/C][C]0.68278948639875[/C][/ROW]
[ROW][C]F-TEST (value)[/C][C]29.6997417434089[/C][/ROW]
[ROW][C]F-TEST (DF numerator)[/C][C]3[/C][/ROW]
[ROW][C]F-TEST (DF denominator)[/C][C]37[/C][/ROW]
[ROW][C]p-value[/C][C]5.92074611560633e-10[/C][/ROW]
[ROW][C]Multiple Linear Regression - Residual Statistics[/C][/ROW]
[ROW][C]Residual Standard Deviation[/C][C]7.99893167627598[/C][/ROW]
[ROW][C]Sum Squared Residuals[/C][C]2367.36759458406[/C][/ROW]
[/TABLE]
Source: https://freestatistics.org/blog/index.php?pk=63490&T=3

Globally Unique Identifier (entire table): ba.freestatistics.org/blog/index.php?pk=63490&T=3

As an alternative you can also use a QR Code:  

The GUIDs for individual cells are displayed in the table below:

Multiple Linear Regression - Regression Statistics
Multiple R0.840583294456203
R-squared0.706580274918843
Adjusted R-squared0.68278948639875
F-TEST (value)29.6997417434089
F-TEST (DF numerator)3
F-TEST (DF denominator)37
p-value5.92074611560633e-10
Multiple Linear Regression - Residual Statistics
Residual Standard Deviation7.99893167627598
Sum Squared Residuals2367.36759458406


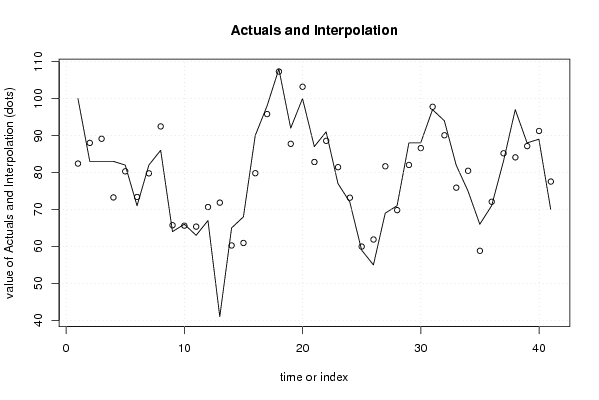
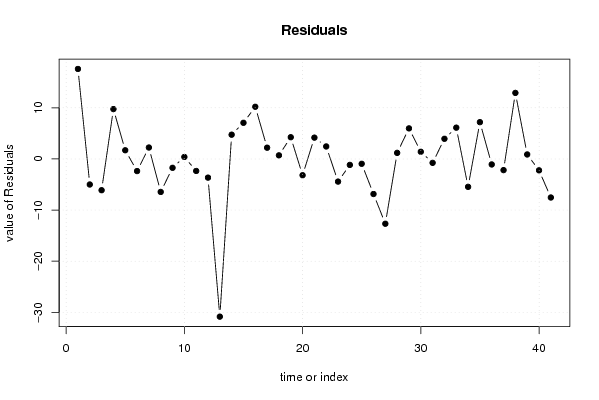
Multiple Linear Regression - Actuals, Interpolation, and Residuals
Time or IndexActualsInterpolationForecastResidualsPrediction Error
110082.404660534925717.5953394650743
28388.0013129115338-5.00131291153377
38389.1155222178176-6.11552221781763
48373.25093000071379.74906999928627
58280.3079048944431.69209510555701
67173.3704462352026-2.37044623520262
78279.76625707371232.23374292628767
88692.4522561587379-6.45225615873787
96465.7330502447574-1.73305024475740
106665.6166603901010.383339609898989
116365.3496919345009-2.34969193450094
126770.6528980187523-3.65289801875233
134171.8385411707428-30.8385411707428
146560.25751230590454.74248769409545
156860.93257000361917.0674299963809
169079.798768941801310.2012310581987
179895.79829921245512.20170078754485
18108107.2971269689240.70287303107574
199287.75128580332944.24871419667056
20100103.184218593062-3.18421859306179
218782.83434568083424.16565431916575
229188.56128155459392.43871844540609
237781.429816462026-4.42981646202605
247273.1700296923466-1.17002969234659
255959.9500936961209-0.950093696120904
265561.860623839507-6.86062383950696
276981.6688489310038-12.6688489310038
287169.8146688776011.18533112239895
298882.0257994312045.97420056879599
308886.59640761452931.40359238547073
319797.763234530989-0.763234530988965
329490.05746104796913.94253895203085
338275.88291470416716.11708529583291
347580.4535228874924-5.45352288749235
356658.80932787814857.1906721218515
367172.0773462631565-1.07734626315651
378385.1870751376903-2.18707513769031
389784.085231297335512.9147687026645
398887.12408311783320.875916882166853
408991.2275336792663-2.22753367926633
417077.5404400611486-7.54044006114858

\begin{tabular}{lllllllll}
\hline
Multiple Linear Regression - Actuals, Interpolation, and Residuals \tabularnewline
Time or Index & Actuals & InterpolationForecast & ResidualsPrediction Error \tabularnewline
1 & 100 & 82.4046605349257 & 17.5953394650743 \tabularnewline
2 & 83 & 88.0013129115338 & -5.00131291153377 \tabularnewline
3 & 83 & 89.1155222178176 & -6.11552221781763 \tabularnewline
4 & 83 & 73.2509300007137 & 9.74906999928627 \tabularnewline
5 & 82 & 80.307904894443 & 1.69209510555701 \tabularnewline
6 & 71 & 73.3704462352026 & -2.37044623520262 \tabularnewline
7 & 82 & 79.7662570737123 & 2.23374292628767 \tabularnewline
8 & 86 & 92.4522561587379 & -6.45225615873787 \tabularnewline
9 & 64 & 65.7330502447574 & -1.73305024475740 \tabularnewline
10 & 66 & 65.616660390101 & 0.383339609898989 \tabularnewline
11 & 63 & 65.3496919345009 & -2.34969193450094 \tabularnewline
12 & 67 & 70.6528980187523 & -3.65289801875233 \tabularnewline
13 & 41 & 71.8385411707428 & -30.8385411707428 \tabularnewline
14 & 65 & 60.2575123059045 & 4.74248769409545 \tabularnewline
15 & 68 & 60.9325700036191 & 7.0674299963809 \tabularnewline
16 & 90 & 79.7987689418013 & 10.2012310581987 \tabularnewline
17 & 98 & 95.7982992124551 & 2.20170078754485 \tabularnewline
18 & 108 & 107.297126968924 & 0.70287303107574 \tabularnewline
19 & 92 & 87.7512858033294 & 4.24871419667056 \tabularnewline
20 & 100 & 103.184218593062 & -3.18421859306179 \tabularnewline
21 & 87 & 82.8343456808342 & 4.16565431916575 \tabularnewline
22 & 91 & 88.5612815545939 & 2.43871844540609 \tabularnewline
23 & 77 & 81.429816462026 & -4.42981646202605 \tabularnewline
24 & 72 & 73.1700296923466 & -1.17002969234659 \tabularnewline
25 & 59 & 59.9500936961209 & -0.950093696120904 \tabularnewline
26 & 55 & 61.860623839507 & -6.86062383950696 \tabularnewline
27 & 69 & 81.6688489310038 & -12.6688489310038 \tabularnewline
28 & 71 & 69.814668877601 & 1.18533112239895 \tabularnewline
29 & 88 & 82.025799431204 & 5.97420056879599 \tabularnewline
30 & 88 & 86.5964076145293 & 1.40359238547073 \tabularnewline
31 & 97 & 97.763234530989 & -0.763234530988965 \tabularnewline
32 & 94 & 90.0574610479691 & 3.94253895203085 \tabularnewline
33 & 82 & 75.8829147041671 & 6.11708529583291 \tabularnewline
34 & 75 & 80.4535228874924 & -5.45352288749235 \tabularnewline
35 & 66 & 58.8093278781485 & 7.1906721218515 \tabularnewline
36 & 71 & 72.0773462631565 & -1.07734626315651 \tabularnewline
37 & 83 & 85.1870751376903 & -2.18707513769031 \tabularnewline
38 & 97 & 84.0852312973355 & 12.9147687026645 \tabularnewline
39 & 88 & 87.1240831178332 & 0.875916882166853 \tabularnewline
40 & 89 & 91.2275336792663 & -2.22753367926633 \tabularnewline
41 & 70 & 77.5404400611486 & -7.54044006114858 \tabularnewline
\hline
\end{tabular}
%Source: https://freestatistics.org/blog/index.php?pk=63490&T=4

[TABLE]
[ROW][C]Multiple Linear Regression - Actuals, Interpolation, and Residuals[/C][/ROW]
[ROW][C]Time or Index[/C][C]Actuals[/C][C]InterpolationForecast[/C][C]ResidualsPrediction Error[/C][/ROW]
[ROW][C]1[/C][C]100[/C][C]82.4046605349257[/C][C]17.5953394650743[/C][/ROW]
[ROW][C]2[/C][C]83[/C][C]88.0013129115338[/C][C]-5.00131291153377[/C][/ROW]
[ROW][C]3[/C][C]83[/C][C]89.1155222178176[/C][C]-6.11552221781763[/C][/ROW]
[ROW][C]4[/C][C]83[/C][C]73.2509300007137[/C][C]9.74906999928627[/C][/ROW]
[ROW][C]5[/C][C]82[/C][C]80.307904894443[/C][C]1.69209510555701[/C][/ROW]
[ROW][C]6[/C][C]71[/C][C]73.3704462352026[/C][C]-2.37044623520262[/C][/ROW]
[ROW][C]7[/C][C]82[/C][C]79.7662570737123[/C][C]2.23374292628767[/C][/ROW]
[ROW][C]8[/C][C]86[/C][C]92.4522561587379[/C][C]-6.45225615873787[/C][/ROW]
[ROW][C]9[/C][C]64[/C][C]65.7330502447574[/C][C]-1.73305024475740[/C][/ROW]
[ROW][C]10[/C][C]66[/C][C]65.616660390101[/C][C]0.383339609898989[/C][/ROW]
[ROW][C]11[/C][C]63[/C][C]65.3496919345009[/C][C]-2.34969193450094[/C][/ROW]
[ROW][C]12[/C][C]67[/C][C]70.6528980187523[/C][C]-3.65289801875233[/C][/ROW]
[ROW][C]13[/C][C]41[/C][C]71.8385411707428[/C][C]-30.8385411707428[/C][/ROW]
[ROW][C]14[/C][C]65[/C][C]60.2575123059045[/C][C]4.74248769409545[/C][/ROW]
[ROW][C]15[/C][C]68[/C][C]60.9325700036191[/C][C]7.0674299963809[/C][/ROW]
[ROW][C]16[/C][C]90[/C][C]79.7987689418013[/C][C]10.2012310581987[/C][/ROW]
[ROW][C]17[/C][C]98[/C][C]95.7982992124551[/C][C]2.20170078754485[/C][/ROW]
[ROW][C]18[/C][C]108[/C][C]107.297126968924[/C][C]0.70287303107574[/C][/ROW]
[ROW][C]19[/C][C]92[/C][C]87.7512858033294[/C][C]4.24871419667056[/C][/ROW]
[ROW][C]20[/C][C]100[/C][C]103.184218593062[/C][C]-3.18421859306179[/C][/ROW]
[ROW][C]21[/C][C]87[/C][C]82.8343456808342[/C][C]4.16565431916575[/C][/ROW]
[ROW][C]22[/C][C]91[/C][C]88.5612815545939[/C][C]2.43871844540609[/C][/ROW]
[ROW][C]23[/C][C]77[/C][C]81.429816462026[/C][C]-4.42981646202605[/C][/ROW]
[ROW][C]24[/C][C]72[/C][C]73.1700296923466[/C][C]-1.17002969234659[/C][/ROW]
[ROW][C]25[/C][C]59[/C][C]59.9500936961209[/C][C]-0.950093696120904[/C][/ROW]
[ROW][C]26[/C][C]55[/C][C]61.860623839507[/C][C]-6.86062383950696[/C][/ROW]
[ROW][C]27[/C][C]69[/C][C]81.6688489310038[/C][C]-12.6688489310038[/C][/ROW]
[ROW][C]28[/C][C]71[/C][C]69.814668877601[/C][C]1.18533112239895[/C][/ROW]
[ROW][C]29[/C][C]88[/C][C]82.025799431204[/C][C]5.97420056879599[/C][/ROW]
[ROW][C]30[/C][C]88[/C][C]86.5964076145293[/C][C]1.40359238547073[/C][/ROW]
[ROW][C]31[/C][C]97[/C][C]97.763234530989[/C][C]-0.763234530988965[/C][/ROW]
[ROW][C]32[/C][C]94[/C][C]90.0574610479691[/C][C]3.94253895203085[/C][/ROW]
[ROW][C]33[/C][C]82[/C][C]75.8829147041671[/C][C]6.11708529583291[/C][/ROW]
[ROW][C]34[/C][C]75[/C][C]80.4535228874924[/C][C]-5.45352288749235[/C][/ROW]
[ROW][C]35[/C][C]66[/C][C]58.8093278781485[/C][C]7.1906721218515[/C][/ROW]
[ROW][C]36[/C][C]71[/C][C]72.0773462631565[/C][C]-1.07734626315651[/C][/ROW]
[ROW][C]37[/C][C]83[/C][C]85.1870751376903[/C][C]-2.18707513769031[/C][/ROW]
[ROW][C]38[/C][C]97[/C][C]84.0852312973355[/C][C]12.9147687026645[/C][/ROW]
[ROW][C]39[/C][C]88[/C][C]87.1240831178332[/C][C]0.875916882166853[/C][/ROW]
[ROW][C]40[/C][C]89[/C][C]91.2275336792663[/C][C]-2.22753367926633[/C][/ROW]
[ROW][C]41[/C][C]70[/C][C]77.5404400611486[/C][C]-7.54044006114858[/C][/ROW]
[/TABLE]
Source: https://freestatistics.org/blog/index.php?pk=63490&T=4

Globally Unique Identifier (entire table): ba.freestatistics.org/blog/index.php?pk=63490&T=4

As an alternative you can also use a QR Code:  

The GUIDs for individual cells are displayed in the table below:

Multiple Linear Regression - Actuals, Interpolation, and Residuals
Time or IndexActualsInterpolationForecastResidualsPrediction Error
110082.404660534925717.5953394650743
28388.0013129115338-5.00131291153377
38389.1155222178176-6.11552221781763
48373.25093000071379.74906999928627
58280.3079048944431.69209510555701
67173.3704462352026-2.37044623520262
78279.76625707371232.23374292628767
88692.4522561587379-6.45225615873787
96465.7330502447574-1.73305024475740
106665.6166603901010.383339609898989
116365.3496919345009-2.34969193450094
126770.6528980187523-3.65289801875233
134171.8385411707428-30.8385411707428
146560.25751230590454.74248769409545
156860.93257000361917.0674299963809
169079.798768941801310.2012310581987
179895.79829921245512.20170078754485
18108107.2971269689240.70287303107574
199287.75128580332944.24871419667056
20100103.184218593062-3.18421859306179
218782.83434568083424.16565431916575
229188.56128155459392.43871844540609
237781.429816462026-4.42981646202605
247273.1700296923466-1.17002969234659
255959.9500936961209-0.950093696120904
265561.860623839507-6.86062383950696
276981.6688489310038-12.6688489310038
287169.8146688776011.18533112239895
298882.0257994312045.97420056879599
308886.59640761452931.40359238547073
319797.763234530989-0.763234530988965
329490.05746104796913.94253895203085
338275.88291470416716.11708529583291
347580.4535228874924-5.45352288749235
356658.80932787814857.1906721218515
367172.0773462631565-1.07734626315651
378385.1870751376903-2.18707513769031
389784.085231297335512.9147687026645
398887.12408311783320.875916882166853
408991.2275336792663-2.22753367926633
417077.5404400611486-7.54044006114858


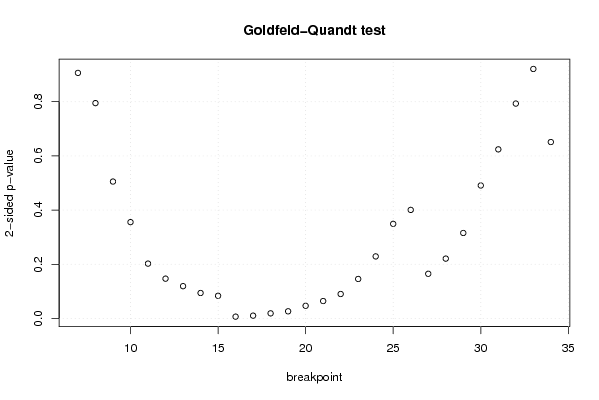
Goldfeld-Quandt test for Heteroskedasticity
p-valuesAlternative Hypothesis
breakpoint indexgreater2-sidedless
70.5468646316073230.9062707367853530.453135368392677
80.3974293486682380.7948586973364760.602570651331762
90.2526781320506480.5053562641012950.747321867949352
100.1778162878719210.3556325757438430.822183712128079
110.1011999724948150.202399944989630.898800027505185
120.07346409592743050.1469281918548610.92653590407257
130.94037672879880.1192465424024010.0596232712012005
140.9529675009057920.09406499818841580.0470324990942079
150.9581694172432660.0836611655134680.041830582756734
160.9966398466599870.00672030668002590.00336015334001295
170.9948106130340490.01037877393190270.00518938696595134
180.9905240541769320.01895189164613580.00947594582306788
190.986790130921460.02641973815707860.0132098690785393
200.9766092504393750.04678149912125090.0233907495606254
210.9678255124375150.06434897512497010.0321744875624850
220.9548357935728230.09032841285435340.0451642064271767
230.9271249593469520.1457500813060970.0728750406530483
240.8854704689749960.2290590620500080.114529531025004
250.825379219054920.349241561890160.17462078094508
260.7996397312660750.4007205374678490.200360268733925
270.917568271116930.1648634577661400.0824317288830702
280.8895377915064940.2209244169870120.110462208493506
290.842219355232790.3155612895344200.157780644767210
300.7545794872099960.4908410255800080.245420512790004
310.6879009707738050.624198058452390.312099029226195
320.603430334186910.793139331626180.39656966581309
330.4604739224567010.9209478449134030.539526077543299
340.6744002946949620.6511994106100770.325599705305038

\begin{tabular}{lllllllll}
\hline
Goldfeld-Quandt test for Heteroskedasticity \tabularnewline
p-values & Alternative Hypothesis \tabularnewline
breakpoint index & greater & 2-sided & less \tabularnewline
7 & 0.546864631607323 & 0.906270736785353 & 0.453135368392677 \tabularnewline
8 & 0.397429348668238 & 0.794858697336476 & 0.602570651331762 \tabularnewline
9 & 0.252678132050648 & 0.505356264101295 & 0.747321867949352 \tabularnewline
10 & 0.177816287871921 & 0.355632575743843 & 0.822183712128079 \tabularnewline
11 & 0.101199972494815 & 0.20239994498963 & 0.898800027505185 \tabularnewline
12 & 0.0734640959274305 & 0.146928191854861 & 0.92653590407257 \tabularnewline
13 & 0.9403767287988 & 0.119246542402401 & 0.0596232712012005 \tabularnewline
14 & 0.952967500905792 & 0.0940649981884158 & 0.0470324990942079 \tabularnewline
15 & 0.958169417243266 & 0.083661165513468 & 0.041830582756734 \tabularnewline
16 & 0.996639846659987 & 0.0067203066800259 & 0.00336015334001295 \tabularnewline
17 & 0.994810613034049 & 0.0103787739319027 & 0.00518938696595134 \tabularnewline
18 & 0.990524054176932 & 0.0189518916461358 & 0.00947594582306788 \tabularnewline
19 & 0.98679013092146 & 0.0264197381570786 & 0.0132098690785393 \tabularnewline
20 & 0.976609250439375 & 0.0467814991212509 & 0.0233907495606254 \tabularnewline
21 & 0.967825512437515 & 0.0643489751249701 & 0.0321744875624850 \tabularnewline
22 & 0.954835793572823 & 0.0903284128543534 & 0.0451642064271767 \tabularnewline
23 & 0.927124959346952 & 0.145750081306097 & 0.0728750406530483 \tabularnewline
24 & 0.885470468974996 & 0.229059062050008 & 0.114529531025004 \tabularnewline
25 & 0.82537921905492 & 0.34924156189016 & 0.17462078094508 \tabularnewline
26 & 0.799639731266075 & 0.400720537467849 & 0.200360268733925 \tabularnewline
27 & 0.91756827111693 & 0.164863457766140 & 0.0824317288830702 \tabularnewline
28 & 0.889537791506494 & 0.220924416987012 & 0.110462208493506 \tabularnewline
29 & 0.84221935523279 & 0.315561289534420 & 0.157780644767210 \tabularnewline
30 & 0.754579487209996 & 0.490841025580008 & 0.245420512790004 \tabularnewline
31 & 0.687900970773805 & 0.62419805845239 & 0.312099029226195 \tabularnewline
32 & 0.60343033418691 & 0.79313933162618 & 0.39656966581309 \tabularnewline
33 & 0.460473922456701 & 0.920947844913403 & 0.539526077543299 \tabularnewline
34 & 0.674400294694962 & 0.651199410610077 & 0.325599705305038 \tabularnewline
\hline
\end{tabular}
%Source: https://freestatistics.org/blog/index.php?pk=63490&T=5

[TABLE]
[ROW][C]Goldfeld-Quandt test for Heteroskedasticity[/C][/ROW]
[ROW][C]p-values[/C][C]Alternative Hypothesis[/C][/ROW]
[ROW][C]breakpoint index[/C][C]greater[/C][C]2-sided[/C][C]less[/C][/ROW]
[ROW][C]7[/C][C]0.546864631607323[/C][C]0.906270736785353[/C][C]0.453135368392677[/C][/ROW]
[ROW][C]8[/C][C]0.397429348668238[/C][C]0.794858697336476[/C][C]0.602570651331762[/C][/ROW]
[ROW][C]9[/C][C]0.252678132050648[/C][C]0.505356264101295[/C][C]0.747321867949352[/C][/ROW]
[ROW][C]10[/C][C]0.177816287871921[/C][C]0.355632575743843[/C][C]0.822183712128079[/C][/ROW]
[ROW][C]11[/C][C]0.101199972494815[/C][C]0.20239994498963[/C][C]0.898800027505185[/C][/ROW]
[ROW][C]12[/C][C]0.0734640959274305[/C][C]0.146928191854861[/C][C]0.92653590407257[/C][/ROW]
[ROW][C]13[/C][C]0.9403767287988[/C][C]0.119246542402401[/C][C]0.0596232712012005[/C][/ROW]
[ROW][C]14[/C][C]0.952967500905792[/C][C]0.0940649981884158[/C][C]0.0470324990942079[/C][/ROW]
[ROW][C]15[/C][C]0.958169417243266[/C][C]0.083661165513468[/C][C]0.041830582756734[/C][/ROW]
[ROW][C]16[/C][C]0.996639846659987[/C][C]0.0067203066800259[/C][C]0.00336015334001295[/C][/ROW]
[ROW][C]17[/C][C]0.994810613034049[/C][C]0.0103787739319027[/C][C]0.00518938696595134[/C][/ROW]
[ROW][C]18[/C][C]0.990524054176932[/C][C]0.0189518916461358[/C][C]0.00947594582306788[/C][/ROW]
[ROW][C]19[/C][C]0.98679013092146[/C][C]0.0264197381570786[/C][C]0.0132098690785393[/C][/ROW]
[ROW][C]20[/C][C]0.976609250439375[/C][C]0.0467814991212509[/C][C]0.0233907495606254[/C][/ROW]
[ROW][C]21[/C][C]0.967825512437515[/C][C]0.0643489751249701[/C][C]0.0321744875624850[/C][/ROW]
[ROW][C]22[/C][C]0.954835793572823[/C][C]0.0903284128543534[/C][C]0.0451642064271767[/C][/ROW]
[ROW][C]23[/C][C]0.927124959346952[/C][C]0.145750081306097[/C][C]0.0728750406530483[/C][/ROW]
[ROW][C]24[/C][C]0.885470468974996[/C][C]0.229059062050008[/C][C]0.114529531025004[/C][/ROW]
[ROW][C]25[/C][C]0.82537921905492[/C][C]0.34924156189016[/C][C]0.17462078094508[/C][/ROW]
[ROW][C]26[/C][C]0.799639731266075[/C][C]0.400720537467849[/C][C]0.200360268733925[/C][/ROW]
[ROW][C]27[/C][C]0.91756827111693[/C][C]0.164863457766140[/C][C]0.0824317288830702[/C][/ROW]
[ROW][C]28[/C][C]0.889537791506494[/C][C]0.220924416987012[/C][C]0.110462208493506[/C][/ROW]
[ROW][C]29[/C][C]0.84221935523279[/C][C]0.315561289534420[/C][C]0.157780644767210[/C][/ROW]
[ROW][C]30[/C][C]0.754579487209996[/C][C]0.490841025580008[/C][C]0.245420512790004[/C][/ROW]
[ROW][C]31[/C][C]0.687900970773805[/C][C]0.62419805845239[/C][C]0.312099029226195[/C][/ROW]
[ROW][C]32[/C][C]0.60343033418691[/C][C]0.79313933162618[/C][C]0.39656966581309[/C][/ROW]
[ROW][C]33[/C][C]0.460473922456701[/C][C]0.920947844913403[/C][C]0.539526077543299[/C][/ROW]
[ROW][C]34[/C][C]0.674400294694962[/C][C]0.651199410610077[/C][C]0.325599705305038[/C][/ROW]
[/TABLE]
Source: https://freestatistics.org/blog/index.php?pk=63490&T=5

Globally Unique Identifier (entire table): ba.freestatistics.org/blog/index.php?pk=63490&T=5

As an alternative you can also use a QR Code:  

The GUIDs for individual cells are displayed in the table below:

Goldfeld-Quandt test for Heteroskedasticity
p-valuesAlternative Hypothesis
breakpoint indexgreater2-sidedless
70.5468646316073230.9062707367853530.453135368392677
80.3974293486682380.7948586973364760.602570651331762
90.2526781320506480.5053562641012950.747321867949352
100.1778162878719210.3556325757438430.822183712128079
110.1011999724948150.202399944989630.898800027505185
120.07346409592743050.1469281918548610.92653590407257
130.94037672879880.1192465424024010.0596232712012005
140.9529675009057920.09406499818841580.0470324990942079
150.9581694172432660.0836611655134680.041830582756734
160.9966398466599870.00672030668002590.00336015334001295
170.9948106130340490.01037877393190270.00518938696595134
180.9905240541769320.01895189164613580.00947594582306788
190.986790130921460.02641973815707860.0132098690785393
200.9766092504393750.04678149912125090.0233907495606254
210.9678255124375150.06434897512497010.0321744875624850
220.9548357935728230.09032841285435340.0451642064271767
230.9271249593469520.1457500813060970.0728750406530483
240.8854704689749960.2290590620500080.114529531025004
250.825379219054920.349241561890160.17462078094508
260.7996397312660750.4007205374678490.200360268733925
270.917568271116930.1648634577661400.0824317288830702
280.8895377915064940.2209244169870120.110462208493506
290.842219355232790.3155612895344200.157780644767210
300.7545794872099960.4908410255800080.245420512790004
310.6879009707738050.624198058452390.312099029226195
320.603430334186910.793139331626180.39656966581309
330.4604739224567010.9209478449134030.539526077543299
340.6744002946949620.6511994106100770.325599705305038


Meta Analysis of Goldfeld-Quandt test for Heteroskedasticity
Description# significant tests% significant testsOK/NOK
1% type I error level10.0357142857142857NOK
5% type I error level50.178571428571429NOK
10% type I error level90.321428571428571NOK

\begin{tabular}{lllllllll}
\hline
Meta Analysis of Goldfeld-Quandt test for Heteroskedasticity \tabularnewline
Description & # significant tests & % significant tests & OK/NOK \tabularnewline
1% type I error level & 1 & 0.0357142857142857 & NOK \tabularnewline
5% type I error level & 5 & 0.178571428571429 & NOK \tabularnewline
10% type I error level & 9 & 0.321428571428571 & NOK \tabularnewline
\hline
\end{tabular}
%Source: https://freestatistics.org/blog/index.php?pk=63490&T=6

[TABLE]
[ROW][C]Meta Analysis of Goldfeld-Quandt test for Heteroskedasticity[/C][/ROW]
[ROW][C]Description[/C][C]# significant tests[/C][C]% significant tests[/C][C]OK/NOK[/C][/ROW]
[ROW][C]1% type I error level[/C][C]1[/C][C]0.0357142857142857[/C][C]NOK[/C][/ROW]
[ROW][C]5% type I error level[/C][C]5[/C][C]0.178571428571429[/C][C]NOK[/C][/ROW]
[ROW][C]10% type I error level[/C][C]9[/C][C]0.321428571428571[/C][C]NOK[/C][/ROW]
[/TABLE]
Source: https://freestatistics.org/blog/index.php?pk=63490&T=6

Globally Unique Identifier (entire table): ba.freestatistics.org/blog/index.php?pk=63490&T=6

As an alternative you can also use a QR Code:  

The GUIDs for individual cells are displayed in the table below:

Meta Analysis of Goldfeld-Quandt test for Heteroskedasticity
Description# significant tests% significant testsOK/NOK
1% type I error level10.0357142857142857NOK
5% type I error level50.178571428571429NOK
10% type I error level90.321428571428571NOK


Parameters (Session):
par1 = 1 ; par2 = Do not include Seasonal Dummies ; par3 = Linear Trend ;
Parameters (R input):
par1 = 1 ; par2 = Do not include Seasonal Dummies ; par3 = Linear Trend ;
R code (references can be found in the software module):
library(lattice)
library(lmtest)
n25 <- 25 #minimum number of obs. for Goldfeld-Quandt test
par1 <- as.numeric(par1)
x <- t(y)
k <- length(x[1,])
n <- length(x[,1])
x1 <- cbind(x[,par1], x[,1:k!=par1])
mycolnames <- c(colnames(x)[par1], colnames(x)[1:k!=par1])
colnames(x1) <- mycolnames #colnames(x)[par1]
x <- x1
if (par3 == 'First Differences'){
x2 <- array(0, dim=c(n-1,k), dimnames=list(1:(n-1), paste('(1-B)',colnames(x),sep='')))
for (i in 1:n-1) {
for (j in 1:k) {
x2[i,j] <- x[i+1,j] - x[i,j]
}
}
x <- x2
}
if (par2 == 'Include Monthly Dummies'){
x2 <- array(0, dim=c(n,11), dimnames=list(1:n, paste('M', seq(1:11), sep ='')))
for (i in 1:11){
x2[seq(i,n,12),i] <- 1
}
x <- cbind(x, x2)
}
if (par2 == 'Include Quarterly Dummies'){
x2 <- array(0, dim=c(n,3), dimnames=list(1:n, paste('Q', seq(1:3), sep ='')))
for (i in 1:3){
x2[seq(i,n,4),i] <- 1
}
x <- cbind(x, x2)
}
k <- length(x[1,])
if (par3 == 'Linear Trend'){
x <- cbind(x, c(1:n))
colnames(x)[k+1] <- 't'
}
x
k <- length(x[1,])
df <- as.data.frame(x)
(mylm <- lm(df))
(mysum <- summary(mylm))
if (n > n25) {
kp3 <- k + 3
nmkm3 <- n - k - 3
gqarr <- array(NA, dim=c(nmkm3-kp3+1,3))
numgqtests <- 0
numsignificant1 <- 0
numsignificant5 <- 0
numsignificant10 <- 0
for (mypoint in kp3:nmkm3) {
j <- 0
numgqtests <- numgqtests + 1
for (myalt in c('greater', 'two.sided', 'less')) {
j <- j + 1
gqarr[mypoint-kp3+1,j] <- gqtest(mylm, point=mypoint, alternative=myalt)$p.value
}
if (gqarr[mypoint-kp3+1,2] < 0.01) numsignificant1 <- numsignificant1 + 1
if (gqarr[mypoint-kp3+1,2] < 0.05) numsignificant5 <- numsignificant5 + 1
if (gqarr[mypoint-kp3+1,2] < 0.10) numsignificant10 <- numsignificant10 + 1
}
gqarr
}
bitmap(file='test0.png')
plot(x[,1], type='l', main='Actuals and Interpolation', ylab='value of Actuals and Interpolation (dots)', xlab='time or index')
points(x[,1]-mysum$resid)
grid()
dev.off()
bitmap(file='test1.png')
plot(mysum$resid, type='b', pch=19, main='Residuals', ylab='value of Residuals', xlab='time or index')
grid()
dev.off()
bitmap(file='test2.png')
hist(mysum$resid, main='Residual Histogram', xlab='values of Residuals')
grid()
dev.off()
bitmap(file='test3.png')
densityplot(~mysum$resid,col='black',main='Residual Density Plot', xlab='values of Residuals')
dev.off()
bitmap(file='test4.png')
qqnorm(mysum$resid, main='Residual Normal Q-Q Plot')
qqline(mysum$resid)
grid()
dev.off()
(myerror <- as.ts(mysum$resid))
bitmap(file='test5.png')
dum <- cbind(lag(myerror,k=1),myerror)
dum
dum1 <- dum[2:length(myerror),]
dum1
z <- as.data.frame(dum1)
z
plot(z,main=paste('Residual Lag plot, lowess, and regression line'), ylab='values of Residuals', xlab='lagged values of Residuals')
lines(lowess(z))
abline(lm(z))
grid()
dev.off()
bitmap(file='test6.png')
acf(mysum$resid, lag.max=length(mysum$resid)/2, main='Residual Autocorrelation Function')
grid()
dev.off()
bitmap(file='test7.png')
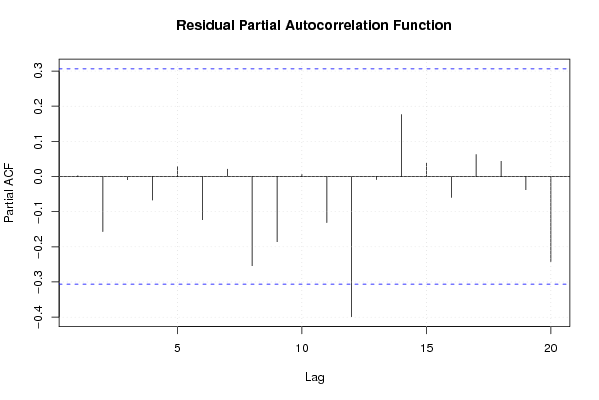
pacf(mysum$resid, lag.max=length(mysum$resid)/2, main='Residual Partial Autocorrelation Function')
grid()
dev.off()
bitmap(file='test8.png')
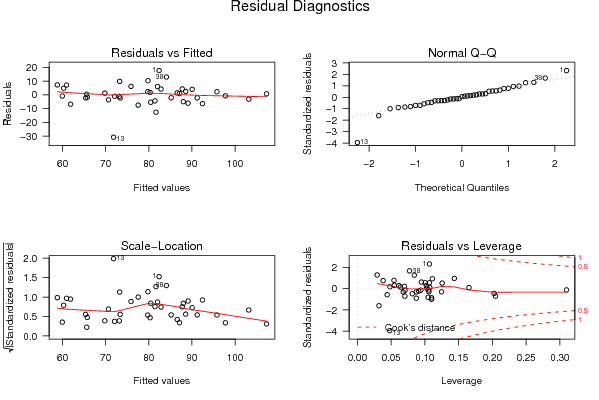
opar <- par(mfrow = c(2,2), oma = c(0, 0, 1.1, 0))
plot(mylm, las = 1, sub='Residual Diagnostics')
par(opar)
dev.off()
if (n > n25) {
bitmap(file='test9.png')
plot(kp3:nmkm3,gqarr[,2], main='Goldfeld-Quandt test',ylab='2-sided p-value',xlab='breakpoint')
grid()
dev.off()
}
load(file='createtable')
a<-table.start()
a<-table.row.start(a)
a<-table.element(a, 'Multiple Linear Regression - Estimated Regression Equation', 1, TRUE)
a<-table.row.end(a)
myeq <- colnames(x)[1]
myeq <- paste(myeq, '[t] = ', sep='')
for (i in 1:k){
if (mysum$coefficients[i,1] > 0) myeq <- paste(myeq, '+', '')
myeq <- paste(myeq, mysum$coefficients[i,1], sep=' ')
if (rownames(mysum$coefficients)[i] != '(Intercept)') {
myeq <- paste(myeq, rownames(mysum$coefficients)[i], sep='')
if (rownames(mysum$coefficients)[i] != 't') myeq <- paste(myeq, '[t]', sep='')
}
}
myeq <- paste(myeq, ' + e[t]')
a<-table.row.start(a)
a<-table.element(a, myeq)
a<-table.row.end(a)
a<-table.end(a)
table.save(a,file='mytable1.tab')
a<-table.start()
a<-table.row.start(a)
a<-table.element(a,hyperlink('ols1.htm','Multiple Linear Regression - Ordinary Least Squares',''), 6, TRUE)
a<-table.row.end(a)
a<-table.row.start(a)
a<-table.element(a,'Variable',header=TRUE)
a<-table.element(a,'Parameter',header=TRUE)
a<-table.element(a,'S.D.',header=TRUE)
a<-table.element(a,'T-STAT
H0: parameter = 0',header=TRUE)
a<-table.element(a,'2-tail p-value',header=TRUE)
a<-table.element(a,'1-tail p-value',header=TRUE)
a<-table.row.end(a)
for (i in 1:k){
a<-table.row.start(a)
a<-table.element(a,rownames(mysum$coefficients)[i],header=TRUE)
a<-table.element(a,mysum$coefficients[i,1])
a<-table.element(a, round(mysum$coefficients[i,2],6))
a<-table.element(a, round(mysum$coefficients[i,3],4))
a<-table.element(a, round(mysum$coefficients[i,4],6))
a<-table.element(a, round(mysum$coefficients[i,4]/2,6))
a<-table.row.end(a)
}
a<-table.end(a)
table.save(a,file='mytable2.tab')
a<-table.start()
a<-table.row.start(a)
a<-table.element(a, 'Multiple Linear Regression - Regression Statistics', 2, TRUE)
a<-table.row.end(a)
a<-table.row.start(a)
a<-table.element(a, 'Multiple R',1,TRUE)
a<-table.element(a, sqrt(mysum$r.squared))
a<-table.row.end(a)
a<-table.row.start(a)
a<-table.element(a, 'R-squared',1,TRUE)
a<-table.element(a, mysum$r.squared)
a<-table.row.end(a)
a<-table.row.start(a)
a<-table.element(a, 'Adjusted R-squared',1,TRUE)
a<-table.element(a, mysum$adj.r.squared)
a<-table.row.end(a)
a<-table.row.start(a)
a<-table.element(a, 'F-TEST (value)',1,TRUE)
a<-table.element(a, mysum$fstatistic[1])
a<-table.row.end(a)
a<-table.row.start(a)
a<-table.element(a, 'F-TEST (DF numerator)',1,TRUE)
a<-table.element(a, mysum$fstatistic[2])
a<-table.row.end(a)
a<-table.row.start(a)
a<-table.element(a, 'F-TEST (DF denominator)',1,TRUE)
a<-table.element(a, mysum$fstatistic[3])
a<-table.row.end(a)
a<-table.row.start(a)
a<-table.element(a, 'p-value',1,TRUE)
a<-table.element(a, 1-pf(mysum$fstatistic[1],mysum$fstatistic[2],mysum$fstatistic[3]))
a<-table.row.end(a)
a<-table.row.start(a)
a<-table.element(a, 'Multiple Linear Regression - Residual Statistics', 2, TRUE)
a<-table.row.end(a)
a<-table.row.start(a)
a<-table.element(a, 'Residual Standard Deviation',1,TRUE)
a<-table.element(a, mysum$sigma)
a<-table.row.end(a)
a<-table.row.start(a)
a<-table.element(a, 'Sum Squared Residuals',1,TRUE)
a<-table.element(a, sum(myerror*myerror))
a<-table.row.end(a)
a<-table.end(a)
table.save(a,file='mytable3.tab')
a<-table.start()
a<-table.row.start(a)
a<-table.element(a, 'Multiple Linear Regression - Actuals, Interpolation, and Residuals', 4, TRUE)
a<-table.row.end(a)
a<-table.row.start(a)
a<-table.element(a, 'Time or Index', 1, TRUE)
a<-table.element(a, 'Actuals', 1, TRUE)
a<-table.element(a, 'Interpolation
Forecast', 1, TRUE)
a<-table.element(a, 'Residuals
Prediction Error', 1, TRUE)
a<-table.row.end(a)
for (i in 1:n) {
a<-table.row.start(a)
a<-table.element(a,i, 1, TRUE)
a<-table.element(a,x[i])
a<-table.element(a,x[i]-mysum$resid[i])
a<-table.element(a,mysum$resid[i])
a<-table.row.end(a)
}
a<-table.end(a)
table.save(a,file='mytable4.tab')
if (n > n25) {
a<-table.start()
a<-table.row.start(a)
a<-table.element(a,'Goldfeld-Quandt test for Heteroskedasticity',4,TRUE)
a<-table.row.end(a)
a<-table.row.start(a)
a<-table.element(a,'p-values',header=TRUE)
a<-table.element(a,'Alternative Hypothesis',3,header=TRUE)
a<-table.row.end(a)
a<-table.row.start(a)
a<-table.element(a,'breakpoint index',header=TRUE)
a<-table.element(a,'greater',header=TRUE)
a<-table.element(a,'2-sided',header=TRUE)
a<-table.element(a,'less',header=TRUE)
a<-table.row.end(a)
for (mypoint in kp3:nmkm3) {
a<-table.row.start(a)
a<-table.element(a,mypoint,header=TRUE)
a<-table.element(a,gqarr[mypoint-kp3+1,1])
a<-table.element(a,gqarr[mypoint-kp3+1,2])
a<-table.element(a,gqarr[mypoint-kp3+1,3])
a<-table.row.end(a)
}
a<-table.end(a)
table.save(a,file='mytable5.tab')
a<-table.start()
a<-table.row.start(a)
a<-table.element(a,'Meta Analysis of Goldfeld-Quandt test for Heteroskedasticity',4,TRUE)
a<-table.row.end(a)
a<-table.row.start(a)
a<-table.element(a,'Description',header=TRUE)
a<-table.element(a,'# significant tests',header=TRUE)
a<-table.element(a,'% significant tests',header=TRUE)
a<-table.element(a,'OK/NOK',header=TRUE)
a<-table.row.end(a)
a<-table.row.start(a)
a<-table.element(a,'1% type I error level',header=TRUE)
a<-table.element(a,numsignificant1)
a<-table.element(a,numsignificant1/numgqtests)
if (numsignificant1/numgqtests < 0.01) dum <- 'OK' else dum <- 'NOK'
a<-table.element(a,dum)
a<-table.row.end(a)
a<-table.row.start(a)
a<-table.element(a,'5% type I error level',header=TRUE)
a<-table.element(a,numsignificant5)
a<-table.element(a,numsignificant5/numgqtests)
if (numsignificant5/numgqtests < 0.05) dum <- 'OK' else dum <- 'NOK'
a<-table.element(a,dum)
a<-table.row.end(a)
a<-table.row.start(a)
a<-table.element(a,'10% type I error level',header=TRUE)
a<-table.element(a,numsignificant10)
a<-table.element(a,numsignificant10/numgqtests)
if (numsignificant10/numgqtests < 0.1) dum <- 'OK' else dum <- 'NOK'
a<-table.element(a,dum)
a<-table.row.end(a)
a<-table.end(a)
table.save(a,file='mytable6.tab')
}