Free Statistics

of Irreproducible Research!

Author's title

Author*The author of this computation has been verified*
R Software Modulerwasp_exponentialsmoothing.wasp
Title produced by softwareExponential Smoothing
Date of computationFri, 04 Dec 2009 06:47:47 -0700
Cite this page as followsStatistical Computations at FreeStatistics.org, Office for Research Development and Education, URL https://freestatistics.org/blog/index.php?v=date/2009/Dec/04/t1259934514zpfx2icerpx4p1i.htm/, Retrieved Sat, 27 Apr 2024 20:02:33 +0000
Statistical Computations at FreeStatistics.org, Office for Research Development and Education, URL https://freestatistics.org/blog/index.php?pk=63513, Retrieved Sat, 27 Apr 2024 20:02:33 +0000
QR Codes:

Original text written by user:
IsPrivate?No (this computation is public)
User-defined keywords
Estimated Impact102
Family? (F = Feedback message, R = changed R code, M = changed R Module, P = changed Parameters, D = changed Data)
-     [Univariate Data Series] [data set] [2008-12-01 19:54:57] [b98453cac15ba1066b407e146608df68]
- RMP   [Exponential Smoothing] [] [2009-11-27 15:04:36] [b98453cac15ba1066b407e146608df68]
-    D      [Exponential Smoothing] [Ad hoc techniek 4] [2009-12-04 13:47:47] [82f29a5d509ab8039aab37a0145f886d] [Current]
Feedback Forum

Post a new message
Dataseries X:
562
561
555
544
537
543
594
611
613
611
594
595
591
589
584
573
567
569
621
629
628
612
595
597
593
590
580
574
573
573
620
626
620
588
566
557
561
549
532
526
511
499
555
565
542
527
510
514
517
508
493
490
469
478
528
534
518
506
502
516
528


Summary of computational transaction
Raw Inputview raw input (R code)
Raw Outputview raw output of R engine
Computing time3 seconds
R Server'Gwilym Jenkins' @ 72.249.127.135

\begin{tabular}{lllllllll}
\hline
Summary of computational transaction \tabularnewline
Raw Input & view raw input (R code)  \tabularnewline
Raw Output & view raw output of R engine  \tabularnewline
Computing time & 3 seconds \tabularnewline
R Server & 'Gwilym Jenkins' @ 72.249.127.135 \tabularnewline
\hline
\end{tabular}
%Source: https://freestatistics.org/blog/index.php?pk=63513&T=0

[TABLE]
[ROW][C]Summary of computational transaction[/C][/ROW]
[ROW][C]Raw Input[/C][C]view raw input (R code) [/C][/ROW]
[ROW][C]Raw Output[/C][C]view raw output of R engine [/C][/ROW]
[ROW][C]Computing time[/C][C]3 seconds[/C][/ROW]
[ROW][C]R Server[/C][C]'Gwilym Jenkins' @ 72.249.127.135[/C][/ROW]
[/TABLE]
Source: https://freestatistics.org/blog/index.php?pk=63513&T=0

Globally Unique Identifier (entire table): ba.freestatistics.org/blog/index.php?pk=63513&T=0

As an alternative you can also use a QR Code:  

The GUIDs for individual cells are displayed in the table below:

Summary of computational transaction
Raw Inputview raw input (R code)
Raw Outputview raw output of R engine
Computing time3 seconds
R Server'Gwilym Jenkins' @ 72.249.127.135


Estimated Parameters of Exponential Smoothing
ParameterValue
alpha0.625571876719181
beta0.230126132337169
gamma1

\begin{tabular}{lllllllll}
\hline
Estimated Parameters of Exponential Smoothing \tabularnewline
Parameter & Value \tabularnewline
alpha & 0.625571876719181 \tabularnewline
beta & 0.230126132337169 \tabularnewline
gamma & 1 \tabularnewline
\hline
\end{tabular}
%Source: https://freestatistics.org/blog/index.php?pk=63513&T=1

[TABLE]
[ROW][C]Estimated Parameters of Exponential Smoothing[/C][/ROW]
[ROW][C]Parameter[/C][C]Value[/C][/ROW]
[ROW][C]alpha[/C][C]0.625571876719181[/C][/ROW]
[ROW][C]beta[/C][C]0.230126132337169[/C][/ROW]
[ROW][C]gamma[/C][C]1[/C][/ROW]
[/TABLE]
Source: https://freestatistics.org/blog/index.php?pk=63513&T=1

Globally Unique Identifier (entire table): ba.freestatistics.org/blog/index.php?pk=63513&T=1

As an alternative you can also use a QR Code:  

The GUIDs for individual cells are displayed in the table below:

Estimated Parameters of Exponential Smoothing
ParameterValue
alpha0.625571876719181
beta0.230126132337169
gamma1


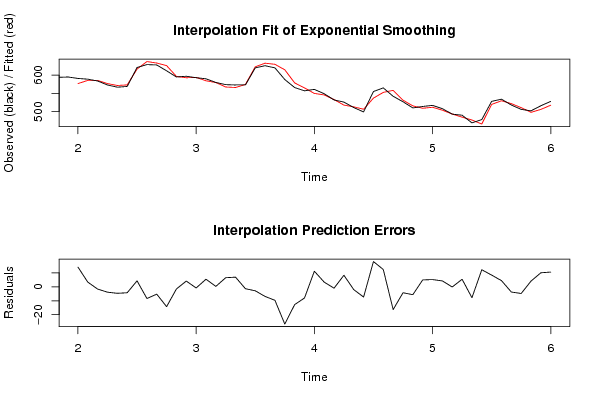
Interpolation Forecasts of Exponential Smoothing
tObservedFittedResiduals
13591576.86112649578814.1388735042120
14589585.664339837623.33566016237990
15584585.633063798857-1.63306379885705
16573576.86129846209-3.86129846209042
17567571.662787216386-4.66278721638628
18569573.281487256973-4.28148725697292
19621616.7178344481394.28216555186111
20629637.389877541802-8.38987754180164
21628633.290343135737-5.29034313573686
22612626.228391114569-14.2283911145686
23595596.525335255736-1.52533525573642
24597592.8823781598524.11762184014765
25593593.837509098968-0.837509098967757
26590584.5536727191865.44632728081444
27580579.7209298713710.279070128629201
28574567.478415686476.5215843135303
29573566.088244630826.91175536918047
30573574.362779103646-1.36277910364572
31620622.858149258897-2.85814925889724
32626632.901486894677-6.90148689467708
33620629.697590903982-9.6975909039819
34588614.712579243899-26.7125792438989
35566578.771407689236-12.7714076892356
36557565.017730232156-8.01773023215583
37561549.82749356906711.1725064309335
38549545.6468322748763.35316772512385
39532532.991762920098-0.991762920098495
40526517.711567033238.28843296676973
41511513.026355053673-2.02635505367311
42499506.360137355998-7.36013735599812
43555536.88662071223218.1133792877678
44565552.62547936345512.3745206365454
45542558.347675013975-16.3476750139749
46527531.264055785635-4.26405578563458
47510515.651658433519-5.65165843351917
48514509.0624303358974.93756966410268
49517511.8114319308215.18856806917893
50508503.7905655636984.20943443630244
51493493.143091175335-0.143091175335371
52490484.6014145921815.39858540781876
53469476.819050431286-7.81905043128614
54478465.77784860688712.2221513931132
55528519.6069064492478.39309355075318
56534529.5899729007924.41002709920838
57518521.761770699811-3.76177069981122
58506510.801474889992-4.80147488999194
59502497.8937891833724.10621081662811
60516505.94918159223410.0508184077656
61528517.44542406866910.5545759313314

\begin{tabular}{lllllllll}
\hline
Interpolation Forecasts of Exponential Smoothing \tabularnewline
t & Observed & Fitted & Residuals \tabularnewline
13 & 591 & 576.861126495788 & 14.1388735042120 \tabularnewline
14 & 589 & 585.66433983762 & 3.33566016237990 \tabularnewline
15 & 584 & 585.633063798857 & -1.63306379885705 \tabularnewline
16 & 573 & 576.86129846209 & -3.86129846209042 \tabularnewline
17 & 567 & 571.662787216386 & -4.66278721638628 \tabularnewline
18 & 569 & 573.281487256973 & -4.28148725697292 \tabularnewline
19 & 621 & 616.717834448139 & 4.28216555186111 \tabularnewline
20 & 629 & 637.389877541802 & -8.38987754180164 \tabularnewline
21 & 628 & 633.290343135737 & -5.29034313573686 \tabularnewline
22 & 612 & 626.228391114569 & -14.2283911145686 \tabularnewline
23 & 595 & 596.525335255736 & -1.52533525573642 \tabularnewline
24 & 597 & 592.882378159852 & 4.11762184014765 \tabularnewline
25 & 593 & 593.837509098968 & -0.837509098967757 \tabularnewline
26 & 590 & 584.553672719186 & 5.44632728081444 \tabularnewline
27 & 580 & 579.720929871371 & 0.279070128629201 \tabularnewline
28 & 574 & 567.47841568647 & 6.5215843135303 \tabularnewline
29 & 573 & 566.08824463082 & 6.91175536918047 \tabularnewline
30 & 573 & 574.362779103646 & -1.36277910364572 \tabularnewline
31 & 620 & 622.858149258897 & -2.85814925889724 \tabularnewline
32 & 626 & 632.901486894677 & -6.90148689467708 \tabularnewline
33 & 620 & 629.697590903982 & -9.6975909039819 \tabularnewline
34 & 588 & 614.712579243899 & -26.7125792438989 \tabularnewline
35 & 566 & 578.771407689236 & -12.7714076892356 \tabularnewline
36 & 557 & 565.017730232156 & -8.01773023215583 \tabularnewline
37 & 561 & 549.827493569067 & 11.1725064309335 \tabularnewline
38 & 549 & 545.646832274876 & 3.35316772512385 \tabularnewline
39 & 532 & 532.991762920098 & -0.991762920098495 \tabularnewline
40 & 526 & 517.71156703323 & 8.28843296676973 \tabularnewline
41 & 511 & 513.026355053673 & -2.02635505367311 \tabularnewline
42 & 499 & 506.360137355998 & -7.36013735599812 \tabularnewline
43 & 555 & 536.886620712232 & 18.1133792877678 \tabularnewline
44 & 565 & 552.625479363455 & 12.3745206365454 \tabularnewline
45 & 542 & 558.347675013975 & -16.3476750139749 \tabularnewline
46 & 527 & 531.264055785635 & -4.26405578563458 \tabularnewline
47 & 510 & 515.651658433519 & -5.65165843351917 \tabularnewline
48 & 514 & 509.062430335897 & 4.93756966410268 \tabularnewline
49 & 517 & 511.811431930821 & 5.18856806917893 \tabularnewline
50 & 508 & 503.790565563698 & 4.20943443630244 \tabularnewline
51 & 493 & 493.143091175335 & -0.143091175335371 \tabularnewline
52 & 490 & 484.601414592181 & 5.39858540781876 \tabularnewline
53 & 469 & 476.819050431286 & -7.81905043128614 \tabularnewline
54 & 478 & 465.777848606887 & 12.2221513931132 \tabularnewline
55 & 528 & 519.606906449247 & 8.39309355075318 \tabularnewline
56 & 534 & 529.589972900792 & 4.41002709920838 \tabularnewline
57 & 518 & 521.761770699811 & -3.76177069981122 \tabularnewline
58 & 506 & 510.801474889992 & -4.80147488999194 \tabularnewline
59 & 502 & 497.893789183372 & 4.10621081662811 \tabularnewline
60 & 516 & 505.949181592234 & 10.0508184077656 \tabularnewline
61 & 528 & 517.445424068669 & 10.5545759313314 \tabularnewline
\hline
\end{tabular}
%Source: https://freestatistics.org/blog/index.php?pk=63513&T=2

[TABLE]
[ROW][C]Interpolation Forecasts of Exponential Smoothing[/C][/ROW]
[ROW][C]t[/C][C]Observed[/C][C]Fitted[/C][C]Residuals[/C][/ROW]
[ROW][C]13[/C][C]591[/C][C]576.861126495788[/C][C]14.1388735042120[/C][/ROW]
[ROW][C]14[/C][C]589[/C][C]585.66433983762[/C][C]3.33566016237990[/C][/ROW]
[ROW][C]15[/C][C]584[/C][C]585.633063798857[/C][C]-1.63306379885705[/C][/ROW]
[ROW][C]16[/C][C]573[/C][C]576.86129846209[/C][C]-3.86129846209042[/C][/ROW]
[ROW][C]17[/C][C]567[/C][C]571.662787216386[/C][C]-4.66278721638628[/C][/ROW]
[ROW][C]18[/C][C]569[/C][C]573.281487256973[/C][C]-4.28148725697292[/C][/ROW]
[ROW][C]19[/C][C]621[/C][C]616.717834448139[/C][C]4.28216555186111[/C][/ROW]
[ROW][C]20[/C][C]629[/C][C]637.389877541802[/C][C]-8.38987754180164[/C][/ROW]
[ROW][C]21[/C][C]628[/C][C]633.290343135737[/C][C]-5.29034313573686[/C][/ROW]
[ROW][C]22[/C][C]612[/C][C]626.228391114569[/C][C]-14.2283911145686[/C][/ROW]
[ROW][C]23[/C][C]595[/C][C]596.525335255736[/C][C]-1.52533525573642[/C][/ROW]
[ROW][C]24[/C][C]597[/C][C]592.882378159852[/C][C]4.11762184014765[/C][/ROW]
[ROW][C]25[/C][C]593[/C][C]593.837509098968[/C][C]-0.837509098967757[/C][/ROW]
[ROW][C]26[/C][C]590[/C][C]584.553672719186[/C][C]5.44632728081444[/C][/ROW]
[ROW][C]27[/C][C]580[/C][C]579.720929871371[/C][C]0.279070128629201[/C][/ROW]
[ROW][C]28[/C][C]574[/C][C]567.47841568647[/C][C]6.5215843135303[/C][/ROW]
[ROW][C]29[/C][C]573[/C][C]566.08824463082[/C][C]6.91175536918047[/C][/ROW]
[ROW][C]30[/C][C]573[/C][C]574.362779103646[/C][C]-1.36277910364572[/C][/ROW]
[ROW][C]31[/C][C]620[/C][C]622.858149258897[/C][C]-2.85814925889724[/C][/ROW]
[ROW][C]32[/C][C]626[/C][C]632.901486894677[/C][C]-6.90148689467708[/C][/ROW]
[ROW][C]33[/C][C]620[/C][C]629.697590903982[/C][C]-9.6975909039819[/C][/ROW]
[ROW][C]34[/C][C]588[/C][C]614.712579243899[/C][C]-26.7125792438989[/C][/ROW]
[ROW][C]35[/C][C]566[/C][C]578.771407689236[/C][C]-12.7714076892356[/C][/ROW]
[ROW][C]36[/C][C]557[/C][C]565.017730232156[/C][C]-8.01773023215583[/C][/ROW]
[ROW][C]37[/C][C]561[/C][C]549.827493569067[/C][C]11.1725064309335[/C][/ROW]
[ROW][C]38[/C][C]549[/C][C]545.646832274876[/C][C]3.35316772512385[/C][/ROW]
[ROW][C]39[/C][C]532[/C][C]532.991762920098[/C][C]-0.991762920098495[/C][/ROW]
[ROW][C]40[/C][C]526[/C][C]517.71156703323[/C][C]8.28843296676973[/C][/ROW]
[ROW][C]41[/C][C]511[/C][C]513.026355053673[/C][C]-2.02635505367311[/C][/ROW]
[ROW][C]42[/C][C]499[/C][C]506.360137355998[/C][C]-7.36013735599812[/C][/ROW]
[ROW][C]43[/C][C]555[/C][C]536.886620712232[/C][C]18.1133792877678[/C][/ROW]
[ROW][C]44[/C][C]565[/C][C]552.625479363455[/C][C]12.3745206365454[/C][/ROW]
[ROW][C]45[/C][C]542[/C][C]558.347675013975[/C][C]-16.3476750139749[/C][/ROW]
[ROW][C]46[/C][C]527[/C][C]531.264055785635[/C][C]-4.26405578563458[/C][/ROW]
[ROW][C]47[/C][C]510[/C][C]515.651658433519[/C][C]-5.65165843351917[/C][/ROW]
[ROW][C]48[/C][C]514[/C][C]509.062430335897[/C][C]4.93756966410268[/C][/ROW]
[ROW][C]49[/C][C]517[/C][C]511.811431930821[/C][C]5.18856806917893[/C][/ROW]
[ROW][C]50[/C][C]508[/C][C]503.790565563698[/C][C]4.20943443630244[/C][/ROW]
[ROW][C]51[/C][C]493[/C][C]493.143091175335[/C][C]-0.143091175335371[/C][/ROW]
[ROW][C]52[/C][C]490[/C][C]484.601414592181[/C][C]5.39858540781876[/C][/ROW]
[ROW][C]53[/C][C]469[/C][C]476.819050431286[/C][C]-7.81905043128614[/C][/ROW]
[ROW][C]54[/C][C]478[/C][C]465.777848606887[/C][C]12.2221513931132[/C][/ROW]
[ROW][C]55[/C][C]528[/C][C]519.606906449247[/C][C]8.39309355075318[/C][/ROW]
[ROW][C]56[/C][C]534[/C][C]529.589972900792[/C][C]4.41002709920838[/C][/ROW]
[ROW][C]57[/C][C]518[/C][C]521.761770699811[/C][C]-3.76177069981122[/C][/ROW]
[ROW][C]58[/C][C]506[/C][C]510.801474889992[/C][C]-4.80147488999194[/C][/ROW]
[ROW][C]59[/C][C]502[/C][C]497.893789183372[/C][C]4.10621081662811[/C][/ROW]
[ROW][C]60[/C][C]516[/C][C]505.949181592234[/C][C]10.0508184077656[/C][/ROW]
[ROW][C]61[/C][C]528[/C][C]517.445424068669[/C][C]10.5545759313314[/C][/ROW]
[/TABLE]
Source: https://freestatistics.org/blog/index.php?pk=63513&T=2

Globally Unique Identifier (entire table): ba.freestatistics.org/blog/index.php?pk=63513&T=2

As an alternative you can also use a QR Code:  

The GUIDs for individual cells are displayed in the table below:

Interpolation Forecasts of Exponential Smoothing
tObservedFittedResiduals
13591576.86112649578814.1388735042120
14589585.664339837623.33566016237990
15584585.633063798857-1.63306379885705
16573576.86129846209-3.86129846209042
17567571.662787216386-4.66278721638628
18569573.281487256973-4.28148725697292
19621616.7178344481394.28216555186111
20629637.389877541802-8.38987754180164
21628633.290343135737-5.29034313573686
22612626.228391114569-14.2283911145686
23595596.525335255736-1.52533525573642
24597592.8823781598524.11762184014765
25593593.837509098968-0.837509098967757
26590584.5536727191865.44632728081444
27580579.7209298713710.279070128629201
28574567.478415686476.5215843135303
29573566.088244630826.91175536918047
30573574.362779103646-1.36277910364572
31620622.858149258897-2.85814925889724
32626632.901486894677-6.90148689467708
33620629.697590903982-9.6975909039819
34588614.712579243899-26.7125792438989
35566578.771407689236-12.7714076892356
36557565.017730232156-8.01773023215583
37561549.82749356906711.1725064309335
38549545.6468322748763.35316772512385
39532532.991762920098-0.991762920098495
40526517.711567033238.28843296676973
41511513.026355053673-2.02635505367311
42499506.360137355998-7.36013735599812
43555536.88662071223218.1133792877678
44565552.62547936345512.3745206365454
45542558.347675013975-16.3476750139749
46527531.264055785635-4.26405578563458
47510515.651658433519-5.65165843351917
48514509.0624303358974.93756966410268
49517511.8114319308215.18856806917893
50508503.7905655636984.20943443630244
51493493.143091175335-0.143091175335371
52490484.6014145921815.39858540781876
53469476.819050431286-7.81905043128614
54478465.77784860688712.2221513931132
55528519.6069064492478.39309355075318
56534529.5899729007924.41002709920838
57518521.761770699811-3.76177069981122
58506510.801474889992-4.80147488999194
59502497.8937891833724.10621081662811
60516505.94918159223410.0508184077656
61528517.44542406866910.5545759313314


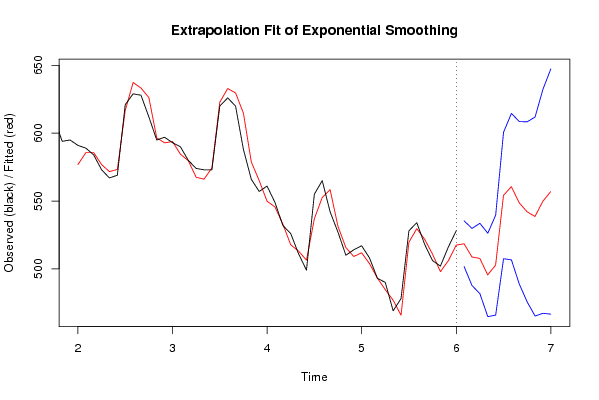
Extrapolation Forecasts of Exponential Smoothing
tForecast95% Lower Bound95% Upper Bound
62518.456173264864501.605004414465535.307342115262
63508.722727332257487.641922209766529.803532454748
64507.631329189336481.689513316805533.573145061867
65495.486262515947464.733072279686526.239452752208
66502.699924569357465.85939319267539.540455946044
67554.09212190328507.443233683123600.741010123438
68560.590602239493506.584813922506614.596390556479
69548.632852816002488.714377296160608.551328335844
70541.991645472872475.589142810295608.394148135448
71538.550329696134465.180657218607611.920002173662
72549.792527803856467.207806209790632.377249397922
73556.963390121156466.563912805494647.362867436817

\begin{tabular}{lllllllll}
\hline
Extrapolation Forecasts of Exponential Smoothing \tabularnewline
t & Forecast & 95% Lower Bound & 95% Upper Bound \tabularnewline
62 & 518.456173264864 & 501.605004414465 & 535.307342115262 \tabularnewline
63 & 508.722727332257 & 487.641922209766 & 529.803532454748 \tabularnewline
64 & 507.631329189336 & 481.689513316805 & 533.573145061867 \tabularnewline
65 & 495.486262515947 & 464.733072279686 & 526.239452752208 \tabularnewline
66 & 502.699924569357 & 465.85939319267 & 539.540455946044 \tabularnewline
67 & 554.09212190328 & 507.443233683123 & 600.741010123438 \tabularnewline
68 & 560.590602239493 & 506.584813922506 & 614.596390556479 \tabularnewline
69 & 548.632852816002 & 488.714377296160 & 608.551328335844 \tabularnewline
70 & 541.991645472872 & 475.589142810295 & 608.394148135448 \tabularnewline
71 & 538.550329696134 & 465.180657218607 & 611.920002173662 \tabularnewline
72 & 549.792527803856 & 467.207806209790 & 632.377249397922 \tabularnewline
73 & 556.963390121156 & 466.563912805494 & 647.362867436817 \tabularnewline
\hline
\end{tabular}
%Source: https://freestatistics.org/blog/index.php?pk=63513&T=3

[TABLE]
[ROW][C]Extrapolation Forecasts of Exponential Smoothing[/C][/ROW]
[ROW][C]t[/C][C]Forecast[/C][C]95% Lower Bound[/C][C]95% Upper Bound[/C][/ROW]
[ROW][C]62[/C][C]518.456173264864[/C][C]501.605004414465[/C][C]535.307342115262[/C][/ROW]
[ROW][C]63[/C][C]508.722727332257[/C][C]487.641922209766[/C][C]529.803532454748[/C][/ROW]
[ROW][C]64[/C][C]507.631329189336[/C][C]481.689513316805[/C][C]533.573145061867[/C][/ROW]
[ROW][C]65[/C][C]495.486262515947[/C][C]464.733072279686[/C][C]526.239452752208[/C][/ROW]
[ROW][C]66[/C][C]502.699924569357[/C][C]465.85939319267[/C][C]539.540455946044[/C][/ROW]
[ROW][C]67[/C][C]554.09212190328[/C][C]507.443233683123[/C][C]600.741010123438[/C][/ROW]
[ROW][C]68[/C][C]560.590602239493[/C][C]506.584813922506[/C][C]614.596390556479[/C][/ROW]
[ROW][C]69[/C][C]548.632852816002[/C][C]488.714377296160[/C][C]608.551328335844[/C][/ROW]
[ROW][C]70[/C][C]541.991645472872[/C][C]475.589142810295[/C][C]608.394148135448[/C][/ROW]
[ROW][C]71[/C][C]538.550329696134[/C][C]465.180657218607[/C][C]611.920002173662[/C][/ROW]
[ROW][C]72[/C][C]549.792527803856[/C][C]467.207806209790[/C][C]632.377249397922[/C][/ROW]
[ROW][C]73[/C][C]556.963390121156[/C][C]466.563912805494[/C][C]647.362867436817[/C][/ROW]
[/TABLE]
Source: https://freestatistics.org/blog/index.php?pk=63513&T=3

Globally Unique Identifier (entire table): ba.freestatistics.org/blog/index.php?pk=63513&T=3

As an alternative you can also use a QR Code:  

The GUIDs for individual cells are displayed in the table below:

Extrapolation Forecasts of Exponential Smoothing
tForecast95% Lower Bound95% Upper Bound
62518.456173264864501.605004414465535.307342115262
63508.722727332257487.641922209766529.803532454748
64507.631329189336481.689513316805533.573145061867
65495.486262515947464.733072279686526.239452752208
66502.699924569357465.85939319267539.540455946044
67554.09212190328507.443233683123600.741010123438
68560.590602239493506.584813922506614.596390556479
69548.632852816002488.714377296160608.551328335844
70541.991645472872475.589142810295608.394148135448
71538.550329696134465.180657218607611.920002173662
72549.792527803856467.207806209790632.377249397922
73556.963390121156466.563912805494647.362867436817


Parameters (Session):
par1 = 12 ; par2 = Triple ; par3 = multiplicative ;
Parameters (R input):
par1 = 12 ; par2 = Triple ; par3 = multiplicative ;
R code (references can be found in the software module):
par1 <- as.numeric(par1)
if (par2 == 'Single') K <- 1
if (par2 == 'Double') K <- 2
if (par2 == 'Triple') K <- par1
nx <- length(x)
nxmK <- nx - K
x <- ts(x, frequency = par1)
if (par2 == 'Single') fit <- HoltWinters(x, gamma=0, beta=0)
if (par2 == 'Double') fit <- HoltWinters(x, gamma=0)
if (par2 == 'Triple') fit <- HoltWinters(x, seasonal=par3)
fit
myresid <- x - fit$fitted[,'xhat']
bitmap(file='test1.png')
op <- par(mfrow=c(2,1))
plot(fit,ylab='Observed (black) / Fitted (red)',main='Interpolation Fit of Exponential Smoothing')
plot(myresid,ylab='Residuals',main='Interpolation Prediction Errors')
par(op)
dev.off()
bitmap(file='test2.png')
p <- predict(fit, par1, prediction.interval=TRUE)
np <- length(p[,1])
plot(fit,p,ylab='Observed (black) / Fitted (red)',main='Extrapolation Fit of Exponential Smoothing')
dev.off()
bitmap(file='test3.png')
op <- par(mfrow = c(2,2))
acf(as.numeric(myresid),lag.max = nx/2,main='Residual ACF')
spectrum(myresid,main='Residals Periodogram')
cpgram(myresid,main='Residal Cumulative Periodogram')
qqnorm(myresid,main='Residual Normal QQ Plot')
qqline(myresid)
par(op)
dev.off()
load(file='createtable')
a<-table.start()
a<-table.row.start(a)
a<-table.element(a,'Estimated Parameters of Exponential Smoothing',2,TRUE)
a<-table.row.end(a)
a<-table.row.start(a)
a<-table.element(a,'Parameter',header=TRUE)
a<-table.element(a,'Value',header=TRUE)
a<-table.row.end(a)
a<-table.row.start(a)
a<-table.element(a,'alpha',header=TRUE)
a<-table.element(a,fit$alpha)
a<-table.row.end(a)
a<-table.row.start(a)
a<-table.element(a,'beta',header=TRUE)
a<-table.element(a,fit$beta)
a<-table.row.end(a)
a<-table.row.start(a)
a<-table.element(a,'gamma',header=TRUE)
a<-table.element(a,fit$gamma)
a<-table.row.end(a)
a<-table.end(a)
table.save(a,file='mytable.tab')
a<-table.start()
a<-table.row.start(a)
a<-table.element(a,'Interpolation Forecasts of Exponential Smoothing',4,TRUE)
a<-table.row.end(a)
a<-table.row.start(a)
a<-table.element(a,'t',header=TRUE)
a<-table.element(a,'Observed',header=TRUE)
a<-table.element(a,'Fitted',header=TRUE)
a<-table.element(a,'Residuals',header=TRUE)
a<-table.row.end(a)
for (i in 1:nxmK) {
a<-table.row.start(a)
a<-table.element(a,i+K,header=TRUE)
a<-table.element(a,x[i+K])
a<-table.element(a,fit$fitted[i,'xhat'])
a<-table.element(a,myresid[i])
a<-table.row.end(a)
}
a<-table.end(a)
table.save(a,file='mytable1.tab')
a<-table.start()
a<-table.row.start(a)
a<-table.element(a,'Extrapolation Forecasts of Exponential Smoothing',4,TRUE)
a<-table.row.end(a)
a<-table.row.start(a)
a<-table.element(a,'t',header=TRUE)
a<-table.element(a,'Forecast',header=TRUE)
a<-table.element(a,'95% Lower Bound',header=TRUE)
a<-table.element(a,'95% Upper Bound',header=TRUE)
a<-table.row.end(a)
for (i in 1:np) {
a<-table.row.start(a)
a<-table.element(a,nx+i,header=TRUE)
a<-table.element(a,p[i,'fit'])
a<-table.element(a,p[i,'lwr'])
a<-table.element(a,p[i,'upr'])
a<-table.row.end(a)
}
a<-table.end(a)
table.save(a,file='mytable2.tab')