Free Statistics

of Irreproducible Research!

Author's title

Author*The author of this computation has been verified*
R Software Modulerwasp_autocorrelation.wasp
Title produced by software(Partial) Autocorrelation Function
Date of computationFri, 04 Dec 2009 06:52:45 -0700
Cite this page as followsStatistical Computations at FreeStatistics.org, Office for Research Development and Education, URL https://freestatistics.org/blog/index.php?v=date/2009/Dec/04/t1259934823wbay5pa5cbw901i.htm/, Retrieved Sat, 27 Apr 2024 15:07:25 +0000
Statistical Computations at FreeStatistics.org, Office for Research Development and Education, URL https://freestatistics.org/blog/index.php?pk=63521, Retrieved Sat, 27 Apr 2024 15:07:25 +0000
QR Codes:

Original text written by user:
IsPrivate?No (this computation is public)
User-defined keywords
Estimated Impact97
Family? (F = Feedback message, R = changed R code, M = changed R Module, P = changed Parameters, D = changed Data)
-     [Univariate Data Series] [data set] [2008-12-01 19:54:57] [b98453cac15ba1066b407e146608df68]
- RMP   [(Partial) Autocorrelation Function] [] [2009-11-27 14:47:30] [b98453cac15ba1066b407e146608df68]
-    D      [(Partial) Autocorrelation Function] [] [2009-12-04 13:52:45] [91df150cd527c563f0151b3a845ecd72] [Current]
-             [(Partial) Autocorrelation Function] [] [2009-12-04 19:45:50] [8d2349dc1d6314bc274adc9ad027c980]
Feedback Forum

Post a new message
Dataseries X:
5560
3922
3759
4138
4634
3996
4308
4143
4429
5219
4929
5755
5592
4163
4962
5208
4755
4491
5732
5731
5040
6102
4904
5369
5578
4619
4731
5011
5299
4146
4625
4736
4219
5116
4205
4121
5103
4300
4578
3809
5526
4247
3830
4394
4826
4409
4569
4106
4794
3914
3793
4405
4022
4100
4788
3163
3585
3903
4178
3863
4187


Summary of computational transaction
Raw Inputview raw input (R code)
Raw Outputview raw output of R engine
Computing time0 seconds
R Server'Gwilym Jenkins' @ 72.249.127.135

\begin{tabular}{lllllllll}
\hline
Summary of computational transaction \tabularnewline
Raw Input & view raw input (R code)  \tabularnewline
Raw Output & view raw output of R engine  \tabularnewline
Computing time & 0 seconds \tabularnewline
R Server & 'Gwilym Jenkins' @ 72.249.127.135 \tabularnewline
\hline
\end{tabular}
%Source: https://freestatistics.org/blog/index.php?pk=63521&T=0

[TABLE]
[ROW][C]Summary of computational transaction[/C][/ROW]
[ROW][C]Raw Input[/C][C]view raw input (R code) [/C][/ROW]
[ROW][C]Raw Output[/C][C]view raw output of R engine [/C][/ROW]
[ROW][C]Computing time[/C][C]0 seconds[/C][/ROW]
[ROW][C]R Server[/C][C]'Gwilym Jenkins' @ 72.249.127.135[/C][/ROW]
[/TABLE]
Source: https://freestatistics.org/blog/index.php?pk=63521&T=0

Globally Unique Identifier (entire table): ba.freestatistics.org/blog/index.php?pk=63521&T=0

As an alternative you can also use a QR Code:  

The GUIDs for individual cells are displayed in the table below:

Summary of computational transaction
Raw Inputview raw input (R code)
Raw Outputview raw output of R engine
Computing time0 seconds
R Server'Gwilym Jenkins' @ 72.249.127.135


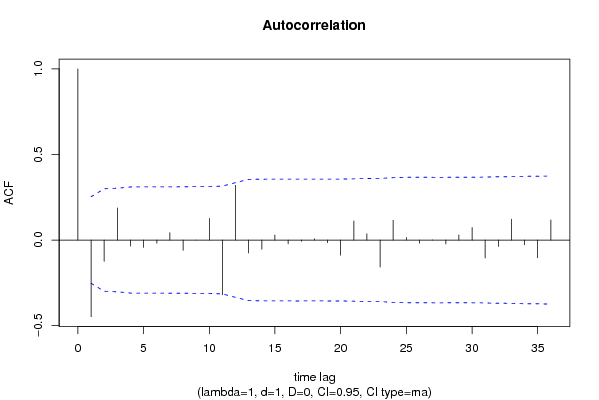
Autocorrelation Function
Time lag kACF(k)T-STATP-value
1-0.448013-3.47030.000485
2-0.124402-0.96360.169554
30.187521.45250.075783
4-0.035481-0.27480.392195
5-0.043086-0.33370.369869
6-0.018807-0.14570.442331
70.0429270.33250.370331
8-0.059967-0.46450.321984
9-0.000513-0.0040.498423
100.1263880.9790.165757
11-0.320704-2.48420.007897
120.3201422.47980.007985
13-0.075754-0.58680.279774
14-0.053673-0.41570.339538
150.0292510.22660.410761
16-0.02206-0.17090.432448
17-0.007282-0.05640.477603
180.0077860.06030.476055
19-0.016-0.12390.450891
20-0.088608-0.68640.247566
210.1107860.85810.197113
220.0360710.27940.390447
23-0.157879-1.22290.11307
240.1153620.89360.187556
250.0150810.11680.453699
26-0.018678-0.14470.442725
277.4e-056e-040.499771
28-0.023186-0.17960.429038
290.0297950.23080.409131
300.072990.56540.286962
31-0.104769-0.81150.210133
32-0.037748-0.29240.385496
330.1216530.94230.174903
34-0.028344-0.21960.413483
35-0.103726-0.80350.212441
360.1171690.90760.183864

\begin{tabular}{lllllllll}
\hline
Autocorrelation Function \tabularnewline
Time lag k & ACF(k) & T-STAT & P-value \tabularnewline
1 & -0.448013 & -3.4703 & 0.000485 \tabularnewline
2 & -0.124402 & -0.9636 & 0.169554 \tabularnewline
3 & 0.18752 & 1.4525 & 0.075783 \tabularnewline
4 & -0.035481 & -0.2748 & 0.392195 \tabularnewline
5 & -0.043086 & -0.3337 & 0.369869 \tabularnewline
6 & -0.018807 & -0.1457 & 0.442331 \tabularnewline
7 & 0.042927 & 0.3325 & 0.370331 \tabularnewline
8 & -0.059967 & -0.4645 & 0.321984 \tabularnewline
9 & -0.000513 & -0.004 & 0.498423 \tabularnewline
10 & 0.126388 & 0.979 & 0.165757 \tabularnewline
11 & -0.320704 & -2.4842 & 0.007897 \tabularnewline
12 & 0.320142 & 2.4798 & 0.007985 \tabularnewline
13 & -0.075754 & -0.5868 & 0.279774 \tabularnewline
14 & -0.053673 & -0.4157 & 0.339538 \tabularnewline
15 & 0.029251 & 0.2266 & 0.410761 \tabularnewline
16 & -0.02206 & -0.1709 & 0.432448 \tabularnewline
17 & -0.007282 & -0.0564 & 0.477603 \tabularnewline
18 & 0.007786 & 0.0603 & 0.476055 \tabularnewline
19 & -0.016 & -0.1239 & 0.450891 \tabularnewline
20 & -0.088608 & -0.6864 & 0.247566 \tabularnewline
21 & 0.110786 & 0.8581 & 0.197113 \tabularnewline
22 & 0.036071 & 0.2794 & 0.390447 \tabularnewline
23 & -0.157879 & -1.2229 & 0.11307 \tabularnewline
24 & 0.115362 & 0.8936 & 0.187556 \tabularnewline
25 & 0.015081 & 0.1168 & 0.453699 \tabularnewline
26 & -0.018678 & -0.1447 & 0.442725 \tabularnewline
27 & 7.4e-05 & 6e-04 & 0.499771 \tabularnewline
28 & -0.023186 & -0.1796 & 0.429038 \tabularnewline
29 & 0.029795 & 0.2308 & 0.409131 \tabularnewline
30 & 0.07299 & 0.5654 & 0.286962 \tabularnewline
31 & -0.104769 & -0.8115 & 0.210133 \tabularnewline
32 & -0.037748 & -0.2924 & 0.385496 \tabularnewline
33 & 0.121653 & 0.9423 & 0.174903 \tabularnewline
34 & -0.028344 & -0.2196 & 0.413483 \tabularnewline
35 & -0.103726 & -0.8035 & 0.212441 \tabularnewline
36 & 0.117169 & 0.9076 & 0.183864 \tabularnewline
\hline
\end{tabular}
%Source: https://freestatistics.org/blog/index.php?pk=63521&T=1

[TABLE]
[ROW][C]Autocorrelation Function[/C][/ROW]
[ROW][C]Time lag k[/C][C]ACF(k)[/C][C]T-STAT[/C][C]P-value[/C][/ROW]
[ROW][C]1[/C][C]-0.448013[/C][C]-3.4703[/C][C]0.000485[/C][/ROW]
[ROW][C]2[/C][C]-0.124402[/C][C]-0.9636[/C][C]0.169554[/C][/ROW]
[ROW][C]3[/C][C]0.18752[/C][C]1.4525[/C][C]0.075783[/C][/ROW]
[ROW][C]4[/C][C]-0.035481[/C][C]-0.2748[/C][C]0.392195[/C][/ROW]
[ROW][C]5[/C][C]-0.043086[/C][C]-0.3337[/C][C]0.369869[/C][/ROW]
[ROW][C]6[/C][C]-0.018807[/C][C]-0.1457[/C][C]0.442331[/C][/ROW]
[ROW][C]7[/C][C]0.042927[/C][C]0.3325[/C][C]0.370331[/C][/ROW]
[ROW][C]8[/C][C]-0.059967[/C][C]-0.4645[/C][C]0.321984[/C][/ROW]
[ROW][C]9[/C][C]-0.000513[/C][C]-0.004[/C][C]0.498423[/C][/ROW]
[ROW][C]10[/C][C]0.126388[/C][C]0.979[/C][C]0.165757[/C][/ROW]
[ROW][C]11[/C][C]-0.320704[/C][C]-2.4842[/C][C]0.007897[/C][/ROW]
[ROW][C]12[/C][C]0.320142[/C][C]2.4798[/C][C]0.007985[/C][/ROW]
[ROW][C]13[/C][C]-0.075754[/C][C]-0.5868[/C][C]0.279774[/C][/ROW]
[ROW][C]14[/C][C]-0.053673[/C][C]-0.4157[/C][C]0.339538[/C][/ROW]
[ROW][C]15[/C][C]0.029251[/C][C]0.2266[/C][C]0.410761[/C][/ROW]
[ROW][C]16[/C][C]-0.02206[/C][C]-0.1709[/C][C]0.432448[/C][/ROW]
[ROW][C]17[/C][C]-0.007282[/C][C]-0.0564[/C][C]0.477603[/C][/ROW]
[ROW][C]18[/C][C]0.007786[/C][C]0.0603[/C][C]0.476055[/C][/ROW]
[ROW][C]19[/C][C]-0.016[/C][C]-0.1239[/C][C]0.450891[/C][/ROW]
[ROW][C]20[/C][C]-0.088608[/C][C]-0.6864[/C][C]0.247566[/C][/ROW]
[ROW][C]21[/C][C]0.110786[/C][C]0.8581[/C][C]0.197113[/C][/ROW]
[ROW][C]22[/C][C]0.036071[/C][C]0.2794[/C][C]0.390447[/C][/ROW]
[ROW][C]23[/C][C]-0.157879[/C][C]-1.2229[/C][C]0.11307[/C][/ROW]
[ROW][C]24[/C][C]0.115362[/C][C]0.8936[/C][C]0.187556[/C][/ROW]
[ROW][C]25[/C][C]0.015081[/C][C]0.1168[/C][C]0.453699[/C][/ROW]
[ROW][C]26[/C][C]-0.018678[/C][C]-0.1447[/C][C]0.442725[/C][/ROW]
[ROW][C]27[/C][C]7.4e-05[/C][C]6e-04[/C][C]0.499771[/C][/ROW]
[ROW][C]28[/C][C]-0.023186[/C][C]-0.1796[/C][C]0.429038[/C][/ROW]
[ROW][C]29[/C][C]0.029795[/C][C]0.2308[/C][C]0.409131[/C][/ROW]
[ROW][C]30[/C][C]0.07299[/C][C]0.5654[/C][C]0.286962[/C][/ROW]
[ROW][C]31[/C][C]-0.104769[/C][C]-0.8115[/C][C]0.210133[/C][/ROW]
[ROW][C]32[/C][C]-0.037748[/C][C]-0.2924[/C][C]0.385496[/C][/ROW]
[ROW][C]33[/C][C]0.121653[/C][C]0.9423[/C][C]0.174903[/C][/ROW]
[ROW][C]34[/C][C]-0.028344[/C][C]-0.2196[/C][C]0.413483[/C][/ROW]
[ROW][C]35[/C][C]-0.103726[/C][C]-0.8035[/C][C]0.212441[/C][/ROW]
[ROW][C]36[/C][C]0.117169[/C][C]0.9076[/C][C]0.183864[/C][/ROW]
[/TABLE]
Source: https://freestatistics.org/blog/index.php?pk=63521&T=1

Globally Unique Identifier (entire table): ba.freestatistics.org/blog/index.php?pk=63521&T=1

As an alternative you can also use a QR Code:  

The GUIDs for individual cells are displayed in the table below:

Autocorrelation Function
Time lag kACF(k)T-STATP-value
1-0.448013-3.47030.000485
2-0.124402-0.96360.169554
30.187521.45250.075783
4-0.035481-0.27480.392195
5-0.043086-0.33370.369869
6-0.018807-0.14570.442331
70.0429270.33250.370331
8-0.059967-0.46450.321984
9-0.000513-0.0040.498423
100.1263880.9790.165757
11-0.320704-2.48420.007897
120.3201422.47980.007985
13-0.075754-0.58680.279774
14-0.053673-0.41570.339538
150.0292510.22660.410761
16-0.02206-0.17090.432448
17-0.007282-0.05640.477603
180.0077860.06030.476055
19-0.016-0.12390.450891
20-0.088608-0.68640.247566
210.1107860.85810.197113
220.0360710.27940.390447
23-0.157879-1.22290.11307
240.1153620.89360.187556
250.0150810.11680.453699
26-0.018678-0.14470.442725
277.4e-056e-040.499771
28-0.023186-0.17960.429038
290.0297950.23080.409131
300.072990.56540.286962
31-0.104769-0.81150.210133
32-0.037748-0.29240.385496
330.1216530.94230.174903
34-0.028344-0.21960.413483
35-0.103726-0.80350.212441
360.1171690.90760.183864


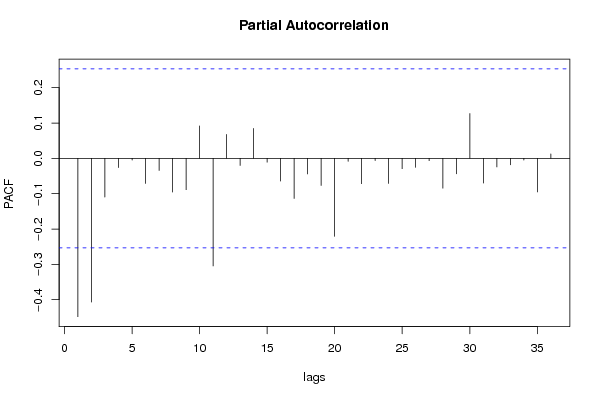
Partial Autocorrelation Function
Time lag kPACF(k)T-STATP-value
1-0.448013-3.47030.000485
2-0.406762-3.15080.00127
3-0.109617-0.84910.199603
4-0.026163-0.20270.420045
5-0.004737-0.03670.485425
6-0.071118-0.55090.291882
7-0.034075-0.26390.396364
8-0.095438-0.73930.231317
9-0.088735-0.68730.247258
100.0919020.71190.239651
11-0.304498-2.35860.010809
120.0678080.52520.300677
13-0.02008-0.15550.43846
140.0847930.65680.256908
15-0.01098-0.0850.466253
16-0.064429-0.49910.309779
17-0.113454-0.87880.191504
18-0.044192-0.34230.366658
19-0.076572-0.59310.277663
20-0.22081-1.71040.04618
21-0.008427-0.06530.474085
22-0.071876-0.55680.289884
23-0.006296-0.04880.480634
24-0.071089-0.55070.291959
25-0.029332-0.22720.410519
26-0.025351-0.19640.422493
27-0.006558-0.05080.479828
28-0.084288-0.65290.25816
29-0.043879-0.33990.367565
300.1267370.98170.165095
31-0.0699-0.54140.295102
32-0.024186-0.18730.426012
33-0.01815-0.14060.444333
34-0.004789-0.03710.485267
35-0.095155-0.73710.231976
360.0126610.09810.461101

\begin{tabular}{lllllllll}
\hline
Partial Autocorrelation Function \tabularnewline
Time lag k & PACF(k) & T-STAT & P-value \tabularnewline
1 & -0.448013 & -3.4703 & 0.000485 \tabularnewline
2 & -0.406762 & -3.1508 & 0.00127 \tabularnewline
3 & -0.109617 & -0.8491 & 0.199603 \tabularnewline
4 & -0.026163 & -0.2027 & 0.420045 \tabularnewline
5 & -0.004737 & -0.0367 & 0.485425 \tabularnewline
6 & -0.071118 & -0.5509 & 0.291882 \tabularnewline
7 & -0.034075 & -0.2639 & 0.396364 \tabularnewline
8 & -0.095438 & -0.7393 & 0.231317 \tabularnewline
9 & -0.088735 & -0.6873 & 0.247258 \tabularnewline
10 & 0.091902 & 0.7119 & 0.239651 \tabularnewline
11 & -0.304498 & -2.3586 & 0.010809 \tabularnewline
12 & 0.067808 & 0.5252 & 0.300677 \tabularnewline
13 & -0.02008 & -0.1555 & 0.43846 \tabularnewline
14 & 0.084793 & 0.6568 & 0.256908 \tabularnewline
15 & -0.01098 & -0.085 & 0.466253 \tabularnewline
16 & -0.064429 & -0.4991 & 0.309779 \tabularnewline
17 & -0.113454 & -0.8788 & 0.191504 \tabularnewline
18 & -0.044192 & -0.3423 & 0.366658 \tabularnewline
19 & -0.076572 & -0.5931 & 0.277663 \tabularnewline
20 & -0.22081 & -1.7104 & 0.04618 \tabularnewline
21 & -0.008427 & -0.0653 & 0.474085 \tabularnewline
22 & -0.071876 & -0.5568 & 0.289884 \tabularnewline
23 & -0.006296 & -0.0488 & 0.480634 \tabularnewline
24 & -0.071089 & -0.5507 & 0.291959 \tabularnewline
25 & -0.029332 & -0.2272 & 0.410519 \tabularnewline
26 & -0.025351 & -0.1964 & 0.422493 \tabularnewline
27 & -0.006558 & -0.0508 & 0.479828 \tabularnewline
28 & -0.084288 & -0.6529 & 0.25816 \tabularnewline
29 & -0.043879 & -0.3399 & 0.367565 \tabularnewline
30 & 0.126737 & 0.9817 & 0.165095 \tabularnewline
31 & -0.0699 & -0.5414 & 0.295102 \tabularnewline
32 & -0.024186 & -0.1873 & 0.426012 \tabularnewline
33 & -0.01815 & -0.1406 & 0.444333 \tabularnewline
34 & -0.004789 & -0.0371 & 0.485267 \tabularnewline
35 & -0.095155 & -0.7371 & 0.231976 \tabularnewline
36 & 0.012661 & 0.0981 & 0.461101 \tabularnewline
\hline
\end{tabular}
%Source: https://freestatistics.org/blog/index.php?pk=63521&T=2

[TABLE]
[ROW][C]Partial Autocorrelation Function[/C][/ROW]
[ROW][C]Time lag k[/C][C]PACF(k)[/C][C]T-STAT[/C][C]P-value[/C][/ROW]
[ROW][C]1[/C][C]-0.448013[/C][C]-3.4703[/C][C]0.000485[/C][/ROW]
[ROW][C]2[/C][C]-0.406762[/C][C]-3.1508[/C][C]0.00127[/C][/ROW]
[ROW][C]3[/C][C]-0.109617[/C][C]-0.8491[/C][C]0.199603[/C][/ROW]
[ROW][C]4[/C][C]-0.026163[/C][C]-0.2027[/C][C]0.420045[/C][/ROW]
[ROW][C]5[/C][C]-0.004737[/C][C]-0.0367[/C][C]0.485425[/C][/ROW]
[ROW][C]6[/C][C]-0.071118[/C][C]-0.5509[/C][C]0.291882[/C][/ROW]
[ROW][C]7[/C][C]-0.034075[/C][C]-0.2639[/C][C]0.396364[/C][/ROW]
[ROW][C]8[/C][C]-0.095438[/C][C]-0.7393[/C][C]0.231317[/C][/ROW]
[ROW][C]9[/C][C]-0.088735[/C][C]-0.6873[/C][C]0.247258[/C][/ROW]
[ROW][C]10[/C][C]0.091902[/C][C]0.7119[/C][C]0.239651[/C][/ROW]
[ROW][C]11[/C][C]-0.304498[/C][C]-2.3586[/C][C]0.010809[/C][/ROW]
[ROW][C]12[/C][C]0.067808[/C][C]0.5252[/C][C]0.300677[/C][/ROW]
[ROW][C]13[/C][C]-0.02008[/C][C]-0.1555[/C][C]0.43846[/C][/ROW]
[ROW][C]14[/C][C]0.084793[/C][C]0.6568[/C][C]0.256908[/C][/ROW]
[ROW][C]15[/C][C]-0.01098[/C][C]-0.085[/C][C]0.466253[/C][/ROW]
[ROW][C]16[/C][C]-0.064429[/C][C]-0.4991[/C][C]0.309779[/C][/ROW]
[ROW][C]17[/C][C]-0.113454[/C][C]-0.8788[/C][C]0.191504[/C][/ROW]
[ROW][C]18[/C][C]-0.044192[/C][C]-0.3423[/C][C]0.366658[/C][/ROW]
[ROW][C]19[/C][C]-0.076572[/C][C]-0.5931[/C][C]0.277663[/C][/ROW]
[ROW][C]20[/C][C]-0.22081[/C][C]-1.7104[/C][C]0.04618[/C][/ROW]
[ROW][C]21[/C][C]-0.008427[/C][C]-0.0653[/C][C]0.474085[/C][/ROW]
[ROW][C]22[/C][C]-0.071876[/C][C]-0.5568[/C][C]0.289884[/C][/ROW]
[ROW][C]23[/C][C]-0.006296[/C][C]-0.0488[/C][C]0.480634[/C][/ROW]
[ROW][C]24[/C][C]-0.071089[/C][C]-0.5507[/C][C]0.291959[/C][/ROW]
[ROW][C]25[/C][C]-0.029332[/C][C]-0.2272[/C][C]0.410519[/C][/ROW]
[ROW][C]26[/C][C]-0.025351[/C][C]-0.1964[/C][C]0.422493[/C][/ROW]
[ROW][C]27[/C][C]-0.006558[/C][C]-0.0508[/C][C]0.479828[/C][/ROW]
[ROW][C]28[/C][C]-0.084288[/C][C]-0.6529[/C][C]0.25816[/C][/ROW]
[ROW][C]29[/C][C]-0.043879[/C][C]-0.3399[/C][C]0.367565[/C][/ROW]
[ROW][C]30[/C][C]0.126737[/C][C]0.9817[/C][C]0.165095[/C][/ROW]
[ROW][C]31[/C][C]-0.0699[/C][C]-0.5414[/C][C]0.295102[/C][/ROW]
[ROW][C]32[/C][C]-0.024186[/C][C]-0.1873[/C][C]0.426012[/C][/ROW]
[ROW][C]33[/C][C]-0.01815[/C][C]-0.1406[/C][C]0.444333[/C][/ROW]
[ROW][C]34[/C][C]-0.004789[/C][C]-0.0371[/C][C]0.485267[/C][/ROW]
[ROW][C]35[/C][C]-0.095155[/C][C]-0.7371[/C][C]0.231976[/C][/ROW]
[ROW][C]36[/C][C]0.012661[/C][C]0.0981[/C][C]0.461101[/C][/ROW]
[/TABLE]
Source: https://freestatistics.org/blog/index.php?pk=63521&T=2

Globally Unique Identifier (entire table): ba.freestatistics.org/blog/index.php?pk=63521&T=2

As an alternative you can also use a QR Code:  

The GUIDs for individual cells are displayed in the table below:

Partial Autocorrelation Function
Time lag kPACF(k)T-STATP-value
1-0.448013-3.47030.000485
2-0.406762-3.15080.00127
3-0.109617-0.84910.199603
4-0.026163-0.20270.420045
5-0.004737-0.03670.485425
6-0.071118-0.55090.291882
7-0.034075-0.26390.396364
8-0.095438-0.73930.231317
9-0.088735-0.68730.247258
100.0919020.71190.239651
11-0.304498-2.35860.010809
120.0678080.52520.300677
13-0.02008-0.15550.43846
140.0847930.65680.256908
15-0.01098-0.0850.466253
16-0.064429-0.49910.309779
17-0.113454-0.87880.191504
18-0.044192-0.34230.366658
19-0.076572-0.59310.277663
20-0.22081-1.71040.04618
21-0.008427-0.06530.474085
22-0.071876-0.55680.289884
23-0.006296-0.04880.480634
24-0.071089-0.55070.291959
25-0.029332-0.22720.410519
26-0.025351-0.19640.422493
27-0.006558-0.05080.479828
28-0.084288-0.65290.25816
29-0.043879-0.33990.367565
300.1267370.98170.165095
31-0.0699-0.54140.295102
32-0.024186-0.18730.426012
33-0.01815-0.14060.444333
34-0.004789-0.03710.485267
35-0.095155-0.73710.231976
360.0126610.09810.461101


Parameters (Session):
par1 = 36 ; par2 = 1 ; par3 = 1 ; par4 = 0 ; par5 = 12 ; par6 = MA ; par7 = 0.95 ;
Parameters (R input):
par1 = 36 ; par2 = 1 ; par3 = 1 ; par4 = 0 ; par5 = 12 ; par6 = MA ; par7 = 0.95 ;
R code (references can be found in the software module):
if (par1 == 'Default') {
par1 = 10*log10(length(x))
} else {
par1 <- as.numeric(par1)
}
par2 <- as.numeric(par2)
par3 <- as.numeric(par3)
par4 <- as.numeric(par4)
par5 <- as.numeric(par5)
if (par6 == 'White Noise') par6 <- 'white' else par6 <- 'ma'
par7 <- as.numeric(par7)
if (par2 == 0) {
x <- log(x)
} else {
x <- (x ^ par2 - 1) / par2
}
if (par3 > 0) x <- diff(x,lag=1,difference=par3)
if (par4 > 0) x <- diff(x,lag=par5,difference=par4)
bitmap(file='pic1.png')
racf <- acf(x, par1, main='Autocorrelation', xlab='time lag', ylab='ACF', ci.type=par6, ci=par7, sub=paste('(lambda=',par2,', d=',par3,', D=',par4,', CI=', par7, ', CI type=',par6,')',sep=''))
dev.off()
bitmap(file='pic2.png')
rpacf <- pacf(x,par1,main='Partial Autocorrelation',xlab='lags',ylab='PACF')
dev.off()
(myacf <- c(racf$acf))
(mypacf <- c(rpacf$acf))
lengthx <- length(x)
sqrtn <- sqrt(lengthx)
load(file='createtable')
a<-table.start()
a<-table.row.start(a)
a<-table.element(a,'Autocorrelation Function',4,TRUE)
a<-table.row.end(a)
a<-table.row.start(a)
a<-table.element(a,'Time lag k',header=TRUE)
a<-table.element(a,hyperlink('basics.htm','ACF(k)','click here for more information about the Autocorrelation Function'),header=TRUE)
a<-table.element(a,'T-STAT',header=TRUE)
a<-table.element(a,'P-value',header=TRUE)
a<-table.row.end(a)
for (i in 2:(par1+1)) {
a<-table.row.start(a)
a<-table.element(a,i-1,header=TRUE)
a<-table.element(a,round(myacf[i],6))
mytstat <- myacf[i]*sqrtn
a<-table.element(a,round(mytstat,4))
a<-table.element(a,round(1-pt(abs(mytstat),lengthx),6))
a<-table.row.end(a)
}
a<-table.end(a)
table.save(a,file='mytable.tab')
a<-table.start()
a<-table.row.start(a)
a<-table.element(a,'Partial Autocorrelation Function',4,TRUE)
a<-table.row.end(a)
a<-table.row.start(a)
a<-table.element(a,'Time lag k',header=TRUE)
a<-table.element(a,hyperlink('basics.htm','PACF(k)','click here for more information about the Partial Autocorrelation Function'),header=TRUE)
a<-table.element(a,'T-STAT',header=TRUE)
a<-table.element(a,'P-value',header=TRUE)
a<-table.row.end(a)
for (i in 1:par1) {
a<-table.row.start(a)
a<-table.element(a,i,header=TRUE)
a<-table.element(a,round(mypacf[i],6))
mytstat <- mypacf[i]*sqrtn
a<-table.element(a,round(mytstat,4))
a<-table.element(a,round(1-pt(abs(mytstat),lengthx),6))
a<-table.row.end(a)
}
a<-table.end(a)
table.save(a,file='mytable1.tab')