Free Statistics

of Irreproducible Research!

Author's title

Author*The author of this computation has been verified*
R Software Modulerwasp_autocorrelation.wasp
Title produced by software(Partial) Autocorrelation Function
Date of computationFri, 04 Dec 2009 07:01:50 -0700
Cite this page as followsStatistical Computations at FreeStatistics.org, Office for Research Development and Education, URL https://freestatistics.org/blog/index.php?v=date/2009/Dec/04/t12599353882v3dyazm6j7hbeq.htm/, Retrieved Sun, 28 Apr 2024 00:44:45 +0000
Statistical Computations at FreeStatistics.org, Office for Research Development and Education, URL https://freestatistics.org/blog/index.php?pk=63540, Retrieved Sun, 28 Apr 2024 00:44:45 +0000
QR Codes:

Original text written by user:
IsPrivate?No (this computation is public)
User-defined keywords
Estimated Impact106
Family? (F = Feedback message, R = changed R code, M = changed R Module, P = changed Parameters, D = changed Data)
-     [Univariate Data Series] [data set] [2008-12-01 19:54:57] [b98453cac15ba1066b407e146608df68]
- RMP   [(Partial) Autocorrelation Function] [] [2009-11-27 14:46:03] [b98453cac15ba1066b407e146608df68]
- R PD    [(Partial) Autocorrelation Function] [] [2009-12-03 19:32:52] [325e037ef8beb77178124dff9c2e015a]
-   P         [(Partial) Autocorrelation Function] [] [2009-12-04 14:01:50] [ed082d38031561faed979d8cebfeba4d] [Current]
Feedback Forum

Post a new message
Dataseries X:
1915
1843
1761
2858
3968
5061
4661
4269
3857
3568
3274
2987
1683
1381
1071
2772
4485
6181
5479
4782
4067
3489
2903
2330
1736
1483
1242
2334
3423
4523
3986
3462
2908
2575
2237
1904
1610
1251
941
2450
3946
5409
4741
4069
3539
3189
2960
2704
1697
1598
1456
2316
3083
4158
3469
2892
2578
2233
1947
2049


Summary of computational transaction
Raw Inputview raw input (R code)
Raw Outputview raw output of R engine
Computing time0 seconds
R Server'Gwilym Jenkins' @ 72.249.127.135

\begin{tabular}{lllllllll}
\hline
Summary of computational transaction \tabularnewline
Raw Input & view raw input (R code)  \tabularnewline
Raw Output & view raw output of R engine  \tabularnewline
Computing time & 0 seconds \tabularnewline
R Server & 'Gwilym Jenkins' @ 72.249.127.135 \tabularnewline
\hline
\end{tabular}
%Source: https://freestatistics.org/blog/index.php?pk=63540&T=0

[TABLE]
[ROW][C]Summary of computational transaction[/C][/ROW]
[ROW][C]Raw Input[/C][C]view raw input (R code) [/C][/ROW]
[ROW][C]Raw Output[/C][C]view raw output of R engine [/C][/ROW]
[ROW][C]Computing time[/C][C]0 seconds[/C][/ROW]
[ROW][C]R Server[/C][C]'Gwilym Jenkins' @ 72.249.127.135[/C][/ROW]
[/TABLE]
Source: https://freestatistics.org/blog/index.php?pk=63540&T=0

Globally Unique Identifier (entire table): ba.freestatistics.org/blog/index.php?pk=63540&T=0

As an alternative you can also use a QR Code:  

The GUIDs for individual cells are displayed in the table below:

Summary of computational transaction
Raw Inputview raw input (R code)
Raw Outputview raw output of R engine
Computing time0 seconds
R Server'Gwilym Jenkins' @ 72.249.127.135


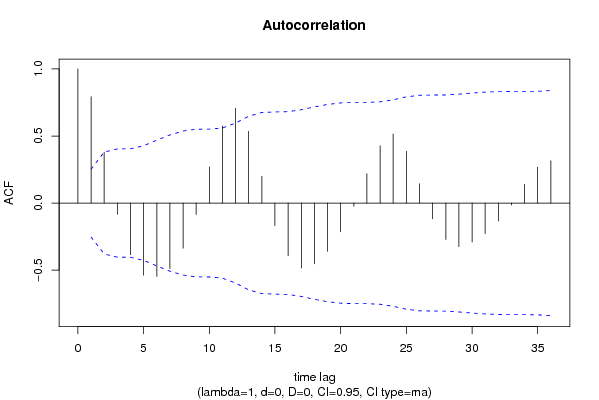
Autocorrelation Function
Time lag kACF(k)T-STATP-value
10.7927976.1410
20.3772362.92210.002448
3-0.083682-0.64820.259666
4-0.384775-2.98050.002076
5-0.537663-4.16475.1e-05
6-0.547582-4.24163.9e-05
7-0.488893-3.7870.000178
8-0.336388-2.60570.005774
9-0.085189-0.65990.255931
100.2695532.08790.020528
110.5743184.44861.9e-05
120.7071415.47750
130.5350694.14465.4e-05
140.199651.54650.063624
15-0.167692-1.29890.099467
16-0.392911-3.04350.001734
17-0.485046-3.75710.000196
18-0.452695-3.50660.000433
19-0.359727-2.78640.003562
20-0.214609-1.66240.050829
21-0.024096-0.18660.426285
220.2190541.69680.04746
230.4272073.30910.000793
240.5140393.98179.4e-05
250.3859862.98980.002022
260.143951.1150.134641
27-0.117813-0.91260.182559
28-0.270987-2.09910.020014
29-0.324844-2.51620.007277
30-0.290696-2.25170.014006
31-0.227219-1.760.04175
32-0.134626-1.04280.150611
33-0.014719-0.1140.454805
340.1396981.08210.14177
350.267252.07010.021377
360.3153392.44260.008772

\begin{tabular}{lllllllll}
\hline
Autocorrelation Function \tabularnewline
Time lag k & ACF(k) & T-STAT & P-value \tabularnewline
1 & 0.792797 & 6.141 & 0 \tabularnewline
2 & 0.377236 & 2.9221 & 0.002448 \tabularnewline
3 & -0.083682 & -0.6482 & 0.259666 \tabularnewline
4 & -0.384775 & -2.9805 & 0.002076 \tabularnewline
5 & -0.537663 & -4.1647 & 5.1e-05 \tabularnewline
6 & -0.547582 & -4.2416 & 3.9e-05 \tabularnewline
7 & -0.488893 & -3.787 & 0.000178 \tabularnewline
8 & -0.336388 & -2.6057 & 0.005774 \tabularnewline
9 & -0.085189 & -0.6599 & 0.255931 \tabularnewline
10 & 0.269553 & 2.0879 & 0.020528 \tabularnewline
11 & 0.574318 & 4.4486 & 1.9e-05 \tabularnewline
12 & 0.707141 & 5.4775 & 0 \tabularnewline
13 & 0.535069 & 4.1446 & 5.4e-05 \tabularnewline
14 & 0.19965 & 1.5465 & 0.063624 \tabularnewline
15 & -0.167692 & -1.2989 & 0.099467 \tabularnewline
16 & -0.392911 & -3.0435 & 0.001734 \tabularnewline
17 & -0.485046 & -3.7571 & 0.000196 \tabularnewline
18 & -0.452695 & -3.5066 & 0.000433 \tabularnewline
19 & -0.359727 & -2.7864 & 0.003562 \tabularnewline
20 & -0.214609 & -1.6624 & 0.050829 \tabularnewline
21 & -0.024096 & -0.1866 & 0.426285 \tabularnewline
22 & 0.219054 & 1.6968 & 0.04746 \tabularnewline
23 & 0.427207 & 3.3091 & 0.000793 \tabularnewline
24 & 0.514039 & 3.9817 & 9.4e-05 \tabularnewline
25 & 0.385986 & 2.9898 & 0.002022 \tabularnewline
26 & 0.14395 & 1.115 & 0.134641 \tabularnewline
27 & -0.117813 & -0.9126 & 0.182559 \tabularnewline
28 & -0.270987 & -2.0991 & 0.020014 \tabularnewline
29 & -0.324844 & -2.5162 & 0.007277 \tabularnewline
30 & -0.290696 & -2.2517 & 0.014006 \tabularnewline
31 & -0.227219 & -1.76 & 0.04175 \tabularnewline
32 & -0.134626 & -1.0428 & 0.150611 \tabularnewline
33 & -0.014719 & -0.114 & 0.454805 \tabularnewline
34 & 0.139698 & 1.0821 & 0.14177 \tabularnewline
35 & 0.26725 & 2.0701 & 0.021377 \tabularnewline
36 & 0.315339 & 2.4426 & 0.008772 \tabularnewline
\hline
\end{tabular}
%Source: https://freestatistics.org/blog/index.php?pk=63540&T=1

[TABLE]
[ROW][C]Autocorrelation Function[/C][/ROW]
[ROW][C]Time lag k[/C][C]ACF(k)[/C][C]T-STAT[/C][C]P-value[/C][/ROW]
[ROW][C]1[/C][C]0.792797[/C][C]6.141[/C][C]0[/C][/ROW]
[ROW][C]2[/C][C]0.377236[/C][C]2.9221[/C][C]0.002448[/C][/ROW]
[ROW][C]3[/C][C]-0.083682[/C][C]-0.6482[/C][C]0.259666[/C][/ROW]
[ROW][C]4[/C][C]-0.384775[/C][C]-2.9805[/C][C]0.002076[/C][/ROW]
[ROW][C]5[/C][C]-0.537663[/C][C]-4.1647[/C][C]5.1e-05[/C][/ROW]
[ROW][C]6[/C][C]-0.547582[/C][C]-4.2416[/C][C]3.9e-05[/C][/ROW]
[ROW][C]7[/C][C]-0.488893[/C][C]-3.787[/C][C]0.000178[/C][/ROW]
[ROW][C]8[/C][C]-0.336388[/C][C]-2.6057[/C][C]0.005774[/C][/ROW]
[ROW][C]9[/C][C]-0.085189[/C][C]-0.6599[/C][C]0.255931[/C][/ROW]
[ROW][C]10[/C][C]0.269553[/C][C]2.0879[/C][C]0.020528[/C][/ROW]
[ROW][C]11[/C][C]0.574318[/C][C]4.4486[/C][C]1.9e-05[/C][/ROW]
[ROW][C]12[/C][C]0.707141[/C][C]5.4775[/C][C]0[/C][/ROW]
[ROW][C]13[/C][C]0.535069[/C][C]4.1446[/C][C]5.4e-05[/C][/ROW]
[ROW][C]14[/C][C]0.19965[/C][C]1.5465[/C][C]0.063624[/C][/ROW]
[ROW][C]15[/C][C]-0.167692[/C][C]-1.2989[/C][C]0.099467[/C][/ROW]
[ROW][C]16[/C][C]-0.392911[/C][C]-3.0435[/C][C]0.001734[/C][/ROW]
[ROW][C]17[/C][C]-0.485046[/C][C]-3.7571[/C][C]0.000196[/C][/ROW]
[ROW][C]18[/C][C]-0.452695[/C][C]-3.5066[/C][C]0.000433[/C][/ROW]
[ROW][C]19[/C][C]-0.359727[/C][C]-2.7864[/C][C]0.003562[/C][/ROW]
[ROW][C]20[/C][C]-0.214609[/C][C]-1.6624[/C][C]0.050829[/C][/ROW]
[ROW][C]21[/C][C]-0.024096[/C][C]-0.1866[/C][C]0.426285[/C][/ROW]
[ROW][C]22[/C][C]0.219054[/C][C]1.6968[/C][C]0.04746[/C][/ROW]
[ROW][C]23[/C][C]0.427207[/C][C]3.3091[/C][C]0.000793[/C][/ROW]
[ROW][C]24[/C][C]0.514039[/C][C]3.9817[/C][C]9.4e-05[/C][/ROW]
[ROW][C]25[/C][C]0.385986[/C][C]2.9898[/C][C]0.002022[/C][/ROW]
[ROW][C]26[/C][C]0.14395[/C][C]1.115[/C][C]0.134641[/C][/ROW]
[ROW][C]27[/C][C]-0.117813[/C][C]-0.9126[/C][C]0.182559[/C][/ROW]
[ROW][C]28[/C][C]-0.270987[/C][C]-2.0991[/C][C]0.020014[/C][/ROW]
[ROW][C]29[/C][C]-0.324844[/C][C]-2.5162[/C][C]0.007277[/C][/ROW]
[ROW][C]30[/C][C]-0.290696[/C][C]-2.2517[/C][C]0.014006[/C][/ROW]
[ROW][C]31[/C][C]-0.227219[/C][C]-1.76[/C][C]0.04175[/C][/ROW]
[ROW][C]32[/C][C]-0.134626[/C][C]-1.0428[/C][C]0.150611[/C][/ROW]
[ROW][C]33[/C][C]-0.014719[/C][C]-0.114[/C][C]0.454805[/C][/ROW]
[ROW][C]34[/C][C]0.139698[/C][C]1.0821[/C][C]0.14177[/C][/ROW]
[ROW][C]35[/C][C]0.26725[/C][C]2.0701[/C][C]0.021377[/C][/ROW]
[ROW][C]36[/C][C]0.315339[/C][C]2.4426[/C][C]0.008772[/C][/ROW]
[/TABLE]
Source: https://freestatistics.org/blog/index.php?pk=63540&T=1

Globally Unique Identifier (entire table): ba.freestatistics.org/blog/index.php?pk=63540&T=1

As an alternative you can also use a QR Code:  

The GUIDs for individual cells are displayed in the table below:

Autocorrelation Function
Time lag kACF(k)T-STATP-value
10.7927976.1410
20.3772362.92210.002448
3-0.083682-0.64820.259666
4-0.384775-2.98050.002076
5-0.537663-4.16475.1e-05
6-0.547582-4.24163.9e-05
7-0.488893-3.7870.000178
8-0.336388-2.60570.005774
9-0.085189-0.65990.255931
100.2695532.08790.020528
110.5743184.44861.9e-05
120.7071415.47750
130.5350694.14465.4e-05
140.199651.54650.063624
15-0.167692-1.29890.099467
16-0.392911-3.04350.001734
17-0.485046-3.75710.000196
18-0.452695-3.50660.000433
19-0.359727-2.78640.003562
20-0.214609-1.66240.050829
21-0.024096-0.18660.426285
220.2190541.69680.04746
230.4272073.30910.000793
240.5140393.98179.4e-05
250.3859862.98980.002022
260.143951.1150.134641
27-0.117813-0.91260.182559
28-0.270987-2.09910.020014
29-0.324844-2.51620.007277
30-0.290696-2.25170.014006
31-0.227219-1.760.04175
32-0.134626-1.04280.150611
33-0.014719-0.1140.454805
340.1396981.08210.14177
350.267252.07010.021377
360.3153392.44260.008772


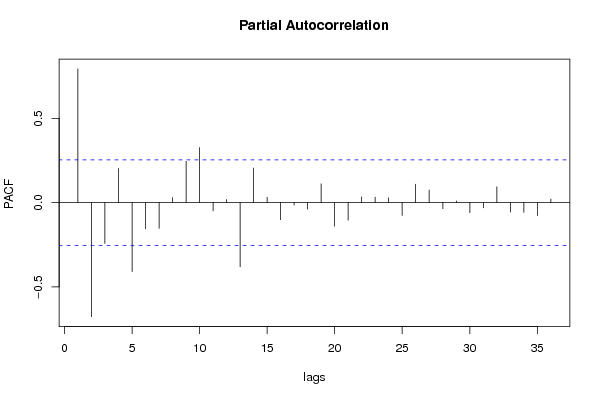
Partial Autocorrelation Function
Time lag kPACF(k)T-STATP-value
10.7927976.1410
2-0.676475-5.241e-06
3-0.242009-1.87460.032859
40.2027711.57070.060761
5-0.408825-3.16670.001212
6-0.155148-1.20180.117087
7-0.15228-1.17960.121417
80.0299070.23170.408797
90.2450171.89790.031262
100.32622.52670.007084
11-0.049124-0.38050.352454
120.0188290.14590.442263
13-0.380611-2.94820.002274
140.2049251.58730.058846
150.0316250.2450.40366
16-0.100986-0.78220.218576
17-0.014604-0.11310.455154
18-0.0386-0.2990.382989
190.1112470.86170.196137
20-0.139968-1.08420.141309
21-0.104379-0.80850.210995
220.0334540.25910.39821
230.0318460.24670.402999
240.0286340.22180.412612
25-0.076462-0.59230.277946
260.1089460.84390.20104
270.0746660.57840.282592
28-0.036268-0.28090.389865
290.0098350.07620.469765
30-0.05973-0.46270.322639
31-0.030921-0.23950.405761
320.0937630.72630.235245
33-0.056442-0.43720.33177
34-0.057684-0.44680.328309
35-0.077183-0.59790.276092
360.0210850.16330.435407

\begin{tabular}{lllllllll}
\hline
Partial Autocorrelation Function \tabularnewline
Time lag k & PACF(k) & T-STAT & P-value \tabularnewline
1 & 0.792797 & 6.141 & 0 \tabularnewline
2 & -0.676475 & -5.24 & 1e-06 \tabularnewline
3 & -0.242009 & -1.8746 & 0.032859 \tabularnewline
4 & 0.202771 & 1.5707 & 0.060761 \tabularnewline
5 & -0.408825 & -3.1667 & 0.001212 \tabularnewline
6 & -0.155148 & -1.2018 & 0.117087 \tabularnewline
7 & -0.15228 & -1.1796 & 0.121417 \tabularnewline
8 & 0.029907 & 0.2317 & 0.408797 \tabularnewline
9 & 0.245017 & 1.8979 & 0.031262 \tabularnewline
10 & 0.3262 & 2.5267 & 0.007084 \tabularnewline
11 & -0.049124 & -0.3805 & 0.352454 \tabularnewline
12 & 0.018829 & 0.1459 & 0.442263 \tabularnewline
13 & -0.380611 & -2.9482 & 0.002274 \tabularnewline
14 & 0.204925 & 1.5873 & 0.058846 \tabularnewline
15 & 0.031625 & 0.245 & 0.40366 \tabularnewline
16 & -0.100986 & -0.7822 & 0.218576 \tabularnewline
17 & -0.014604 & -0.1131 & 0.455154 \tabularnewline
18 & -0.0386 & -0.299 & 0.382989 \tabularnewline
19 & 0.111247 & 0.8617 & 0.196137 \tabularnewline
20 & -0.139968 & -1.0842 & 0.141309 \tabularnewline
21 & -0.104379 & -0.8085 & 0.210995 \tabularnewline
22 & 0.033454 & 0.2591 & 0.39821 \tabularnewline
23 & 0.031846 & 0.2467 & 0.402999 \tabularnewline
24 & 0.028634 & 0.2218 & 0.412612 \tabularnewline
25 & -0.076462 & -0.5923 & 0.277946 \tabularnewline
26 & 0.108946 & 0.8439 & 0.20104 \tabularnewline
27 & 0.074666 & 0.5784 & 0.282592 \tabularnewline
28 & -0.036268 & -0.2809 & 0.389865 \tabularnewline
29 & 0.009835 & 0.0762 & 0.469765 \tabularnewline
30 & -0.05973 & -0.4627 & 0.322639 \tabularnewline
31 & -0.030921 & -0.2395 & 0.405761 \tabularnewline
32 & 0.093763 & 0.7263 & 0.235245 \tabularnewline
33 & -0.056442 & -0.4372 & 0.33177 \tabularnewline
34 & -0.057684 & -0.4468 & 0.328309 \tabularnewline
35 & -0.077183 & -0.5979 & 0.276092 \tabularnewline
36 & 0.021085 & 0.1633 & 0.435407 \tabularnewline
\hline
\end{tabular}
%Source: https://freestatistics.org/blog/index.php?pk=63540&T=2

[TABLE]
[ROW][C]Partial Autocorrelation Function[/C][/ROW]
[ROW][C]Time lag k[/C][C]PACF(k)[/C][C]T-STAT[/C][C]P-value[/C][/ROW]
[ROW][C]1[/C][C]0.792797[/C][C]6.141[/C][C]0[/C][/ROW]
[ROW][C]2[/C][C]-0.676475[/C][C]-5.24[/C][C]1e-06[/C][/ROW]
[ROW][C]3[/C][C]-0.242009[/C][C]-1.8746[/C][C]0.032859[/C][/ROW]
[ROW][C]4[/C][C]0.202771[/C][C]1.5707[/C][C]0.060761[/C][/ROW]
[ROW][C]5[/C][C]-0.408825[/C][C]-3.1667[/C][C]0.001212[/C][/ROW]
[ROW][C]6[/C][C]-0.155148[/C][C]-1.2018[/C][C]0.117087[/C][/ROW]
[ROW][C]7[/C][C]-0.15228[/C][C]-1.1796[/C][C]0.121417[/C][/ROW]
[ROW][C]8[/C][C]0.029907[/C][C]0.2317[/C][C]0.408797[/C][/ROW]
[ROW][C]9[/C][C]0.245017[/C][C]1.8979[/C][C]0.031262[/C][/ROW]
[ROW][C]10[/C][C]0.3262[/C][C]2.5267[/C][C]0.007084[/C][/ROW]
[ROW][C]11[/C][C]-0.049124[/C][C]-0.3805[/C][C]0.352454[/C][/ROW]
[ROW][C]12[/C][C]0.018829[/C][C]0.1459[/C][C]0.442263[/C][/ROW]
[ROW][C]13[/C][C]-0.380611[/C][C]-2.9482[/C][C]0.002274[/C][/ROW]
[ROW][C]14[/C][C]0.204925[/C][C]1.5873[/C][C]0.058846[/C][/ROW]
[ROW][C]15[/C][C]0.031625[/C][C]0.245[/C][C]0.40366[/C][/ROW]
[ROW][C]16[/C][C]-0.100986[/C][C]-0.7822[/C][C]0.218576[/C][/ROW]
[ROW][C]17[/C][C]-0.014604[/C][C]-0.1131[/C][C]0.455154[/C][/ROW]
[ROW][C]18[/C][C]-0.0386[/C][C]-0.299[/C][C]0.382989[/C][/ROW]
[ROW][C]19[/C][C]0.111247[/C][C]0.8617[/C][C]0.196137[/C][/ROW]
[ROW][C]20[/C][C]-0.139968[/C][C]-1.0842[/C][C]0.141309[/C][/ROW]
[ROW][C]21[/C][C]-0.104379[/C][C]-0.8085[/C][C]0.210995[/C][/ROW]
[ROW][C]22[/C][C]0.033454[/C][C]0.2591[/C][C]0.39821[/C][/ROW]
[ROW][C]23[/C][C]0.031846[/C][C]0.2467[/C][C]0.402999[/C][/ROW]
[ROW][C]24[/C][C]0.028634[/C][C]0.2218[/C][C]0.412612[/C][/ROW]
[ROW][C]25[/C][C]-0.076462[/C][C]-0.5923[/C][C]0.277946[/C][/ROW]
[ROW][C]26[/C][C]0.108946[/C][C]0.8439[/C][C]0.20104[/C][/ROW]
[ROW][C]27[/C][C]0.074666[/C][C]0.5784[/C][C]0.282592[/C][/ROW]
[ROW][C]28[/C][C]-0.036268[/C][C]-0.2809[/C][C]0.389865[/C][/ROW]
[ROW][C]29[/C][C]0.009835[/C][C]0.0762[/C][C]0.469765[/C][/ROW]
[ROW][C]30[/C][C]-0.05973[/C][C]-0.4627[/C][C]0.322639[/C][/ROW]
[ROW][C]31[/C][C]-0.030921[/C][C]-0.2395[/C][C]0.405761[/C][/ROW]
[ROW][C]32[/C][C]0.093763[/C][C]0.7263[/C][C]0.235245[/C][/ROW]
[ROW][C]33[/C][C]-0.056442[/C][C]-0.4372[/C][C]0.33177[/C][/ROW]
[ROW][C]34[/C][C]-0.057684[/C][C]-0.4468[/C][C]0.328309[/C][/ROW]
[ROW][C]35[/C][C]-0.077183[/C][C]-0.5979[/C][C]0.276092[/C][/ROW]
[ROW][C]36[/C][C]0.021085[/C][C]0.1633[/C][C]0.435407[/C][/ROW]
[/TABLE]
Source: https://freestatistics.org/blog/index.php?pk=63540&T=2

Globally Unique Identifier (entire table): ba.freestatistics.org/blog/index.php?pk=63540&T=2

As an alternative you can also use a QR Code:  

The GUIDs for individual cells are displayed in the table below:

Partial Autocorrelation Function
Time lag kPACF(k)T-STATP-value
10.7927976.1410
2-0.676475-5.241e-06
3-0.242009-1.87460.032859
40.2027711.57070.060761
5-0.408825-3.16670.001212
6-0.155148-1.20180.117087
7-0.15228-1.17960.121417
80.0299070.23170.408797
90.2450171.89790.031262
100.32622.52670.007084
11-0.049124-0.38050.352454
120.0188290.14590.442263
13-0.380611-2.94820.002274
140.2049251.58730.058846
150.0316250.2450.40366
16-0.100986-0.78220.218576
17-0.014604-0.11310.455154
18-0.0386-0.2990.382989
190.1112470.86170.196137
20-0.139968-1.08420.141309
21-0.104379-0.80850.210995
220.0334540.25910.39821
230.0318460.24670.402999
240.0286340.22180.412612
25-0.076462-0.59230.277946
260.1089460.84390.20104
270.0746660.57840.282592
28-0.036268-0.28090.389865
290.0098350.07620.469765
30-0.05973-0.46270.322639
31-0.030921-0.23950.405761
320.0937630.72630.235245
33-0.056442-0.43720.33177
34-0.057684-0.44680.328309
35-0.077183-0.59790.276092
360.0210850.16330.435407


Parameters (Session):
par1 = 36 ; par2 = 1 ; par3 = 0 ; par4 = 0 ; par5 = 12 ; par6 = MA ; par7 = 0.95 ;
Parameters (R input):
par1 = 36 ; par2 = 1 ; par3 = 0 ; par4 = 0 ; par5 = 12 ; par6 = MA ; par7 = 0.95 ;
R code (references can be found in the software module):
if (par1 == 'Default') {
par1 = 10*log10(length(x))
} else {
par1 <- as.numeric(par1)
}
par2 <- as.numeric(par2)
par3 <- as.numeric(par3)
par4 <- as.numeric(par4)
par5 <- as.numeric(par5)
if (par6 == 'White Noise') par6 <- 'white' else par6 <- 'ma'
par7 <- as.numeric(par7)
if (par2 == 0) {
x <- log(x)
} else {
x <- (x ^ par2 - 1) / par2
}
if (par3 > 0) x <- diff(x,lag=1,difference=par3)
if (par4 > 0) x <- diff(x,lag=par5,difference=par4)
bitmap(file='pic1.png')
racf <- acf(x, par1, main='Autocorrelation', xlab='time lag', ylab='ACF', ci.type=par6, ci=par7, sub=paste('(lambda=',par2,', d=',par3,', D=',par4,', CI=', par7, ', CI type=',par6,')',sep=''))
dev.off()
bitmap(file='pic2.png')
rpacf <- pacf(x,par1,main='Partial Autocorrelation',xlab='lags',ylab='PACF')
dev.off()
(myacf <- c(racf$acf))
(mypacf <- c(rpacf$acf))
lengthx <- length(x)
sqrtn <- sqrt(lengthx)
load(file='createtable')
a<-table.start()
a<-table.row.start(a)
a<-table.element(a,'Autocorrelation Function',4,TRUE)
a<-table.row.end(a)
a<-table.row.start(a)
a<-table.element(a,'Time lag k',header=TRUE)
a<-table.element(a,hyperlink('basics.htm','ACF(k)','click here for more information about the Autocorrelation Function'),header=TRUE)
a<-table.element(a,'T-STAT',header=TRUE)
a<-table.element(a,'P-value',header=TRUE)
a<-table.row.end(a)
for (i in 2:(par1+1)) {
a<-table.row.start(a)
a<-table.element(a,i-1,header=TRUE)
a<-table.element(a,round(myacf[i],6))
mytstat <- myacf[i]*sqrtn
a<-table.element(a,round(mytstat,4))
a<-table.element(a,round(1-pt(abs(mytstat),lengthx),6))
a<-table.row.end(a)
}
a<-table.end(a)
table.save(a,file='mytable.tab')
a<-table.start()
a<-table.row.start(a)
a<-table.element(a,'Partial Autocorrelation Function',4,TRUE)
a<-table.row.end(a)
a<-table.row.start(a)
a<-table.element(a,'Time lag k',header=TRUE)
a<-table.element(a,hyperlink('basics.htm','PACF(k)','click here for more information about the Partial Autocorrelation Function'),header=TRUE)
a<-table.element(a,'T-STAT',header=TRUE)
a<-table.element(a,'P-value',header=TRUE)
a<-table.row.end(a)
for (i in 1:par1) {
a<-table.row.start(a)
a<-table.element(a,i,header=TRUE)
a<-table.element(a,round(mypacf[i],6))
mytstat <- mypacf[i]*sqrtn
a<-table.element(a,round(mytstat,4))
a<-table.element(a,round(1-pt(abs(mytstat),lengthx),6))
a<-table.row.end(a)
}
a<-table.end(a)
table.save(a,file='mytable1.tab')