Free Statistics

of Irreproducible Research!

Author's title

Author*The author of this computation has been verified*
R Software Modulerwasp_autocorrelation.wasp
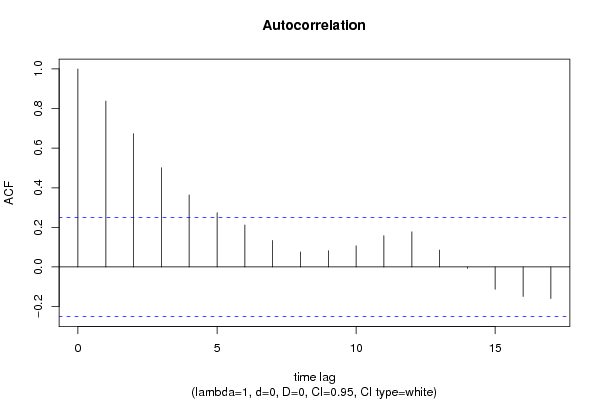
Title produced by software(Partial) Autocorrelation Function
Date of computationFri, 04 Dec 2009 07:07:17 -0700
Cite this page as followsStatistical Computations at FreeStatistics.org, Office for Research Development and Education, URL https://freestatistics.org/blog/index.php?v=date/2009/Dec/04/t12599356869osll0yn4f844u1.htm/, Retrieved Sun, 28 Apr 2024 17:46:20 +0000
Statistical Computations at FreeStatistics.org, Office for Research Development and Education, URL https://freestatistics.org/blog/index.php?pk=63555, Retrieved Sun, 28 Apr 2024 17:46:20 +0000
QR Codes:

Original text written by user:
IsPrivate?No (this computation is public)
User-defined keywords
Estimated Impact104
Family? (F = Feedback message, R = changed R code, M = changed R Module, P = changed Parameters, D = changed Data)
-     [Univariate Data Series] [data set] [2008-12-01 19:54:57] [b98453cac15ba1066b407e146608df68]
- RMP   [Standard Deviation-Mean Plot] [] [2009-11-27 14:40:44] [b98453cac15ba1066b407e146608df68]
F RMPD      [(Partial) Autocorrelation Function] [ws9 1] [2009-12-04 14:07:17] [84778c3520b84fd5786bccf2e25a5aef] [Current]
Feedback Forum
2009-12-10 16:51:04 [Brecht Thijs] [reply
De opdracht moet starten met het inschatten van de lambda
waarde. Dit doe je door middel van de Standard Deviation Mean Plo
SMP:
http://www.freestatistics.org/blog/index.php?v=date/2009/Dec/10/t1260463665nzm0qe4cy3q1r0t.htm/

De eerste tabel geeft een p-waarde van 0,72. We nemen de Ho dus aan
er is geen transformatie nodig en lambda blijft 1.

Post a new message
Dataseries X:
29.837
29.571
30.167
30.524
30.996
31.033
31.198
30.937
31.649
33.115
34.106
33.926
33.382
32.851
32.948
36.112
36.113
35.210
35.193
34.383
35.349
37.058
38.076
36.630
36.045
35.638
35.114
35.465
35.254
35.299
35.916
36.683
37.288
38.536
38.977
36.407
34.955
34.951
32.680
34.791
34.178
35.213
34.871
35.299
35.443
37.108
36.419
34.471
33.868
34.385
33.643
34.627
32.919
35.500
36.110
37.086
37.711
40.427
39.884
38.512
38.767


Summary of computational transaction
Raw Inputview raw input (R code)
Raw Outputview raw output of R engine
Computing time0 seconds
R Server'Gwilym Jenkins' @ 72.249.127.135

\begin{tabular}{lllllllll}
\hline
Summary of computational transaction \tabularnewline
Raw Input & view raw input (R code)  \tabularnewline
Raw Output & view raw output of R engine  \tabularnewline
Computing time & 0 seconds \tabularnewline
R Server & 'Gwilym Jenkins' @ 72.249.127.135 \tabularnewline
\hline
\end{tabular}
%Source: https://freestatistics.org/blog/index.php?pk=63555&T=0

[TABLE]
[ROW][C]Summary of computational transaction[/C][/ROW]
[ROW][C]Raw Input[/C][C]view raw input (R code) [/C][/ROW]
[ROW][C]Raw Output[/C][C]view raw output of R engine [/C][/ROW]
[ROW][C]Computing time[/C][C]0 seconds[/C][/ROW]
[ROW][C]R Server[/C][C]'Gwilym Jenkins' @ 72.249.127.135[/C][/ROW]
[/TABLE]
Source: https://freestatistics.org/blog/index.php?pk=63555&T=0

Globally Unique Identifier (entire table): ba.freestatistics.org/blog/index.php?pk=63555&T=0

As an alternative you can also use a QR Code:  

The GUIDs for individual cells are displayed in the table below:

Summary of computational transaction
Raw Inputview raw input (R code)
Raw Outputview raw output of R engine
Computing time0 seconds
R Server'Gwilym Jenkins' @ 72.249.127.135


Autocorrelation Function
Time lag kACF(k)T-STATP-value
10.8375976.54180
20.6730925.2571e-06
30.5010663.91350.000116
40.3638052.84140.003049
50.2742262.14180.018107
60.2122871.6580.051224
70.1339861.04650.149738
80.0756980.59120.278278
90.0823920.64350.261156
100.1070760.83630.203129
110.1578051.23250.111246
120.1773051.38480.08558
130.0856010.66860.253148
14-0.007776-0.06070.475886
15-0.112866-0.88150.19075
16-0.148918-1.16310.124663
17-0.159735-1.24760.108479

\begin{tabular}{lllllllll}
\hline
Autocorrelation Function \tabularnewline
Time lag k & ACF(k) & T-STAT & P-value \tabularnewline
1 & 0.837597 & 6.5418 & 0 \tabularnewline
2 & 0.673092 & 5.257 & 1e-06 \tabularnewline
3 & 0.501066 & 3.9135 & 0.000116 \tabularnewline
4 & 0.363805 & 2.8414 & 0.003049 \tabularnewline
5 & 0.274226 & 2.1418 & 0.018107 \tabularnewline
6 & 0.212287 & 1.658 & 0.051224 \tabularnewline
7 & 0.133986 & 1.0465 & 0.149738 \tabularnewline
8 & 0.075698 & 0.5912 & 0.278278 \tabularnewline
9 & 0.082392 & 0.6435 & 0.261156 \tabularnewline
10 & 0.107076 & 0.8363 & 0.203129 \tabularnewline
11 & 0.157805 & 1.2325 & 0.111246 \tabularnewline
12 & 0.177305 & 1.3848 & 0.08558 \tabularnewline
13 & 0.085601 & 0.6686 & 0.253148 \tabularnewline
14 & -0.007776 & -0.0607 & 0.475886 \tabularnewline
15 & -0.112866 & -0.8815 & 0.19075 \tabularnewline
16 & -0.148918 & -1.1631 & 0.124663 \tabularnewline
17 & -0.159735 & -1.2476 & 0.108479 \tabularnewline
\hline
\end{tabular}
%Source: https://freestatistics.org/blog/index.php?pk=63555&T=1

[TABLE]
[ROW][C]Autocorrelation Function[/C][/ROW]
[ROW][C]Time lag k[/C][C]ACF(k)[/C][C]T-STAT[/C][C]P-value[/C][/ROW]
[ROW][C]1[/C][C]0.837597[/C][C]6.5418[/C][C]0[/C][/ROW]
[ROW][C]2[/C][C]0.673092[/C][C]5.257[/C][C]1e-06[/C][/ROW]
[ROW][C]3[/C][C]0.501066[/C][C]3.9135[/C][C]0.000116[/C][/ROW]
[ROW][C]4[/C][C]0.363805[/C][C]2.8414[/C][C]0.003049[/C][/ROW]
[ROW][C]5[/C][C]0.274226[/C][C]2.1418[/C][C]0.018107[/C][/ROW]
[ROW][C]6[/C][C]0.212287[/C][C]1.658[/C][C]0.051224[/C][/ROW]
[ROW][C]7[/C][C]0.133986[/C][C]1.0465[/C][C]0.149738[/C][/ROW]
[ROW][C]8[/C][C]0.075698[/C][C]0.5912[/C][C]0.278278[/C][/ROW]
[ROW][C]9[/C][C]0.082392[/C][C]0.6435[/C][C]0.261156[/C][/ROW]
[ROW][C]10[/C][C]0.107076[/C][C]0.8363[/C][C]0.203129[/C][/ROW]
[ROW][C]11[/C][C]0.157805[/C][C]1.2325[/C][C]0.111246[/C][/ROW]
[ROW][C]12[/C][C]0.177305[/C][C]1.3848[/C][C]0.08558[/C][/ROW]
[ROW][C]13[/C][C]0.085601[/C][C]0.6686[/C][C]0.253148[/C][/ROW]
[ROW][C]14[/C][C]-0.007776[/C][C]-0.0607[/C][C]0.475886[/C][/ROW]
[ROW][C]15[/C][C]-0.112866[/C][C]-0.8815[/C][C]0.19075[/C][/ROW]
[ROW][C]16[/C][C]-0.148918[/C][C]-1.1631[/C][C]0.124663[/C][/ROW]
[ROW][C]17[/C][C]-0.159735[/C][C]-1.2476[/C][C]0.108479[/C][/ROW]
[/TABLE]
Source: https://freestatistics.org/blog/index.php?pk=63555&T=1

Globally Unique Identifier (entire table): ba.freestatistics.org/blog/index.php?pk=63555&T=1

As an alternative you can also use a QR Code:  

The GUIDs for individual cells are displayed in the table below:

Autocorrelation Function
Time lag kACF(k)T-STATP-value
10.8375976.54180
20.6730925.2571e-06
30.5010663.91350.000116
40.3638052.84140.003049
50.2742262.14180.018107
60.2122871.6580.051224
70.1339861.04650.149738
80.0756980.59120.278278
90.0823920.64350.261156
100.1070760.83630.203129
110.1578051.23250.111246
120.1773051.38480.08558
130.0856010.66860.253148
14-0.007776-0.06070.475886
15-0.112866-0.88150.19075
16-0.148918-1.16310.124663
17-0.159735-1.24760.108479


Partial Autocorrelation Function
Time lag kPACF(k)T-STATP-value
10.8375976.54180
2-0.095422-0.74530.229486
3-0.123719-0.96630.168861
40.0049080.03830.484773
50.0605640.4730.318944
60.0073640.05750.47716
7-0.124267-0.97060.167802
80.0103990.08120.467766
90.19661.53550.064917
100.041790.32640.372624
110.0570210.44540.328821
12-0.059895-0.46780.3208
13-0.323814-2.52910.007019
14-0.015568-0.12160.451813
15-0.083271-0.65040.258948
160.1374361.07340.143658
170.0055330.04320.482837

\begin{tabular}{lllllllll}
\hline
Partial Autocorrelation Function \tabularnewline
Time lag k & PACF(k) & T-STAT & P-value \tabularnewline
1 & 0.837597 & 6.5418 & 0 \tabularnewline
2 & -0.095422 & -0.7453 & 0.229486 \tabularnewline
3 & -0.123719 & -0.9663 & 0.168861 \tabularnewline
4 & 0.004908 & 0.0383 & 0.484773 \tabularnewline
5 & 0.060564 & 0.473 & 0.318944 \tabularnewline
6 & 0.007364 & 0.0575 & 0.47716 \tabularnewline
7 & -0.124267 & -0.9706 & 0.167802 \tabularnewline
8 & 0.010399 & 0.0812 & 0.467766 \tabularnewline
9 & 0.1966 & 1.5355 & 0.064917 \tabularnewline
10 & 0.04179 & 0.3264 & 0.372624 \tabularnewline
11 & 0.057021 & 0.4454 & 0.328821 \tabularnewline
12 & -0.059895 & -0.4678 & 0.3208 \tabularnewline
13 & -0.323814 & -2.5291 & 0.007019 \tabularnewline
14 & -0.015568 & -0.1216 & 0.451813 \tabularnewline
15 & -0.083271 & -0.6504 & 0.258948 \tabularnewline
16 & 0.137436 & 1.0734 & 0.143658 \tabularnewline
17 & 0.005533 & 0.0432 & 0.482837 \tabularnewline
\hline
\end{tabular}
%Source: https://freestatistics.org/blog/index.php?pk=63555&T=2

[TABLE]
[ROW][C]Partial Autocorrelation Function[/C][/ROW]
[ROW][C]Time lag k[/C][C]PACF(k)[/C][C]T-STAT[/C][C]P-value[/C][/ROW]
[ROW][C]1[/C][C]0.837597[/C][C]6.5418[/C][C]0[/C][/ROW]
[ROW][C]2[/C][C]-0.095422[/C][C]-0.7453[/C][C]0.229486[/C][/ROW]
[ROW][C]3[/C][C]-0.123719[/C][C]-0.9663[/C][C]0.168861[/C][/ROW]
[ROW][C]4[/C][C]0.004908[/C][C]0.0383[/C][C]0.484773[/C][/ROW]
[ROW][C]5[/C][C]0.060564[/C][C]0.473[/C][C]0.318944[/C][/ROW]
[ROW][C]6[/C][C]0.007364[/C][C]0.0575[/C][C]0.47716[/C][/ROW]
[ROW][C]7[/C][C]-0.124267[/C][C]-0.9706[/C][C]0.167802[/C][/ROW]
[ROW][C]8[/C][C]0.010399[/C][C]0.0812[/C][C]0.467766[/C][/ROW]
[ROW][C]9[/C][C]0.1966[/C][C]1.5355[/C][C]0.064917[/C][/ROW]
[ROW][C]10[/C][C]0.04179[/C][C]0.3264[/C][C]0.372624[/C][/ROW]
[ROW][C]11[/C][C]0.057021[/C][C]0.4454[/C][C]0.328821[/C][/ROW]
[ROW][C]12[/C][C]-0.059895[/C][C]-0.4678[/C][C]0.3208[/C][/ROW]
[ROW][C]13[/C][C]-0.323814[/C][C]-2.5291[/C][C]0.007019[/C][/ROW]
[ROW][C]14[/C][C]-0.015568[/C][C]-0.1216[/C][C]0.451813[/C][/ROW]
[ROW][C]15[/C][C]-0.083271[/C][C]-0.6504[/C][C]0.258948[/C][/ROW]
[ROW][C]16[/C][C]0.137436[/C][C]1.0734[/C][C]0.143658[/C][/ROW]
[ROW][C]17[/C][C]0.005533[/C][C]0.0432[/C][C]0.482837[/C][/ROW]
[/TABLE]
Source: https://freestatistics.org/blog/index.php?pk=63555&T=2

Globally Unique Identifier (entire table): ba.freestatistics.org/blog/index.php?pk=63555&T=2

As an alternative you can also use a QR Code:  

The GUIDs for individual cells are displayed in the table below:

Partial Autocorrelation Function
Time lag kPACF(k)T-STATP-value
10.8375976.54180
2-0.095422-0.74530.229486
3-0.123719-0.96630.168861
40.0049080.03830.484773
50.0605640.4730.318944
60.0073640.05750.47716
7-0.124267-0.97060.167802
80.0103990.08120.467766
90.19661.53550.064917
100.041790.32640.372624
110.0570210.44540.328821
12-0.059895-0.46780.3208
13-0.323814-2.52910.007019
14-0.015568-0.12160.451813
15-0.083271-0.65040.258948
160.1374361.07340.143658
170.0055330.04320.482837


Parameters (Session):
par1 = Default ; par2 = 1 ; par3 = 0 ; par4 = 0 ; par5 = 12 ; par6 = White Noise ; par7 = 0.95 ;
Parameters (R input):
par1 = Default ; par2 = 1 ; par3 = 0 ; par4 = 0 ; par5 = 12 ; par6 = White Noise ; par7 = 0.95 ;
R code (references can be found in the software module):
if (par1 == 'Default') {
par1 = 10*log10(length(x))
} else {
par1 <- as.numeric(par1)
}
par2 <- as.numeric(par2)
par3 <- as.numeric(par3)
par4 <- as.numeric(par4)
par5 <- as.numeric(par5)
if (par6 == 'White Noise') par6 <- 'white' else par6 <- 'ma'
par7 <- as.numeric(par7)
if (par2 == 0) {
x <- log(x)
} else {
x <- (x ^ par2 - 1) / par2
}
if (par3 > 0) x <- diff(x,lag=1,difference=par3)
if (par4 > 0) x <- diff(x,lag=par5,difference=par4)
bitmap(file='pic1.png')
racf <- acf(x, par1, main='Autocorrelation', xlab='time lag', ylab='ACF', ci.type=par6, ci=par7, sub=paste('(lambda=',par2,', d=',par3,', D=',par4,', CI=', par7, ', CI type=',par6,')',sep=''))
dev.off()
bitmap(file='pic2.png')
rpacf <- pacf(x,par1,main='Partial Autocorrelation',xlab='lags',ylab='PACF')
dev.off()
(myacf <- c(racf$acf))
(mypacf <- c(rpacf$acf))
lengthx <- length(x)
sqrtn <- sqrt(lengthx)
load(file='createtable')
a<-table.start()
a<-table.row.start(a)
a<-table.element(a,'Autocorrelation Function',4,TRUE)
a<-table.row.end(a)
a<-table.row.start(a)
a<-table.element(a,'Time lag k',header=TRUE)
a<-table.element(a,hyperlink('basics.htm','ACF(k)','click here for more information about the Autocorrelation Function'),header=TRUE)
a<-table.element(a,'T-STAT',header=TRUE)
a<-table.element(a,'P-value',header=TRUE)
a<-table.row.end(a)
for (i in 2:(par1+1)) {
a<-table.row.start(a)
a<-table.element(a,i-1,header=TRUE)
a<-table.element(a,round(myacf[i],6))
mytstat <- myacf[i]*sqrtn
a<-table.element(a,round(mytstat,4))
a<-table.element(a,round(1-pt(abs(mytstat),lengthx),6))
a<-table.row.end(a)
}
a<-table.end(a)
table.save(a,file='mytable.tab')
a<-table.start()
a<-table.row.start(a)
a<-table.element(a,'Partial Autocorrelation Function',4,TRUE)
a<-table.row.end(a)
a<-table.row.start(a)
a<-table.element(a,'Time lag k',header=TRUE)
a<-table.element(a,hyperlink('basics.htm','PACF(k)','click here for more information about the Partial Autocorrelation Function'),header=TRUE)
a<-table.element(a,'T-STAT',header=TRUE)
a<-table.element(a,'P-value',header=TRUE)
a<-table.row.end(a)
for (i in 1:par1) {
a<-table.row.start(a)
a<-table.element(a,i,header=TRUE)
a<-table.element(a,round(mypacf[i],6))
mytstat <- mypacf[i]*sqrtn
a<-table.element(a,round(mytstat,4))
a<-table.element(a,round(1-pt(abs(mytstat),lengthx),6))
a<-table.row.end(a)
}
a<-table.end(a)
table.save(a,file='mytable1.tab')