Free Statistics

of Irreproducible Research!

Author's title

Author*The author of this computation has been verified*
R Software Modulerwasp_autocorrelation.wasp
Title produced by software(Partial) Autocorrelation Function
Date of computationFri, 04 Dec 2009 07:08:03 -0700
Cite this page as followsStatistical Computations at FreeStatistics.org, Office for Research Development and Education, URL https://freestatistics.org/blog/index.php?v=date/2009/Dec/04/t1259935730sgvs1fumqvvr9bh.htm/, Retrieved Sun, 28 Apr 2024 17:47:04 +0000
Statistical Computations at FreeStatistics.org, Office for Research Development and Education, URL https://freestatistics.org/blog/index.php?pk=63558, Retrieved Sun, 28 Apr 2024 17:47:04 +0000
QR Codes:

Original text written by user:
IsPrivate?No (this computation is public)
User-defined keywords
Estimated Impact101
Family? (F = Feedback message, R = changed R code, M = changed R Module, P = changed Parameters, D = changed Data)
-     [Univariate Data Series] [data set] [2008-12-01 19:54:57] [b98453cac15ba1066b407e146608df68]
- RMP   [(Partial) Autocorrelation Function] [] [2009-11-27 14:46:03] [b98453cac15ba1066b407e146608df68]
-   PD      [(Partial) Autocorrelation Function] [WS 9: Correlatie D=1] [2009-12-04 14:08:03] [ac86848d66148c9c4c9404e0c9a511eb] [Current]
Feedback Forum

Post a new message
Dataseries X:
79.8
83.4
113.6
112.9
104
109.9
99
106.3
128.9
111.1
102.9
130
87
87.5
117.6
103.4
110.8
112.6
102.5
112.4
135.6
105.1
127.7
137
91
90.5
122.4
123.3
124.3
120
118.1
119
142.7
123.6
129.6
151.6
110.4
99.2
130.5
136.2
129.7
128
121.6
135.8
143.8
147.5
136.2
156.6
123.3
104.5
139.8
136.5
112.1
118.5
94.4
102.3
111.4
99.2
87.8
115.8


Summary of computational transaction
Raw Inputview raw input (R code)
Raw Outputview raw output of R engine
Computing time1 seconds
R Server'Gwilym Jenkins' @ 72.249.127.135

\begin{tabular}{lllllllll}
\hline
Summary of computational transaction \tabularnewline
Raw Input & view raw input (R code)  \tabularnewline
Raw Output & view raw output of R engine  \tabularnewline
Computing time & 1 seconds \tabularnewline
R Server & 'Gwilym Jenkins' @ 72.249.127.135 \tabularnewline
\hline
\end{tabular}
%Source: https://freestatistics.org/blog/index.php?pk=63558&T=0

[TABLE]
[ROW][C]Summary of computational transaction[/C][/ROW]
[ROW][C]Raw Input[/C][C]view raw input (R code) [/C][/ROW]
[ROW][C]Raw Output[/C][C]view raw output of R engine [/C][/ROW]
[ROW][C]Computing time[/C][C]1 seconds[/C][/ROW]
[ROW][C]R Server[/C][C]'Gwilym Jenkins' @ 72.249.127.135[/C][/ROW]
[/TABLE]
Source: https://freestatistics.org/blog/index.php?pk=63558&T=0

Globally Unique Identifier (entire table): ba.freestatistics.org/blog/index.php?pk=63558&T=0

As an alternative you can also use a QR Code:  

The GUIDs for individual cells are displayed in the table below:

Summary of computational transaction
Raw Inputview raw input (R code)
Raw Outputview raw output of R engine
Computing time1 seconds
R Server'Gwilym Jenkins' @ 72.249.127.135


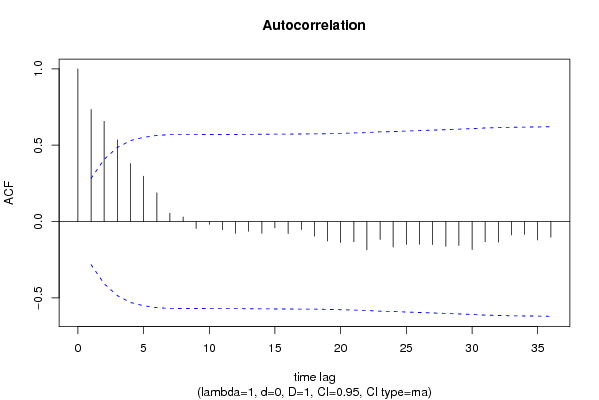
Autocorrelation Function
Time lag kACF(k)T-STATP-value
10.7348325.09113e-06
20.6570964.55251.8e-05
30.5350223.70670.000272
40.3795642.62970.005725
50.2973892.06040.022403
60.1880561.30290.099414
70.0548220.37980.352877
80.0301770.20910.417637
9-0.045495-0.31520.376988
10-0.018268-0.12660.449907
11-0.053161-0.36830.35713
12-0.078105-0.54110.295462
13-0.063014-0.43660.33219
14-0.077092-0.53410.297865
15-0.042264-0.29280.385464
16-0.078956-0.5470.293449
17-0.052059-0.36070.359963
18-0.095582-0.66220.2555
19-0.127988-0.88670.189824
20-0.137458-0.95230.172849
21-0.132158-0.91560.182223
22-0.185652-1.28620.102265
23-0.117128-0.81150.210546
24-0.167214-1.15850.126198
25-0.149716-1.03730.152405
26-0.14921-1.03380.153214
27-0.15102-1.04630.150331
28-0.162729-1.12740.132584
29-0.156536-1.08450.141777
30-0.183668-1.27250.104664
31-0.131674-0.91230.183095
32-0.134222-0.92990.178534
33-0.088125-0.61050.27219
34-0.084442-0.5850.280633
35-0.12093-0.83780.203139
36-0.103003-0.71360.239458

\begin{tabular}{lllllllll}
\hline
Autocorrelation Function \tabularnewline
Time lag k & ACF(k) & T-STAT & P-value \tabularnewline
1 & 0.734832 & 5.0911 & 3e-06 \tabularnewline
2 & 0.657096 & 4.5525 & 1.8e-05 \tabularnewline
3 & 0.535022 & 3.7067 & 0.000272 \tabularnewline
4 & 0.379564 & 2.6297 & 0.005725 \tabularnewline
5 & 0.297389 & 2.0604 & 0.022403 \tabularnewline
6 & 0.188056 & 1.3029 & 0.099414 \tabularnewline
7 & 0.054822 & 0.3798 & 0.352877 \tabularnewline
8 & 0.030177 & 0.2091 & 0.417637 \tabularnewline
9 & -0.045495 & -0.3152 & 0.376988 \tabularnewline
10 & -0.018268 & -0.1266 & 0.449907 \tabularnewline
11 & -0.053161 & -0.3683 & 0.35713 \tabularnewline
12 & -0.078105 & -0.5411 & 0.295462 \tabularnewline
13 & -0.063014 & -0.4366 & 0.33219 \tabularnewline
14 & -0.077092 & -0.5341 & 0.297865 \tabularnewline
15 & -0.042264 & -0.2928 & 0.385464 \tabularnewline
16 & -0.078956 & -0.547 & 0.293449 \tabularnewline
17 & -0.052059 & -0.3607 & 0.359963 \tabularnewline
18 & -0.095582 & -0.6622 & 0.2555 \tabularnewline
19 & -0.127988 & -0.8867 & 0.189824 \tabularnewline
20 & -0.137458 & -0.9523 & 0.172849 \tabularnewline
21 & -0.132158 & -0.9156 & 0.182223 \tabularnewline
22 & -0.185652 & -1.2862 & 0.102265 \tabularnewline
23 & -0.117128 & -0.8115 & 0.210546 \tabularnewline
24 & -0.167214 & -1.1585 & 0.126198 \tabularnewline
25 & -0.149716 & -1.0373 & 0.152405 \tabularnewline
26 & -0.14921 & -1.0338 & 0.153214 \tabularnewline
27 & -0.15102 & -1.0463 & 0.150331 \tabularnewline
28 & -0.162729 & -1.1274 & 0.132584 \tabularnewline
29 & -0.156536 & -1.0845 & 0.141777 \tabularnewline
30 & -0.183668 & -1.2725 & 0.104664 \tabularnewline
31 & -0.131674 & -0.9123 & 0.183095 \tabularnewline
32 & -0.134222 & -0.9299 & 0.178534 \tabularnewline
33 & -0.088125 & -0.6105 & 0.27219 \tabularnewline
34 & -0.084442 & -0.585 & 0.280633 \tabularnewline
35 & -0.12093 & -0.8378 & 0.203139 \tabularnewline
36 & -0.103003 & -0.7136 & 0.239458 \tabularnewline
\hline
\end{tabular}
%Source: https://freestatistics.org/blog/index.php?pk=63558&T=1

[TABLE]
[ROW][C]Autocorrelation Function[/C][/ROW]
[ROW][C]Time lag k[/C][C]ACF(k)[/C][C]T-STAT[/C][C]P-value[/C][/ROW]
[ROW][C]1[/C][C]0.734832[/C][C]5.0911[/C][C]3e-06[/C][/ROW]
[ROW][C]2[/C][C]0.657096[/C][C]4.5525[/C][C]1.8e-05[/C][/ROW]
[ROW][C]3[/C][C]0.535022[/C][C]3.7067[/C][C]0.000272[/C][/ROW]
[ROW][C]4[/C][C]0.379564[/C][C]2.6297[/C][C]0.005725[/C][/ROW]
[ROW][C]5[/C][C]0.297389[/C][C]2.0604[/C][C]0.022403[/C][/ROW]
[ROW][C]6[/C][C]0.188056[/C][C]1.3029[/C][C]0.099414[/C][/ROW]
[ROW][C]7[/C][C]0.054822[/C][C]0.3798[/C][C]0.352877[/C][/ROW]
[ROW][C]8[/C][C]0.030177[/C][C]0.2091[/C][C]0.417637[/C][/ROW]
[ROW][C]9[/C][C]-0.045495[/C][C]-0.3152[/C][C]0.376988[/C][/ROW]
[ROW][C]10[/C][C]-0.018268[/C][C]-0.1266[/C][C]0.449907[/C][/ROW]
[ROW][C]11[/C][C]-0.053161[/C][C]-0.3683[/C][C]0.35713[/C][/ROW]
[ROW][C]12[/C][C]-0.078105[/C][C]-0.5411[/C][C]0.295462[/C][/ROW]
[ROW][C]13[/C][C]-0.063014[/C][C]-0.4366[/C][C]0.33219[/C][/ROW]
[ROW][C]14[/C][C]-0.077092[/C][C]-0.5341[/C][C]0.297865[/C][/ROW]
[ROW][C]15[/C][C]-0.042264[/C][C]-0.2928[/C][C]0.385464[/C][/ROW]
[ROW][C]16[/C][C]-0.078956[/C][C]-0.547[/C][C]0.293449[/C][/ROW]
[ROW][C]17[/C][C]-0.052059[/C][C]-0.3607[/C][C]0.359963[/C][/ROW]
[ROW][C]18[/C][C]-0.095582[/C][C]-0.6622[/C][C]0.2555[/C][/ROW]
[ROW][C]19[/C][C]-0.127988[/C][C]-0.8867[/C][C]0.189824[/C][/ROW]
[ROW][C]20[/C][C]-0.137458[/C][C]-0.9523[/C][C]0.172849[/C][/ROW]
[ROW][C]21[/C][C]-0.132158[/C][C]-0.9156[/C][C]0.182223[/C][/ROW]
[ROW][C]22[/C][C]-0.185652[/C][C]-1.2862[/C][C]0.102265[/C][/ROW]
[ROW][C]23[/C][C]-0.117128[/C][C]-0.8115[/C][C]0.210546[/C][/ROW]
[ROW][C]24[/C][C]-0.167214[/C][C]-1.1585[/C][C]0.126198[/C][/ROW]
[ROW][C]25[/C][C]-0.149716[/C][C]-1.0373[/C][C]0.152405[/C][/ROW]
[ROW][C]26[/C][C]-0.14921[/C][C]-1.0338[/C][C]0.153214[/C][/ROW]
[ROW][C]27[/C][C]-0.15102[/C][C]-1.0463[/C][C]0.150331[/C][/ROW]
[ROW][C]28[/C][C]-0.162729[/C][C]-1.1274[/C][C]0.132584[/C][/ROW]
[ROW][C]29[/C][C]-0.156536[/C][C]-1.0845[/C][C]0.141777[/C][/ROW]
[ROW][C]30[/C][C]-0.183668[/C][C]-1.2725[/C][C]0.104664[/C][/ROW]
[ROW][C]31[/C][C]-0.131674[/C][C]-0.9123[/C][C]0.183095[/C][/ROW]
[ROW][C]32[/C][C]-0.134222[/C][C]-0.9299[/C][C]0.178534[/C][/ROW]
[ROW][C]33[/C][C]-0.088125[/C][C]-0.6105[/C][C]0.27219[/C][/ROW]
[ROW][C]34[/C][C]-0.084442[/C][C]-0.585[/C][C]0.280633[/C][/ROW]
[ROW][C]35[/C][C]-0.12093[/C][C]-0.8378[/C][C]0.203139[/C][/ROW]
[ROW][C]36[/C][C]-0.103003[/C][C]-0.7136[/C][C]0.239458[/C][/ROW]
[/TABLE]
Source: https://freestatistics.org/blog/index.php?pk=63558&T=1

Globally Unique Identifier (entire table): ba.freestatistics.org/blog/index.php?pk=63558&T=1

As an alternative you can also use a QR Code:  

The GUIDs for individual cells are displayed in the table below:

Autocorrelation Function
Time lag kACF(k)T-STATP-value
10.7348325.09113e-06
20.6570964.55251.8e-05
30.5350223.70670.000272
40.3795642.62970.005725
50.2973892.06040.022403
60.1880561.30290.099414
70.0548220.37980.352877
80.0301770.20910.417637
9-0.045495-0.31520.376988
10-0.018268-0.12660.449907
11-0.053161-0.36830.35713
12-0.078105-0.54110.295462
13-0.063014-0.43660.33219
14-0.077092-0.53410.297865
15-0.042264-0.29280.385464
16-0.078956-0.5470.293449
17-0.052059-0.36070.359963
18-0.095582-0.66220.2555
19-0.127988-0.88670.189824
20-0.137458-0.95230.172849
21-0.132158-0.91560.182223
22-0.185652-1.28620.102265
23-0.117128-0.81150.210546
24-0.167214-1.15850.126198
25-0.149716-1.03730.152405
26-0.14921-1.03380.153214
27-0.15102-1.04630.150331
28-0.162729-1.12740.132584
29-0.156536-1.08450.141777
30-0.183668-1.27250.104664
31-0.131674-0.91230.183095
32-0.134222-0.92990.178534
33-0.088125-0.61050.27219
34-0.084442-0.5850.280633
35-0.12093-0.83780.203139
36-0.103003-0.71360.239458


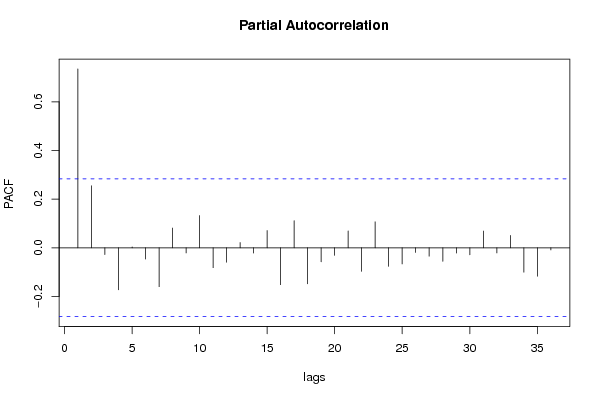
Partial Autocorrelation Function
Time lag kPACF(k)T-STATP-value
10.7348325.09113e-06
20.2545931.76390.042059
3-0.027858-0.1930.423886
4-0.172462-1.19490.119008
50.003590.02490.490131
6-0.046517-0.32230.374321
7-0.159573-1.10560.137215
80.0812460.56290.288066
9-0.021193-0.14680.441941
100.1325520.91830.181515
11-0.081656-0.56570.287106
12-0.059393-0.41150.341274
130.0213230.14770.441588
14-0.02172-0.15050.440507
150.0709330.49140.312678
16-0.151778-1.05150.149137
170.1111890.77030.222436
18-0.148044-1.02570.155091
19-0.0575-0.39840.346062
20-0.03069-0.21260.416259
210.0691430.4790.317045
22-0.096766-0.67040.252904
230.1065160.7380.232064
24-0.076217-0.5280.299951
25-0.06647-0.46050.323612
26-0.018907-0.1310.448164
27-0.034636-0.240.40569
28-0.055622-0.38540.350838
29-0.021435-0.14850.441283
30-0.028729-0.1990.421535
310.0686110.47540.318345
32-0.020945-0.14510.442615
330.0510110.35340.362664
34-0.100245-0.69450.245353
35-0.116622-0.8080.211544
36-0.009054-0.06270.475121

\begin{tabular}{lllllllll}
\hline
Partial Autocorrelation Function \tabularnewline
Time lag k & PACF(k) & T-STAT & P-value \tabularnewline
1 & 0.734832 & 5.0911 & 3e-06 \tabularnewline
2 & 0.254593 & 1.7639 & 0.042059 \tabularnewline
3 & -0.027858 & -0.193 & 0.423886 \tabularnewline
4 & -0.172462 & -1.1949 & 0.119008 \tabularnewline
5 & 0.00359 & 0.0249 & 0.490131 \tabularnewline
6 & -0.046517 & -0.3223 & 0.374321 \tabularnewline
7 & -0.159573 & -1.1056 & 0.137215 \tabularnewline
8 & 0.081246 & 0.5629 & 0.288066 \tabularnewline
9 & -0.021193 & -0.1468 & 0.441941 \tabularnewline
10 & 0.132552 & 0.9183 & 0.181515 \tabularnewline
11 & -0.081656 & -0.5657 & 0.287106 \tabularnewline
12 & -0.059393 & -0.4115 & 0.341274 \tabularnewline
13 & 0.021323 & 0.1477 & 0.441588 \tabularnewline
14 & -0.02172 & -0.1505 & 0.440507 \tabularnewline
15 & 0.070933 & 0.4914 & 0.312678 \tabularnewline
16 & -0.151778 & -1.0515 & 0.149137 \tabularnewline
17 & 0.111189 & 0.7703 & 0.222436 \tabularnewline
18 & -0.148044 & -1.0257 & 0.155091 \tabularnewline
19 & -0.0575 & -0.3984 & 0.346062 \tabularnewline
20 & -0.03069 & -0.2126 & 0.416259 \tabularnewline
21 & 0.069143 & 0.479 & 0.317045 \tabularnewline
22 & -0.096766 & -0.6704 & 0.252904 \tabularnewline
23 & 0.106516 & 0.738 & 0.232064 \tabularnewline
24 & -0.076217 & -0.528 & 0.299951 \tabularnewline
25 & -0.06647 & -0.4605 & 0.323612 \tabularnewline
26 & -0.018907 & -0.131 & 0.448164 \tabularnewline
27 & -0.034636 & -0.24 & 0.40569 \tabularnewline
28 & -0.055622 & -0.3854 & 0.350838 \tabularnewline
29 & -0.021435 & -0.1485 & 0.441283 \tabularnewline
30 & -0.028729 & -0.199 & 0.421535 \tabularnewline
31 & 0.068611 & 0.4754 & 0.318345 \tabularnewline
32 & -0.020945 & -0.1451 & 0.442615 \tabularnewline
33 & 0.051011 & 0.3534 & 0.362664 \tabularnewline
34 & -0.100245 & -0.6945 & 0.245353 \tabularnewline
35 & -0.116622 & -0.808 & 0.211544 \tabularnewline
36 & -0.009054 & -0.0627 & 0.475121 \tabularnewline
\hline
\end{tabular}
%Source: https://freestatistics.org/blog/index.php?pk=63558&T=2

[TABLE]
[ROW][C]Partial Autocorrelation Function[/C][/ROW]
[ROW][C]Time lag k[/C][C]PACF(k)[/C][C]T-STAT[/C][C]P-value[/C][/ROW]
[ROW][C]1[/C][C]0.734832[/C][C]5.0911[/C][C]3e-06[/C][/ROW]
[ROW][C]2[/C][C]0.254593[/C][C]1.7639[/C][C]0.042059[/C][/ROW]
[ROW][C]3[/C][C]-0.027858[/C][C]-0.193[/C][C]0.423886[/C][/ROW]
[ROW][C]4[/C][C]-0.172462[/C][C]-1.1949[/C][C]0.119008[/C][/ROW]
[ROW][C]5[/C][C]0.00359[/C][C]0.0249[/C][C]0.490131[/C][/ROW]
[ROW][C]6[/C][C]-0.046517[/C][C]-0.3223[/C][C]0.374321[/C][/ROW]
[ROW][C]7[/C][C]-0.159573[/C][C]-1.1056[/C][C]0.137215[/C][/ROW]
[ROW][C]8[/C][C]0.081246[/C][C]0.5629[/C][C]0.288066[/C][/ROW]
[ROW][C]9[/C][C]-0.021193[/C][C]-0.1468[/C][C]0.441941[/C][/ROW]
[ROW][C]10[/C][C]0.132552[/C][C]0.9183[/C][C]0.181515[/C][/ROW]
[ROW][C]11[/C][C]-0.081656[/C][C]-0.5657[/C][C]0.287106[/C][/ROW]
[ROW][C]12[/C][C]-0.059393[/C][C]-0.4115[/C][C]0.341274[/C][/ROW]
[ROW][C]13[/C][C]0.021323[/C][C]0.1477[/C][C]0.441588[/C][/ROW]
[ROW][C]14[/C][C]-0.02172[/C][C]-0.1505[/C][C]0.440507[/C][/ROW]
[ROW][C]15[/C][C]0.070933[/C][C]0.4914[/C][C]0.312678[/C][/ROW]
[ROW][C]16[/C][C]-0.151778[/C][C]-1.0515[/C][C]0.149137[/C][/ROW]
[ROW][C]17[/C][C]0.111189[/C][C]0.7703[/C][C]0.222436[/C][/ROW]
[ROW][C]18[/C][C]-0.148044[/C][C]-1.0257[/C][C]0.155091[/C][/ROW]
[ROW][C]19[/C][C]-0.0575[/C][C]-0.3984[/C][C]0.346062[/C][/ROW]
[ROW][C]20[/C][C]-0.03069[/C][C]-0.2126[/C][C]0.416259[/C][/ROW]
[ROW][C]21[/C][C]0.069143[/C][C]0.479[/C][C]0.317045[/C][/ROW]
[ROW][C]22[/C][C]-0.096766[/C][C]-0.6704[/C][C]0.252904[/C][/ROW]
[ROW][C]23[/C][C]0.106516[/C][C]0.738[/C][C]0.232064[/C][/ROW]
[ROW][C]24[/C][C]-0.076217[/C][C]-0.528[/C][C]0.299951[/C][/ROW]
[ROW][C]25[/C][C]-0.06647[/C][C]-0.4605[/C][C]0.323612[/C][/ROW]
[ROW][C]26[/C][C]-0.018907[/C][C]-0.131[/C][C]0.448164[/C][/ROW]
[ROW][C]27[/C][C]-0.034636[/C][C]-0.24[/C][C]0.40569[/C][/ROW]
[ROW][C]28[/C][C]-0.055622[/C][C]-0.3854[/C][C]0.350838[/C][/ROW]
[ROW][C]29[/C][C]-0.021435[/C][C]-0.1485[/C][C]0.441283[/C][/ROW]
[ROW][C]30[/C][C]-0.028729[/C][C]-0.199[/C][C]0.421535[/C][/ROW]
[ROW][C]31[/C][C]0.068611[/C][C]0.4754[/C][C]0.318345[/C][/ROW]
[ROW][C]32[/C][C]-0.020945[/C][C]-0.1451[/C][C]0.442615[/C][/ROW]
[ROW][C]33[/C][C]0.051011[/C][C]0.3534[/C][C]0.362664[/C][/ROW]
[ROW][C]34[/C][C]-0.100245[/C][C]-0.6945[/C][C]0.245353[/C][/ROW]
[ROW][C]35[/C][C]-0.116622[/C][C]-0.808[/C][C]0.211544[/C][/ROW]
[ROW][C]36[/C][C]-0.009054[/C][C]-0.0627[/C][C]0.475121[/C][/ROW]
[/TABLE]
Source: https://freestatistics.org/blog/index.php?pk=63558&T=2

Globally Unique Identifier (entire table): ba.freestatistics.org/blog/index.php?pk=63558&T=2

As an alternative you can also use a QR Code:  

The GUIDs for individual cells are displayed in the table below:

Partial Autocorrelation Function
Time lag kPACF(k)T-STATP-value
10.7348325.09113e-06
20.2545931.76390.042059
3-0.027858-0.1930.423886
4-0.172462-1.19490.119008
50.003590.02490.490131
6-0.046517-0.32230.374321
7-0.159573-1.10560.137215
80.0812460.56290.288066
9-0.021193-0.14680.441941
100.1325520.91830.181515
11-0.081656-0.56570.287106
12-0.059393-0.41150.341274
130.0213230.14770.441588
14-0.02172-0.15050.440507
150.0709330.49140.312678
16-0.151778-1.05150.149137
170.1111890.77030.222436
18-0.148044-1.02570.155091
19-0.0575-0.39840.346062
20-0.03069-0.21260.416259
210.0691430.4790.317045
22-0.096766-0.67040.252904
230.1065160.7380.232064
24-0.076217-0.5280.299951
25-0.06647-0.46050.323612
26-0.018907-0.1310.448164
27-0.034636-0.240.40569
28-0.055622-0.38540.350838
29-0.021435-0.14850.441283
30-0.028729-0.1990.421535
310.0686110.47540.318345
32-0.020945-0.14510.442615
330.0510110.35340.362664
34-0.100245-0.69450.245353
35-0.116622-0.8080.211544
36-0.009054-0.06270.475121


Parameters (Session):
par1 = 36 ; par2 = 1 ; par3 = 0 ; par4 = 1 ; par5 = 12 ; par6 = MA ; par7 = 0.95 ;
Parameters (R input):
par1 = 36 ; par2 = 1 ; par3 = 0 ; par4 = 1 ; par5 = 12 ; par6 = MA ; par7 = 0.95 ;
R code (references can be found in the software module):
if (par1 == 'Default') {
par1 = 10*log10(length(x))
} else {
par1 <- as.numeric(par1)
}
par2 <- as.numeric(par2)
par3 <- as.numeric(par3)
par4 <- as.numeric(par4)
par5 <- as.numeric(par5)
if (par6 == 'White Noise') par6 <- 'white' else par6 <- 'ma'
par7 <- as.numeric(par7)
if (par2 == 0) {
x <- log(x)
} else {
x <- (x ^ par2 - 1) / par2
}
if (par3 > 0) x <- diff(x,lag=1,difference=par3)
if (par4 > 0) x <- diff(x,lag=par5,difference=par4)
bitmap(file='pic1.png')
racf <- acf(x, par1, main='Autocorrelation', xlab='time lag', ylab='ACF', ci.type=par6, ci=par7, sub=paste('(lambda=',par2,', d=',par3,', D=',par4,', CI=', par7, ', CI type=',par6,')',sep=''))
dev.off()
bitmap(file='pic2.png')
rpacf <- pacf(x,par1,main='Partial Autocorrelation',xlab='lags',ylab='PACF')
dev.off()
(myacf <- c(racf$acf))
(mypacf <- c(rpacf$acf))
lengthx <- length(x)
sqrtn <- sqrt(lengthx)
load(file='createtable')
a<-table.start()
a<-table.row.start(a)
a<-table.element(a,'Autocorrelation Function',4,TRUE)
a<-table.row.end(a)
a<-table.row.start(a)
a<-table.element(a,'Time lag k',header=TRUE)
a<-table.element(a,hyperlink('basics.htm','ACF(k)','click here for more information about the Autocorrelation Function'),header=TRUE)
a<-table.element(a,'T-STAT',header=TRUE)
a<-table.element(a,'P-value',header=TRUE)
a<-table.row.end(a)
for (i in 2:(par1+1)) {
a<-table.row.start(a)
a<-table.element(a,i-1,header=TRUE)
a<-table.element(a,round(myacf[i],6))
mytstat <- myacf[i]*sqrtn
a<-table.element(a,round(mytstat,4))
a<-table.element(a,round(1-pt(abs(mytstat),lengthx),6))
a<-table.row.end(a)
}
a<-table.end(a)
table.save(a,file='mytable.tab')
a<-table.start()
a<-table.row.start(a)
a<-table.element(a,'Partial Autocorrelation Function',4,TRUE)
a<-table.row.end(a)
a<-table.row.start(a)
a<-table.element(a,'Time lag k',header=TRUE)
a<-table.element(a,hyperlink('basics.htm','PACF(k)','click here for more information about the Partial Autocorrelation Function'),header=TRUE)
a<-table.element(a,'T-STAT',header=TRUE)
a<-table.element(a,'P-value',header=TRUE)
a<-table.row.end(a)
for (i in 1:par1) {
a<-table.row.start(a)
a<-table.element(a,i,header=TRUE)
a<-table.element(a,round(mypacf[i],6))
mytstat <- mypacf[i]*sqrtn
a<-table.element(a,round(mytstat,4))
a<-table.element(a,round(1-pt(abs(mytstat),lengthx),6))
a<-table.row.end(a)
}
a<-table.end(a)
table.save(a,file='mytable1.tab')