Free Statistics

of Irreproducible Research!

Author's title

Author*The author of this computation has been verified*
R Software Modulerwasp_arimabackwardselection.wasp
Title produced by softwareARIMA Backward Selection
Date of computationFri, 04 Dec 2009 07:01:34 -0700
Cite this page as followsStatistical Computations at FreeStatistics.org, Office for Research Development and Education, URL https://freestatistics.org/blog/index.php?v=date/2009/Dec/04/t12599358146vge3otwktzpweb.htm/, Retrieved Sat, 27 Apr 2024 14:47:58 +0000
Statistical Computations at FreeStatistics.org, Office for Research Development and Education, URL https://freestatistics.org/blog/index.php?pk=63561, Retrieved Sat, 27 Apr 2024 14:47:58 +0000
QR Codes:

Original text written by user:
IsPrivate?No (this computation is public)
User-defined keywords
Estimated Impact125
Family? (F = Feedback message, R = changed R code, M = changed R Module, P = changed Parameters, D = changed Data)
-     [Univariate Data Series] [data set] [2008-12-01 19:54:57] [b98453cac15ba1066b407e146608df68]
- RMP   [ARIMA Backward Selection] [] [2009-11-27 14:53:14] [b98453cac15ba1066b407e146608df68]
-   PD      [ARIMA Backward Selection] [cs.shw.ws9.v4] [2009-12-04 14:01:34] [d41d8cd98f00b204e9800998ecf8427e] [Current]
Feedback Forum

Post a new message
Dataseries X:
10570
10297
10635
10872
10296
10383
10431
10574
10653
10805
10872
10625
10407
10463
10556
10646
10702
11353
11346
11451
11964
12574
13031
13812
14544
14931
14886
16005
17064
15168
16050
15839
15137
14954
15648
15305
15579
16348
15928
16171
15937
15713
15594
15683
16438
17032
17696
17745
19394
20148
20108
18584
18441
18391
19178
18079
18483
19644
19195
19650


Summary of computational transaction
Raw Inputview raw input (R code)
Raw Outputview raw output of R engine
Computing time9 seconds
R Server'Gwilym Jenkins' @ 72.249.127.135

\begin{tabular}{lllllllll}
\hline
Summary of computational transaction \tabularnewline
Raw Input & view raw input (R code)  \tabularnewline
Raw Output & view raw output of R engine  \tabularnewline
Computing time & 9 seconds \tabularnewline
R Server & 'Gwilym Jenkins' @ 72.249.127.135 \tabularnewline
\hline
\end{tabular}
%Source: https://freestatistics.org/blog/index.php?pk=63561&T=0

[TABLE]
[ROW][C]Summary of computational transaction[/C][/ROW]
[ROW][C]Raw Input[/C][C]view raw input (R code) [/C][/ROW]
[ROW][C]Raw Output[/C][C]view raw output of R engine [/C][/ROW]
[ROW][C]Computing time[/C][C]9 seconds[/C][/ROW]
[ROW][C]R Server[/C][C]'Gwilym Jenkins' @ 72.249.127.135[/C][/ROW]
[/TABLE]
Source: https://freestatistics.org/blog/index.php?pk=63561&T=0

Globally Unique Identifier (entire table): ba.freestatistics.org/blog/index.php?pk=63561&T=0

As an alternative you can also use a QR Code:  

The GUIDs for individual cells are displayed in the table below:

Summary of computational transaction
Raw Inputview raw input (R code)
Raw Outputview raw output of R engine
Computing time9 seconds
R Server'Gwilym Jenkins' @ 72.249.127.135


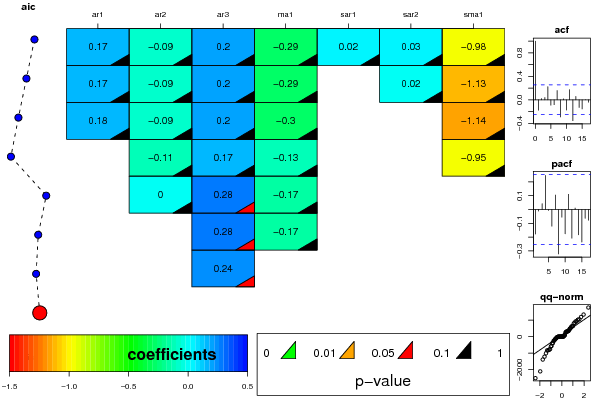
ARIMA Parameter Estimation and Backward Selection
Iterationar1ar2ar3ma1sar1sar2sma1
Estimates ( 1 )0.173-0.09310.1961-0.29030.02360.0301-0.9788
(p-val)(0.7155 )(0.5831 )(0.2172 )(0.533 )(0.9503 )(0.9233 )(0.7725 )
Estimates ( 2 )0.1734-0.09270.1952-0.290200.0151-1.1338
(p-val)(0.7167 )(0.5864 )(0.2188 )(0.5346 )(NA )(0.9414 )(0.4029 )
Estimates ( 3 )0.1795-0.08810.1966-0.295300-1.1441
(p-val)(0.6996 )(0.5784 )(0.209 )(0.5172 )(NA )(NA )(0.3674 )
Estimates ( 4 )0-0.11060.1688-0.125700-0.9529
(p-val)(NA )(0.4503 )(0.2585 )(0.38 )(NA )(NA )(0.6075 )
Estimates ( 5 )00.00370.2802-0.1737000
(p-val)(NA )(0.9796 )(0.0515 )(0.2248 )(NA )(NA )(NA )
Estimates ( 6 )000.2803-0.1728000
(p-val)(NA )(NA )(0.0515 )(0.211 )(NA )(NA )(NA )
Estimates ( 7 )000.24370000
(p-val)(NA )(NA )(0.087 )(NA )(NA )(NA )(NA )
Estimates ( 8 )0000000
(p-val)(NA )(NA )(NA )(NA )(NA )(NA )(NA )
Estimates ( 9 )NANANANANANANA
(p-val)(NA )(NA )(NA )(NA )(NA )(NA )(NA )
Estimates ( 10 )NANANANANANANA
(p-val)(NA )(NA )(NA )(NA )(NA )(NA )(NA )
Estimates ( 11 )NANANANANANANA
(p-val)(NA )(NA )(NA )(NA )(NA )(NA )(NA )
Estimates ( 12 )NANANANANANANA
(p-val)(NA )(NA )(NA )(NA )(NA )(NA )(NA )
Estimates ( 13 )NANANANANANANA
(p-val)(NA )(NA )(NA )(NA )(NA )(NA )(NA )

\begin{tabular}{lllllllll}
\hline
ARIMA Parameter Estimation and Backward Selection \tabularnewline
Iteration & ar1 & ar2 & ar3 & ma1 & sar1 & sar2 & sma1 \tabularnewline
Estimates ( 1 ) & 0.173 & -0.0931 & 0.1961 & -0.2903 & 0.0236 & 0.0301 & -0.9788 \tabularnewline
(p-val) & (0.7155 ) & (0.5831 ) & (0.2172 ) & (0.533 ) & (0.9503 ) & (0.9233 ) & (0.7725 ) \tabularnewline
Estimates ( 2 ) & 0.1734 & -0.0927 & 0.1952 & -0.2902 & 0 & 0.0151 & -1.1338 \tabularnewline
(p-val) & (0.7167 ) & (0.5864 ) & (0.2188 ) & (0.5346 ) & (NA ) & (0.9414 ) & (0.4029 ) \tabularnewline
Estimates ( 3 ) & 0.1795 & -0.0881 & 0.1966 & -0.2953 & 0 & 0 & -1.1441 \tabularnewline
(p-val) & (0.6996 ) & (0.5784 ) & (0.209 ) & (0.5172 ) & (NA ) & (NA ) & (0.3674 ) \tabularnewline
Estimates ( 4 ) & 0 & -0.1106 & 0.1688 & -0.1257 & 0 & 0 & -0.9529 \tabularnewline
(p-val) & (NA ) & (0.4503 ) & (0.2585 ) & (0.38 ) & (NA ) & (NA ) & (0.6075 ) \tabularnewline
Estimates ( 5 ) & 0 & 0.0037 & 0.2802 & -0.1737 & 0 & 0 & 0 \tabularnewline
(p-val) & (NA ) & (0.9796 ) & (0.0515 ) & (0.2248 ) & (NA ) & (NA ) & (NA ) \tabularnewline
Estimates ( 6 ) & 0 & 0 & 0.2803 & -0.1728 & 0 & 0 & 0 \tabularnewline
(p-val) & (NA ) & (NA ) & (0.0515 ) & (0.211 ) & (NA ) & (NA ) & (NA ) \tabularnewline
Estimates ( 7 ) & 0 & 0 & 0.2437 & 0 & 0 & 0 & 0 \tabularnewline
(p-val) & (NA ) & (NA ) & (0.087 ) & (NA ) & (NA ) & (NA ) & (NA ) \tabularnewline
Estimates ( 8 ) & 0 & 0 & 0 & 0 & 0 & 0 & 0 \tabularnewline
(p-val) & (NA ) & (NA ) & (NA ) & (NA ) & (NA ) & (NA ) & (NA ) \tabularnewline
Estimates ( 9 ) & NA & NA & NA & NA & NA & NA & NA \tabularnewline
(p-val) & (NA ) & (NA ) & (NA ) & (NA ) & (NA ) & (NA ) & (NA ) \tabularnewline
Estimates ( 10 ) & NA & NA & NA & NA & NA & NA & NA \tabularnewline
(p-val) & (NA ) & (NA ) & (NA ) & (NA ) & (NA ) & (NA ) & (NA ) \tabularnewline
Estimates ( 11 ) & NA & NA & NA & NA & NA & NA & NA \tabularnewline
(p-val) & (NA ) & (NA ) & (NA ) & (NA ) & (NA ) & (NA ) & (NA ) \tabularnewline
Estimates ( 12 ) & NA & NA & NA & NA & NA & NA & NA \tabularnewline
(p-val) & (NA ) & (NA ) & (NA ) & (NA ) & (NA ) & (NA ) & (NA ) \tabularnewline
Estimates ( 13 ) & NA & NA & NA & NA & NA & NA & NA \tabularnewline
(p-val) & (NA ) & (NA ) & (NA ) & (NA ) & (NA ) & (NA ) & (NA ) \tabularnewline
\hline
\end{tabular}
%Source: https://freestatistics.org/blog/index.php?pk=63561&T=1

[TABLE]
[ROW][C]ARIMA Parameter Estimation and Backward Selection[/C][/ROW]
[ROW][C]Iteration[/C][C]ar1[/C][C]ar2[/C][C]ar3[/C][C]ma1[/C][C]sar1[/C][C]sar2[/C][C]sma1[/C][/ROW]
[ROW][C]Estimates ( 1 )[/C][C]0.173[/C][C]-0.0931[/C][C]0.1961[/C][C]-0.2903[/C][C]0.0236[/C][C]0.0301[/C][C]-0.9788[/C][/ROW]
[ROW][C](p-val)[/C][C](0.7155 )[/C][C](0.5831 )[/C][C](0.2172 )[/C][C](0.533 )[/C][C](0.9503 )[/C][C](0.9233 )[/C][C](0.7725 )[/C][/ROW]
[ROW][C]Estimates ( 2 )[/C][C]0.1734[/C][C]-0.0927[/C][C]0.1952[/C][C]-0.2902[/C][C]0[/C][C]0.0151[/C][C]-1.1338[/C][/ROW]
[ROW][C](p-val)[/C][C](0.7167 )[/C][C](0.5864 )[/C][C](0.2188 )[/C][C](0.5346 )[/C][C](NA )[/C][C](0.9414 )[/C][C](0.4029 )[/C][/ROW]
[ROW][C]Estimates ( 3 )[/C][C]0.1795[/C][C]-0.0881[/C][C]0.1966[/C][C]-0.2953[/C][C]0[/C][C]0[/C][C]-1.1441[/C][/ROW]
[ROW][C](p-val)[/C][C](0.6996 )[/C][C](0.5784 )[/C][C](0.209 )[/C][C](0.5172 )[/C][C](NA )[/C][C](NA )[/C][C](0.3674 )[/C][/ROW]
[ROW][C]Estimates ( 4 )[/C][C]0[/C][C]-0.1106[/C][C]0.1688[/C][C]-0.1257[/C][C]0[/C][C]0[/C][C]-0.9529[/C][/ROW]
[ROW][C](p-val)[/C][C](NA )[/C][C](0.4503 )[/C][C](0.2585 )[/C][C](0.38 )[/C][C](NA )[/C][C](NA )[/C][C](0.6075 )[/C][/ROW]
[ROW][C]Estimates ( 5 )[/C][C]0[/C][C]0.0037[/C][C]0.2802[/C][C]-0.1737[/C][C]0[/C][C]0[/C][C]0[/C][/ROW]
[ROW][C](p-val)[/C][C](NA )[/C][C](0.9796 )[/C][C](0.0515 )[/C][C](0.2248 )[/C][C](NA )[/C][C](NA )[/C][C](NA )[/C][/ROW]
[ROW][C]Estimates ( 6 )[/C][C]0[/C][C]0[/C][C]0.2803[/C][C]-0.1728[/C][C]0[/C][C]0[/C][C]0[/C][/ROW]
[ROW][C](p-val)[/C][C](NA )[/C][C](NA )[/C][C](0.0515 )[/C][C](0.211 )[/C][C](NA )[/C][C](NA )[/C][C](NA )[/C][/ROW]
[ROW][C]Estimates ( 7 )[/C][C]0[/C][C]0[/C][C]0.2437[/C][C]0[/C][C]0[/C][C]0[/C][C]0[/C][/ROW]
[ROW][C](p-val)[/C][C](NA )[/C][C](NA )[/C][C](0.087 )[/C][C](NA )[/C][C](NA )[/C][C](NA )[/C][C](NA )[/C][/ROW]
[ROW][C]Estimates ( 8 )[/C][C]0[/C][C]0[/C][C]0[/C][C]0[/C][C]0[/C][C]0[/C][C]0[/C][/ROW]
[ROW][C](p-val)[/C][C](NA )[/C][C](NA )[/C][C](NA )[/C][C](NA )[/C][C](NA )[/C][C](NA )[/C][C](NA )[/C][/ROW]
[ROW][C]Estimates ( 9 )[/C][C]NA[/C][C]NA[/C][C]NA[/C][C]NA[/C][C]NA[/C][C]NA[/C][C]NA[/C][/ROW]
[ROW][C](p-val)[/C][C](NA )[/C][C](NA )[/C][C](NA )[/C][C](NA )[/C][C](NA )[/C][C](NA )[/C][C](NA )[/C][/ROW]
[ROW][C]Estimates ( 10 )[/C][C]NA[/C][C]NA[/C][C]NA[/C][C]NA[/C][C]NA[/C][C]NA[/C][C]NA[/C][/ROW]
[ROW][C](p-val)[/C][C](NA )[/C][C](NA )[/C][C](NA )[/C][C](NA )[/C][C](NA )[/C][C](NA )[/C][C](NA )[/C][/ROW]
[ROW][C]Estimates ( 11 )[/C][C]NA[/C][C]NA[/C][C]NA[/C][C]NA[/C][C]NA[/C][C]NA[/C][C]NA[/C][/ROW]
[ROW][C](p-val)[/C][C](NA )[/C][C](NA )[/C][C](NA )[/C][C](NA )[/C][C](NA )[/C][C](NA )[/C][C](NA )[/C][/ROW]
[ROW][C]Estimates ( 12 )[/C][C]NA[/C][C]NA[/C][C]NA[/C][C]NA[/C][C]NA[/C][C]NA[/C][C]NA[/C][/ROW]
[ROW][C](p-val)[/C][C](NA )[/C][C](NA )[/C][C](NA )[/C][C](NA )[/C][C](NA )[/C][C](NA )[/C][C](NA )[/C][/ROW]
[ROW][C]Estimates ( 13 )[/C][C]NA[/C][C]NA[/C][C]NA[/C][C]NA[/C][C]NA[/C][C]NA[/C][C]NA[/C][/ROW]
[ROW][C](p-val)[/C][C](NA )[/C][C](NA )[/C][C](NA )[/C][C](NA )[/C][C](NA )[/C][C](NA )[/C][C](NA )[/C][/ROW]
[/TABLE]
Source: https://freestatistics.org/blog/index.php?pk=63561&T=1

Globally Unique Identifier (entire table): ba.freestatistics.org/blog/index.php?pk=63561&T=1

As an alternative you can also use a QR Code:  

The GUIDs for individual cells are displayed in the table below:

ARIMA Parameter Estimation and Backward Selection
Iterationar1ar2ar3ma1sar1sar2sma1
Estimates ( 1 )0.173-0.09310.1961-0.29030.02360.0301-0.9788
(p-val)(0.7155 )(0.5831 )(0.2172 )(0.533 )(0.9503 )(0.9233 )(0.7725 )
Estimates ( 2 )0.1734-0.09270.1952-0.290200.0151-1.1338
(p-val)(0.7167 )(0.5864 )(0.2188 )(0.5346 )(NA )(0.9414 )(0.4029 )
Estimates ( 3 )0.1795-0.08810.1966-0.295300-1.1441
(p-val)(0.6996 )(0.5784 )(0.209 )(0.5172 )(NA )(NA )(0.3674 )
Estimates ( 4 )0-0.11060.1688-0.125700-0.9529
(p-val)(NA )(0.4503 )(0.2585 )(0.38 )(NA )(NA )(0.6075 )
Estimates ( 5 )00.00370.2802-0.1737000
(p-val)(NA )(0.9796 )(0.0515 )(0.2248 )(NA )(NA )(NA )
Estimates ( 6 )000.2803-0.1728000
(p-val)(NA )(NA )(0.0515 )(0.211 )(NA )(NA )(NA )
Estimates ( 7 )000.24370000
(p-val)(NA )(NA )(0.087 )(NA )(NA )(NA )(NA )
Estimates ( 8 )0000000
(p-val)(NA )(NA )(NA )(NA )(NA )(NA )(NA )
Estimates ( 9 )NANANANANANANA
(p-val)(NA )(NA )(NA )(NA )(NA )(NA )(NA )
Estimates ( 10 )NANANANANANANA
(p-val)(NA )(NA )(NA )(NA )(NA )(NA )(NA )
Estimates ( 11 )NANANANANANANA
(p-val)(NA )(NA )(NA )(NA )(NA )(NA )(NA )
Estimates ( 12 )NANANANANANANA
(p-val)(NA )(NA )(NA )(NA )(NA )(NA )(NA )
Estimates ( 13 )NANANANANANANA
(p-val)(NA )(NA )(NA )(NA )(NA )(NA )(NA )


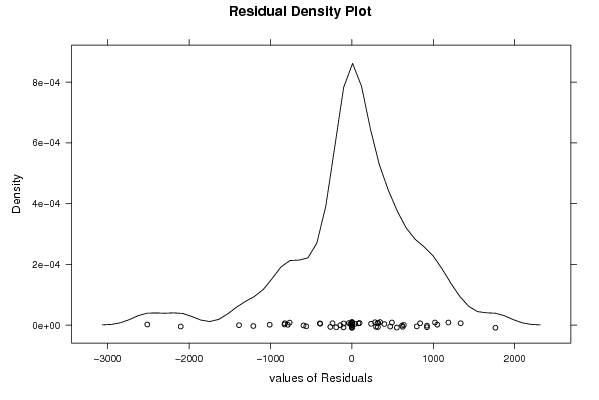
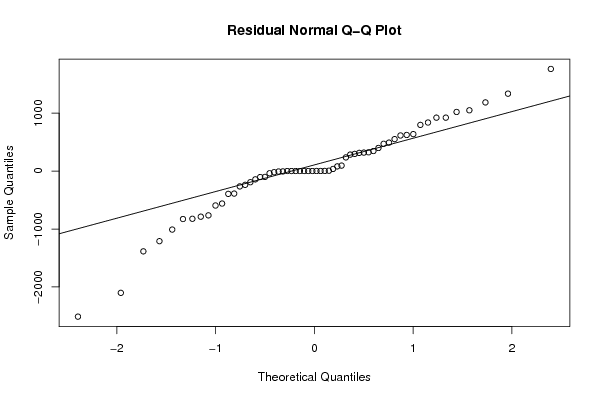
Estimated ARIMA Residuals
Value
-37.7158683639054
319.117252231124
-237.574112232736
-142.522520820826
551.824395043707
623.705237722264
-19.1768574069363
-192.015143741632
296.556105828577
471.403216646523
399.260404192545
922.236436133245
838.387759694238
235.959009385467
-388.518303491802
797.48989464886
922.337005397064
-2513.37011101139
638.238001671914
-560.425932286751
-594.309222797243
-1009.64471964399
314.00757188695
-827.910759991615
-264.749985739387
324.244321084787
-101.086991136275
-764.387759733469
-1386.09143183803
1763.38556790382
-787.523313376672
615.097438132376
1049.54221457282
1020.93854259127
-103.108454323059
36.9366068376839
1185.64910330328
-7.68915456769355
284.471619684538
-2102.08041564735
94.6554227161578
81.3959578574595
1336.60879596280
-1210.17623114466
-393.402903507371
346.212467944366
-823.490520880692
491.536891557978

\begin{tabular}{lllllllll}
\hline
Estimated ARIMA Residuals \tabularnewline
Value \tabularnewline
-37.7158683639054 \tabularnewline
319.117252231124 \tabularnewline
-237.574112232736 \tabularnewline
-142.522520820826 \tabularnewline
551.824395043707 \tabularnewline
623.705237722264 \tabularnewline
-19.1768574069363 \tabularnewline
-192.015143741632 \tabularnewline
296.556105828577 \tabularnewline
471.403216646523 \tabularnewline
399.260404192545 \tabularnewline
922.236436133245 \tabularnewline
838.387759694238 \tabularnewline
235.959009385467 \tabularnewline
-388.518303491802 \tabularnewline
797.48989464886 \tabularnewline
922.337005397064 \tabularnewline
-2513.37011101139 \tabularnewline
638.238001671914 \tabularnewline
-560.425932286751 \tabularnewline
-594.309222797243 \tabularnewline
-1009.64471964399 \tabularnewline
314.00757188695 \tabularnewline
-827.910759991615 \tabularnewline
-264.749985739387 \tabularnewline
324.244321084787 \tabularnewline
-101.086991136275 \tabularnewline
-764.387759733469 \tabularnewline
-1386.09143183803 \tabularnewline
1763.38556790382 \tabularnewline
-787.523313376672 \tabularnewline
615.097438132376 \tabularnewline
1049.54221457282 \tabularnewline
1020.93854259127 \tabularnewline
-103.108454323059 \tabularnewline
36.9366068376839 \tabularnewline
1185.64910330328 \tabularnewline
-7.68915456769355 \tabularnewline
284.471619684538 \tabularnewline
-2102.08041564735 \tabularnewline
94.6554227161578 \tabularnewline
81.3959578574595 \tabularnewline
1336.60879596280 \tabularnewline
-1210.17623114466 \tabularnewline
-393.402903507371 \tabularnewline
346.212467944366 \tabularnewline
-823.490520880692 \tabularnewline
491.536891557978 \tabularnewline
\hline
\end{tabular}
%Source: https://freestatistics.org/blog/index.php?pk=63561&T=2

[TABLE]
[ROW][C]Estimated ARIMA Residuals[/C][/ROW]
[ROW][C]Value[/C][/ROW]
[ROW][C]-37.7158683639054[/C][/ROW]
[ROW][C]319.117252231124[/C][/ROW]
[ROW][C]-237.574112232736[/C][/ROW]
[ROW][C]-142.522520820826[/C][/ROW]
[ROW][C]551.824395043707[/C][/ROW]
[ROW][C]623.705237722264[/C][/ROW]
[ROW][C]-19.1768574069363[/C][/ROW]
[ROW][C]-192.015143741632[/C][/ROW]
[ROW][C]296.556105828577[/C][/ROW]
[ROW][C]471.403216646523[/C][/ROW]
[ROW][C]399.260404192545[/C][/ROW]
[ROW][C]922.236436133245[/C][/ROW]
[ROW][C]838.387759694238[/C][/ROW]
[ROW][C]235.959009385467[/C][/ROW]
[ROW][C]-388.518303491802[/C][/ROW]
[ROW][C]797.48989464886[/C][/ROW]
[ROW][C]922.337005397064[/C][/ROW]
[ROW][C]-2513.37011101139[/C][/ROW]
[ROW][C]638.238001671914[/C][/ROW]
[ROW][C]-560.425932286751[/C][/ROW]
[ROW][C]-594.309222797243[/C][/ROW]
[ROW][C]-1009.64471964399[/C][/ROW]
[ROW][C]314.00757188695[/C][/ROW]
[ROW][C]-827.910759991615[/C][/ROW]
[ROW][C]-264.749985739387[/C][/ROW]
[ROW][C]324.244321084787[/C][/ROW]
[ROW][C]-101.086991136275[/C][/ROW]
[ROW][C]-764.387759733469[/C][/ROW]
[ROW][C]-1386.09143183803[/C][/ROW]
[ROW][C]1763.38556790382[/C][/ROW]
[ROW][C]-787.523313376672[/C][/ROW]
[ROW][C]615.097438132376[/C][/ROW]
[ROW][C]1049.54221457282[/C][/ROW]
[ROW][C]1020.93854259127[/C][/ROW]
[ROW][C]-103.108454323059[/C][/ROW]
[ROW][C]36.9366068376839[/C][/ROW]
[ROW][C]1185.64910330328[/C][/ROW]
[ROW][C]-7.68915456769355[/C][/ROW]
[ROW][C]284.471619684538[/C][/ROW]
[ROW][C]-2102.08041564735[/C][/ROW]
[ROW][C]94.6554227161578[/C][/ROW]
[ROW][C]81.3959578574595[/C][/ROW]
[ROW][C]1336.60879596280[/C][/ROW]
[ROW][C]-1210.17623114466[/C][/ROW]
[ROW][C]-393.402903507371[/C][/ROW]
[ROW][C]346.212467944366[/C][/ROW]
[ROW][C]-823.490520880692[/C][/ROW]
[ROW][C]491.536891557978[/C][/ROW]
[/TABLE]
Source: https://freestatistics.org/blog/index.php?pk=63561&T=2

Globally Unique Identifier (entire table): ba.freestatistics.org/blog/index.php?pk=63561&T=2

As an alternative you can also use a QR Code:  

The GUIDs for individual cells are displayed in the table below:

Estimated ARIMA Residuals
Value
-37.7158683639054
319.117252231124
-237.574112232736
-142.522520820826
551.824395043707
623.705237722264
-19.1768574069363
-192.015143741632
296.556105828577
471.403216646523
399.260404192545
922.236436133245
838.387759694238
235.959009385467
-388.518303491802
797.48989464886
922.337005397064
-2513.37011101139
638.238001671914
-560.425932286751
-594.309222797243
-1009.64471964399
314.00757188695
-827.910759991615
-264.749985739387
324.244321084787
-101.086991136275
-764.387759733469
-1386.09143183803
1763.38556790382
-787.523313376672
615.097438132376
1049.54221457282
1020.93854259127
-103.108454323059
36.9366068376839
1185.64910330328
-7.68915456769355
284.471619684538
-2102.08041564735
94.6554227161578
81.3959578574595
1336.60879596280
-1210.17623114466
-393.402903507371
346.212467944366
-823.490520880692
491.536891557978


Parameters (Session):
par1 = FALSE ; par2 = 1 ; par3 = 1 ; par4 = 1 ; par5 = 12 ; par6 = 3 ; par7 = 1 ; par8 = 2 ; par9 = 1 ;
Parameters (R input):
par1 = FALSE ; par2 = 1 ; par3 = 1 ; par4 = 1 ; par5 = 12 ; par6 = 3 ; par7 = 1 ; par8 = 2 ; par9 = 1 ;
R code (references can be found in the software module):
library(lattice)
if (par1 == 'TRUE') par1 <- TRUE
if (par1 == 'FALSE') par1 <- FALSE
par2 <- as.numeric(par2) #Box-Cox lambda transformation parameter
par3 <- as.numeric(par3) #degree of non-seasonal differencing
par4 <- as.numeric(par4) #degree of seasonal differencing
par5 <- as.numeric(par5) #seasonal period
par6 <- as.numeric(par6) #degree (p) of the non-seasonal AR(p) polynomial
par7 <- as.numeric(par7) #degree (q) of the non-seasonal MA(q) polynomial
par8 <- as.numeric(par8) #degree (P) of the seasonal AR(P) polynomial
par9 <- as.numeric(par9) #degree (Q) of the seasonal MA(Q) polynomial
armaGR <- function(arima.out, names, n){
try1 <- arima.out$coef
try2 <- sqrt(diag(arima.out$var.coef))
try.data.frame <- data.frame(matrix(NA,ncol=4,nrow=length(names)))
dimnames(try.data.frame) <- list(names,c('coef','std','tstat','pv'))
try.data.frame[,1] <- try1
for(i in 1:length(try2)) try.data.frame[which(rownames(try.data.frame)==names(try2)[i]),2] <- try2[i]
try.data.frame[,3] <- try.data.frame[,1] / try.data.frame[,2]
try.data.frame[,4] <- round((1-pt(abs(try.data.frame[,3]),df=n-(length(try2)+1)))*2,5)
vector <- rep(NA,length(names))
vector[is.na(try.data.frame[,4])] <- 0
maxi <- which.max(try.data.frame[,4])
continue <- max(try.data.frame[,4],na.rm=TRUE) > .05
vector[maxi] <- 0
list(summary=try.data.frame,next.vector=vector,continue=continue)
}
arimaSelect <- function(series, order=c(13,0,0), seasonal=list(order=c(2,0,0),period=12), include.mean=F){
nrc <- order[1]+order[3]+seasonal$order[1]+seasonal$order[3]
coeff <- matrix(NA, nrow=nrc*2, ncol=nrc)
pval <- matrix(NA, nrow=nrc*2, ncol=nrc)
mylist <- rep(list(NULL), nrc)
names <- NULL
if(order[1] > 0) names <- paste('ar',1:order[1],sep='')
if(order[3] > 0) names <- c( names , paste('ma',1:order[3],sep='') )
if(seasonal$order[1] > 0) names <- c(names, paste('sar',1:seasonal$order[1],sep=''))
if(seasonal$order[3] > 0) names <- c(names, paste('sma',1:seasonal$order[3],sep=''))
arima.out <- arima(series, order=order, seasonal=seasonal, include.mean=include.mean, method='ML')
mylist[[1]] <- arima.out
last.arma <- armaGR(arima.out, names, length(series))
mystop <- FALSE
i <- 1
coeff[i,] <- last.arma[[1]][,1]
pval [i,] <- last.arma[[1]][,4]
i <- 2
aic <- arima.out$aic
while(!mystop){
mylist[[i]] <- arima.out
arima.out <- arima(series, order=order, seasonal=seasonal, include.mean=include.mean, method='ML', fixed=last.arma$next.vector)
aic <- c(aic, arima.out$aic)
last.arma <- armaGR(arima.out, names, length(series))
mystop <- !last.arma$continue
coeff[i,] <- last.arma[[1]][,1]
pval [i,] <- last.arma[[1]][,4]
i <- i+1
}
list(coeff, pval, mylist, aic=aic)
}
arimaSelectplot <- function(arimaSelect.out,noms,choix){
noms <- names(arimaSelect.out[[3]][[1]]$coef)
coeff <- arimaSelect.out[[1]]
k <- min(which(is.na(coeff[,1])))-1
coeff <- coeff[1:k,]
pval <- arimaSelect.out[[2]][1:k,]
aic <- arimaSelect.out$aic[1:k]
coeff[coeff==0] <- NA
n <- ncol(coeff)
if(missing(choix)) choix <- k
layout(matrix(c(1,1,1,2,
3,3,3,2,
3,3,3,4,
5,6,7,7),nr=4),
widths=c(10,35,45,15),
heights=c(30,30,15,15))
couleurs <- rainbow(75)[1:50]#(50)
ticks <- pretty(coeff)
par(mar=c(1,1,3,1))
plot(aic,k:1-.5,type='o',pch=21,bg='blue',cex=2,axes=F,lty=2,xpd=NA)
points(aic[choix],k-choix+.5,pch=21,cex=4,bg=2,xpd=NA)
title('aic',line=2)
par(mar=c(3,0,0,0))
plot(0,axes=F,xlab='',ylab='',xlim=range(ticks),ylim=c(.1,1))
rect(xleft = min(ticks) + (0:49)/50*(max(ticks)-min(ticks)),
xright = min(ticks) + (1:50)/50*(max(ticks)-min(ticks)),
ytop = rep(1,50),
ybottom= rep(0,50),col=couleurs,border=NA)
axis(1,ticks)
rect(xleft=min(ticks),xright=max(ticks),ytop=1,ybottom=0)
text(mean(coeff,na.rm=T),.5,'coefficients',cex=2,font=2)
par(mar=c(1,1,3,1))
image(1:n,1:k,t(coeff[k:1,]),axes=F,col=couleurs,zlim=range(ticks))
for(i in 1:n) for(j in 1:k) if(!is.na(coeff[j,i])) {
if(pval[j,i]<.01) symb = 'green'
else if( (pval[j,i]<.05) & (pval[j,i]>=.01)) symb = 'orange'
else if( (pval[j,i]<.1) & (pval[j,i]>=.05)) symb = 'red'
else symb = 'black'
polygon(c(i+.5 ,i+.2 ,i+.5 ,i+.5),
c(k-j+0.5,k-j+0.5,k-j+0.8,k-j+0.5),
col=symb)
if(j==choix) {
rect(xleft=i-.5,
xright=i+.5,
ybottom=k-j+1.5,
ytop=k-j+.5,
lwd=4)
text(i,
k-j+1,
round(coeff[j,i],2),
cex=1.2,
font=2)
}
else{
rect(xleft=i-.5,xright=i+.5,ybottom=k-j+1.5,ytop=k-j+.5)
text(i,k-j+1,round(coeff[j,i],2),cex=1.2,font=1)
}
}
axis(3,1:n,noms)
par(mar=c(0.5,0,0,0.5))
plot(0,axes=F,xlab='',ylab='',type='n',xlim=c(0,8),ylim=c(-.2,.8))
cols <- c('green','orange','red','black')
niv <- c('0','0.01','0.05','0.1')
for(i in 0:3){
polygon(c(1+2*i ,1+2*i ,1+2*i-.5 ,1+2*i),
c(.4 ,.7 , .4 , .4),
col=cols[i+1])
text(2*i,0.5,niv[i+1],cex=1.5)
}
text(8,.5,1,cex=1.5)
text(4,0,'p-value',cex=2)
box()
residus <- arimaSelect.out[[3]][[choix]]$res
par(mar=c(1,2,4,1))
acf(residus,main='')
title('acf',line=.5)
par(mar=c(1,2,4,1))
pacf(residus,main='')
title('pacf',line=.5)
par(mar=c(2,2,4,1))
qqnorm(residus,main='')
title('qq-norm',line=.5)
qqline(residus)
residus
}
if (par2 == 0) x <- log(x)
if (par2 != 0) x <- x^par2
(selection <- arimaSelect(x, order=c(par6,par3,par7), seasonal=list(order=c(par8,par4,par9), period=par5)))
bitmap(file='test1.png')
resid <- arimaSelectplot(selection)
dev.off()
resid
bitmap(file='test2.png')
acf(resid,length(resid)/2, main='Residual Autocorrelation Function')
dev.off()
bitmap(file='test3.png')
pacf(resid,length(resid)/2, main='Residual Partial Autocorrelation Function')
dev.off()
bitmap(file='test4.png')
cpgram(resid, main='Residual Cumulative Periodogram')
dev.off()
bitmap(file='test5.png')
hist(resid, main='Residual Histogram', xlab='values of Residuals')
dev.off()
bitmap(file='test6.png')
densityplot(~resid,col='black',main='Residual Density Plot', xlab='values of Residuals')
dev.off()
bitmap(file='test7.png')
qqnorm(resid, main='Residual Normal Q-Q Plot')
qqline(resid)
dev.off()
ncols <- length(selection[[1]][1,])
nrows <- length(selection[[2]][,1])-1
load(file='createtable')
a<-table.start()
a<-table.row.start(a)
a<-table.element(a,'ARIMA Parameter Estimation and Backward Selection', ncols+1,TRUE)
a<-table.row.end(a)
a<-table.row.start(a)
a<-table.element(a,'Iteration', header=TRUE)
for (i in 1:ncols) {
a<-table.element(a,names(selection[[3]][[1]]$coef)[i],header=TRUE)
}
a<-table.row.end(a)
for (j in 1:nrows) {
a<-table.row.start(a)
mydum <- 'Estimates ('
mydum <- paste(mydum,j)
mydum <- paste(mydum,')')
a<-table.element(a,mydum, header=TRUE)
for (i in 1:ncols) {
a<-table.element(a,round(selection[[1]][j,i],4))
}
a<-table.row.end(a)
a<-table.row.start(a)
a<-table.element(a,'(p-val)', header=TRUE)
for (i in 1:ncols) {
mydum <- '('
mydum <- paste(mydum,round(selection[[2]][j,i],4),sep='')
mydum <- paste(mydum,')')
a<-table.element(a,mydum)
}
a<-table.row.end(a)
}
a<-table.end(a)
table.save(a,file='mytable.tab')
a<-table.start()
a<-table.row.start(a)
a<-table.element(a,'Estimated ARIMA Residuals', 1,TRUE)
a<-table.row.end(a)
a<-table.row.start(a)
a<-table.element(a,'Value', 1,TRUE)
a<-table.row.end(a)
for (i in (par4*par5+par3):length(resid)) {
a<-table.row.start(a)
a<-table.element(a,resid[i])
a<-table.row.end(a)
}
a<-table.end(a)
table.save(a,file='mytable1.tab')