Free Statistics

of Irreproducible Research!

Author's title

Author*The author of this computation has been verified*
R Software Modulerwasp_autocorrelation.wasp
Title produced by software(Partial) Autocorrelation Function
Date of computationFri, 04 Dec 2009 07:11:23 -0700
Cite this page as followsStatistical Computations at FreeStatistics.org, Office for Research Development and Education, URL https://freestatistics.org/blog/index.php?v=date/2009/Dec/04/t1259935920rdffquymsli3n92.htm/, Retrieved Sun, 28 Apr 2024 14:22:47 +0000
Statistical Computations at FreeStatistics.org, Office for Research Development and Education, URL https://freestatistics.org/blog/index.php?pk=63564, Retrieved Sun, 28 Apr 2024 14:22:47 +0000
QR Codes:

Original text written by user:
IsPrivate?No (this computation is public)
User-defined keywords
Estimated Impact121
Family? (F = Feedback message, R = changed R code, M = changed R Module, P = changed Parameters, D = changed Data)
-     [Univariate Data Series] [data set] [2008-12-01 19:54:57] [b98453cac15ba1066b407e146608df68]
- RMP   [(Partial) Autocorrelation Function] [] [2009-11-27 14:46:03] [b98453cac15ba1066b407e146608df68]
-   PD      [(Partial) Autocorrelation Function] [WS 9: Correlatie ...] [2009-12-04 14:11:23] [ac86848d66148c9c4c9404e0c9a511eb] [Current]
Feedback Forum

Post a new message
Dataseries X:
79.8
83.4
113.6
112.9
104
109.9
99
106.3
128.9
111.1
102.9
130
87
87.5
117.6
103.4
110.8
112.6
102.5
112.4
135.6
105.1
127.7
137
91
90.5
122.4
123.3
124.3
120
118.1
119
142.7
123.6
129.6
151.6
110.4
99.2
130.5
136.2
129.7
128
121.6
135.8
143.8
147.5
136.2
156.6
123.3
104.5
139.8
136.5
112.1
118.5
94.4
102.3
111.4
99.2
87.8
115.8


Summary of computational transaction
Raw Inputview raw input (R code)
Raw Outputview raw output of R engine
Computing time2 seconds
R Server'Gwilym Jenkins' @ 72.249.127.135

\begin{tabular}{lllllllll}
\hline
Summary of computational transaction \tabularnewline
Raw Input & view raw input (R code)  \tabularnewline
Raw Output & view raw output of R engine  \tabularnewline
Computing time & 2 seconds \tabularnewline
R Server & 'Gwilym Jenkins' @ 72.249.127.135 \tabularnewline
\hline
\end{tabular}
%Source: https://freestatistics.org/blog/index.php?pk=63564&T=0

[TABLE]
[ROW][C]Summary of computational transaction[/C][/ROW]
[ROW][C]Raw Input[/C][C]view raw input (R code) [/C][/ROW]
[ROW][C]Raw Output[/C][C]view raw output of R engine [/C][/ROW]
[ROW][C]Computing time[/C][C]2 seconds[/C][/ROW]
[ROW][C]R Server[/C][C]'Gwilym Jenkins' @ 72.249.127.135[/C][/ROW]
[/TABLE]
Source: https://freestatistics.org/blog/index.php?pk=63564&T=0

Globally Unique Identifier (entire table): ba.freestatistics.org/blog/index.php?pk=63564&T=0

As an alternative you can also use a QR Code:  

The GUIDs for individual cells are displayed in the table below:

Summary of computational transaction
Raw Inputview raw input (R code)
Raw Outputview raw output of R engine
Computing time2 seconds
R Server'Gwilym Jenkins' @ 72.249.127.135


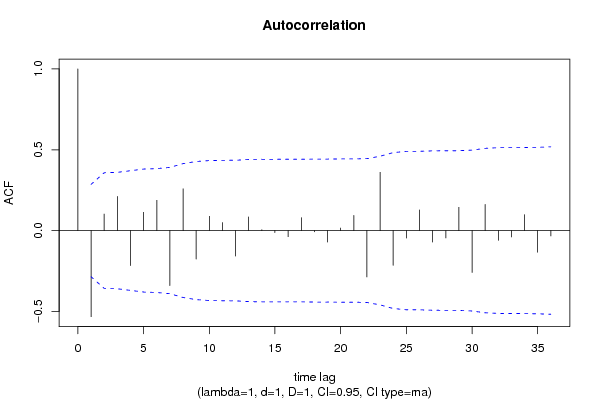
Autocorrelation Function
Time lag kACF(k)T-STATP-value
1-0.532731-3.65220.000326
20.1021230.70010.243652
30.2114991.450.076855
4-0.216769-1.48610.071966
50.112940.77430.221321
60.1875351.28570.102427
7-0.340732-2.33590.011906
80.2580271.76890.041696
9-0.176443-1.20960.116235
100.088470.60650.273545
110.0492470.33760.368577
12-0.158115-1.0840.141952
130.0843030.5780.283027
140.0054130.03710.485277
15-0.012602-0.08640.465759
16-0.038009-0.26060.39778
170.0798020.54710.293451
18-0.007528-0.05160.47953
19-0.071222-0.48830.313814
200.0157350.10790.457277
210.0939390.6440.261349
22-0.286844-1.96650.027581
230.3603782.47060.008585
24-0.215399-1.47670.073213
25-0.04682-0.3210.374823
260.1272450.87230.193728
27-0.07119-0.48810.31389
28-0.045743-0.31360.377608
290.1439070.98660.164452
30-0.259539-1.77930.040828
310.1619991.11060.136194
32-0.060378-0.41390.340404
33-0.039509-0.27090.393843
340.098280.67380.251878
35-0.133868-0.91780.181717
36-0.033654-0.23070.409268

\begin{tabular}{lllllllll}
\hline
Autocorrelation Function \tabularnewline
Time lag k & ACF(k) & T-STAT & P-value \tabularnewline
1 & -0.532731 & -3.6522 & 0.000326 \tabularnewline
2 & 0.102123 & 0.7001 & 0.243652 \tabularnewline
3 & 0.211499 & 1.45 & 0.076855 \tabularnewline
4 & -0.216769 & -1.4861 & 0.071966 \tabularnewline
5 & 0.11294 & 0.7743 & 0.221321 \tabularnewline
6 & 0.187535 & 1.2857 & 0.102427 \tabularnewline
7 & -0.340732 & -2.3359 & 0.011906 \tabularnewline
8 & 0.258027 & 1.7689 & 0.041696 \tabularnewline
9 & -0.176443 & -1.2096 & 0.116235 \tabularnewline
10 & 0.08847 & 0.6065 & 0.273545 \tabularnewline
11 & 0.049247 & 0.3376 & 0.368577 \tabularnewline
12 & -0.158115 & -1.084 & 0.141952 \tabularnewline
13 & 0.084303 & 0.578 & 0.283027 \tabularnewline
14 & 0.005413 & 0.0371 & 0.485277 \tabularnewline
15 & -0.012602 & -0.0864 & 0.465759 \tabularnewline
16 & -0.038009 & -0.2606 & 0.39778 \tabularnewline
17 & 0.079802 & 0.5471 & 0.293451 \tabularnewline
18 & -0.007528 & -0.0516 & 0.47953 \tabularnewline
19 & -0.071222 & -0.4883 & 0.313814 \tabularnewline
20 & 0.015735 & 0.1079 & 0.457277 \tabularnewline
21 & 0.093939 & 0.644 & 0.261349 \tabularnewline
22 & -0.286844 & -1.9665 & 0.027581 \tabularnewline
23 & 0.360378 & 2.4706 & 0.008585 \tabularnewline
24 & -0.215399 & -1.4767 & 0.073213 \tabularnewline
25 & -0.04682 & -0.321 & 0.374823 \tabularnewline
26 & 0.127245 & 0.8723 & 0.193728 \tabularnewline
27 & -0.07119 & -0.4881 & 0.31389 \tabularnewline
28 & -0.045743 & -0.3136 & 0.377608 \tabularnewline
29 & 0.143907 & 0.9866 & 0.164452 \tabularnewline
30 & -0.259539 & -1.7793 & 0.040828 \tabularnewline
31 & 0.161999 & 1.1106 & 0.136194 \tabularnewline
32 & -0.060378 & -0.4139 & 0.340404 \tabularnewline
33 & -0.039509 & -0.2709 & 0.393843 \tabularnewline
34 & 0.09828 & 0.6738 & 0.251878 \tabularnewline
35 & -0.133868 & -0.9178 & 0.181717 \tabularnewline
36 & -0.033654 & -0.2307 & 0.409268 \tabularnewline
\hline
\end{tabular}
%Source: https://freestatistics.org/blog/index.php?pk=63564&T=1

[TABLE]
[ROW][C]Autocorrelation Function[/C][/ROW]
[ROW][C]Time lag k[/C][C]ACF(k)[/C][C]T-STAT[/C][C]P-value[/C][/ROW]
[ROW][C]1[/C][C]-0.532731[/C][C]-3.6522[/C][C]0.000326[/C][/ROW]
[ROW][C]2[/C][C]0.102123[/C][C]0.7001[/C][C]0.243652[/C][/ROW]
[ROW][C]3[/C][C]0.211499[/C][C]1.45[/C][C]0.076855[/C][/ROW]
[ROW][C]4[/C][C]-0.216769[/C][C]-1.4861[/C][C]0.071966[/C][/ROW]
[ROW][C]5[/C][C]0.11294[/C][C]0.7743[/C][C]0.221321[/C][/ROW]
[ROW][C]6[/C][C]0.187535[/C][C]1.2857[/C][C]0.102427[/C][/ROW]
[ROW][C]7[/C][C]-0.340732[/C][C]-2.3359[/C][C]0.011906[/C][/ROW]
[ROW][C]8[/C][C]0.258027[/C][C]1.7689[/C][C]0.041696[/C][/ROW]
[ROW][C]9[/C][C]-0.176443[/C][C]-1.2096[/C][C]0.116235[/C][/ROW]
[ROW][C]10[/C][C]0.08847[/C][C]0.6065[/C][C]0.273545[/C][/ROW]
[ROW][C]11[/C][C]0.049247[/C][C]0.3376[/C][C]0.368577[/C][/ROW]
[ROW][C]12[/C][C]-0.158115[/C][C]-1.084[/C][C]0.141952[/C][/ROW]
[ROW][C]13[/C][C]0.084303[/C][C]0.578[/C][C]0.283027[/C][/ROW]
[ROW][C]14[/C][C]0.005413[/C][C]0.0371[/C][C]0.485277[/C][/ROW]
[ROW][C]15[/C][C]-0.012602[/C][C]-0.0864[/C][C]0.465759[/C][/ROW]
[ROW][C]16[/C][C]-0.038009[/C][C]-0.2606[/C][C]0.39778[/C][/ROW]
[ROW][C]17[/C][C]0.079802[/C][C]0.5471[/C][C]0.293451[/C][/ROW]
[ROW][C]18[/C][C]-0.007528[/C][C]-0.0516[/C][C]0.47953[/C][/ROW]
[ROW][C]19[/C][C]-0.071222[/C][C]-0.4883[/C][C]0.313814[/C][/ROW]
[ROW][C]20[/C][C]0.015735[/C][C]0.1079[/C][C]0.457277[/C][/ROW]
[ROW][C]21[/C][C]0.093939[/C][C]0.644[/C][C]0.261349[/C][/ROW]
[ROW][C]22[/C][C]-0.286844[/C][C]-1.9665[/C][C]0.027581[/C][/ROW]
[ROW][C]23[/C][C]0.360378[/C][C]2.4706[/C][C]0.008585[/C][/ROW]
[ROW][C]24[/C][C]-0.215399[/C][C]-1.4767[/C][C]0.073213[/C][/ROW]
[ROW][C]25[/C][C]-0.04682[/C][C]-0.321[/C][C]0.374823[/C][/ROW]
[ROW][C]26[/C][C]0.127245[/C][C]0.8723[/C][C]0.193728[/C][/ROW]
[ROW][C]27[/C][C]-0.07119[/C][C]-0.4881[/C][C]0.31389[/C][/ROW]
[ROW][C]28[/C][C]-0.045743[/C][C]-0.3136[/C][C]0.377608[/C][/ROW]
[ROW][C]29[/C][C]0.143907[/C][C]0.9866[/C][C]0.164452[/C][/ROW]
[ROW][C]30[/C][C]-0.259539[/C][C]-1.7793[/C][C]0.040828[/C][/ROW]
[ROW][C]31[/C][C]0.161999[/C][C]1.1106[/C][C]0.136194[/C][/ROW]
[ROW][C]32[/C][C]-0.060378[/C][C]-0.4139[/C][C]0.340404[/C][/ROW]
[ROW][C]33[/C][C]-0.039509[/C][C]-0.2709[/C][C]0.393843[/C][/ROW]
[ROW][C]34[/C][C]0.09828[/C][C]0.6738[/C][C]0.251878[/C][/ROW]
[ROW][C]35[/C][C]-0.133868[/C][C]-0.9178[/C][C]0.181717[/C][/ROW]
[ROW][C]36[/C][C]-0.033654[/C][C]-0.2307[/C][C]0.409268[/C][/ROW]
[/TABLE]
Source: https://freestatistics.org/blog/index.php?pk=63564&T=1

Globally Unique Identifier (entire table): ba.freestatistics.org/blog/index.php?pk=63564&T=1

As an alternative you can also use a QR Code:  

The GUIDs for individual cells are displayed in the table below:

Autocorrelation Function
Time lag kACF(k)T-STATP-value
1-0.532731-3.65220.000326
20.1021230.70010.243652
30.2114991.450.076855
4-0.216769-1.48610.071966
50.112940.77430.221321
60.1875351.28570.102427
7-0.340732-2.33590.011906
80.2580271.76890.041696
9-0.176443-1.20960.116235
100.088470.60650.273545
110.0492470.33760.368577
12-0.158115-1.0840.141952
130.0843030.5780.283027
140.0054130.03710.485277
15-0.012602-0.08640.465759
16-0.038009-0.26060.39778
170.0798020.54710.293451
18-0.007528-0.05160.47953
19-0.071222-0.48830.313814
200.0157350.10790.457277
210.0939390.6440.261349
22-0.286844-1.96650.027581
230.3603782.47060.008585
24-0.215399-1.47670.073213
25-0.04682-0.3210.374823
260.1272450.87230.193728
27-0.07119-0.48810.31389
28-0.045743-0.31360.377608
290.1439070.98660.164452
30-0.259539-1.77930.040828
310.1619991.11060.136194
32-0.060378-0.41390.340404
33-0.039509-0.27090.393843
340.098280.67380.251878
35-0.133868-0.91780.181717
36-0.033654-0.23070.409268


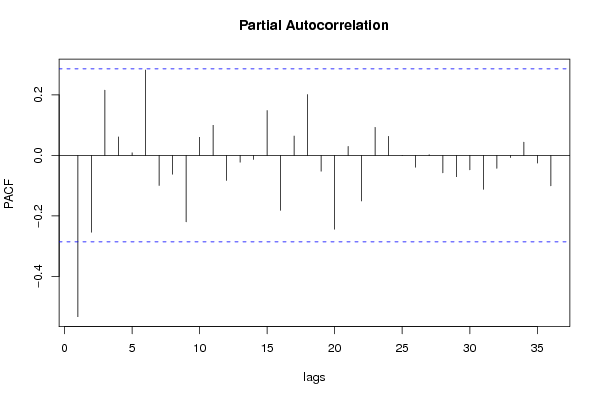
Partial Autocorrelation Function
Time lag kPACF(k)T-STATP-value
1-0.532731-3.65220.000326
2-0.253672-1.73910.044283
30.2157331.4790.072907
40.0610870.41880.338639
50.0088320.06050.475988
60.2823371.93560.029472
7-0.09921-0.68020.249873
8-0.062021-0.42520.336318
9-0.219389-1.50410.069629
100.0600850.41190.341135
110.0995220.68230.249203
12-0.082426-0.56510.287351
13-0.02222-0.15230.439789
14-0.013006-0.08920.464664
150.1484131.01750.15707
16-0.18124-1.24250.110104
170.0640950.43940.331187
180.2013321.38030.087018
19-0.052078-0.3570.361335
20-0.243632-1.67030.050758
210.0299380.20520.419134
22-0.150248-1.03010.154129
230.0928030.63620.263857
240.0630630.43230.333737
25-0.000223-0.00150.499395
26-0.03879-0.26590.395728
270.0025980.01780.492932
28-0.057186-0.3920.348398
29-0.070013-0.480.316732
30-0.047635-0.32660.372721
31-0.111854-0.76680.223508
32-0.042454-0.29110.386146
33-0.006966-0.04780.481056
340.0436740.29940.382972
35-0.025084-0.1720.4321
36-0.100383-0.68820.247358

\begin{tabular}{lllllllll}
\hline
Partial Autocorrelation Function \tabularnewline
Time lag k & PACF(k) & T-STAT & P-value \tabularnewline
1 & -0.532731 & -3.6522 & 0.000326 \tabularnewline
2 & -0.253672 & -1.7391 & 0.044283 \tabularnewline
3 & 0.215733 & 1.479 & 0.072907 \tabularnewline
4 & 0.061087 & 0.4188 & 0.338639 \tabularnewline
5 & 0.008832 & 0.0605 & 0.475988 \tabularnewline
6 & 0.282337 & 1.9356 & 0.029472 \tabularnewline
7 & -0.09921 & -0.6802 & 0.249873 \tabularnewline
8 & -0.062021 & -0.4252 & 0.336318 \tabularnewline
9 & -0.219389 & -1.5041 & 0.069629 \tabularnewline
10 & 0.060085 & 0.4119 & 0.341135 \tabularnewline
11 & 0.099522 & 0.6823 & 0.249203 \tabularnewline
12 & -0.082426 & -0.5651 & 0.287351 \tabularnewline
13 & -0.02222 & -0.1523 & 0.439789 \tabularnewline
14 & -0.013006 & -0.0892 & 0.464664 \tabularnewline
15 & 0.148413 & 1.0175 & 0.15707 \tabularnewline
16 & -0.18124 & -1.2425 & 0.110104 \tabularnewline
17 & 0.064095 & 0.4394 & 0.331187 \tabularnewline
18 & 0.201332 & 1.3803 & 0.087018 \tabularnewline
19 & -0.052078 & -0.357 & 0.361335 \tabularnewline
20 & -0.243632 & -1.6703 & 0.050758 \tabularnewline
21 & 0.029938 & 0.2052 & 0.419134 \tabularnewline
22 & -0.150248 & -1.0301 & 0.154129 \tabularnewline
23 & 0.092803 & 0.6362 & 0.263857 \tabularnewline
24 & 0.063063 & 0.4323 & 0.333737 \tabularnewline
25 & -0.000223 & -0.0015 & 0.499395 \tabularnewline
26 & -0.03879 & -0.2659 & 0.395728 \tabularnewline
27 & 0.002598 & 0.0178 & 0.492932 \tabularnewline
28 & -0.057186 & -0.392 & 0.348398 \tabularnewline
29 & -0.070013 & -0.48 & 0.316732 \tabularnewline
30 & -0.047635 & -0.3266 & 0.372721 \tabularnewline
31 & -0.111854 & -0.7668 & 0.223508 \tabularnewline
32 & -0.042454 & -0.2911 & 0.386146 \tabularnewline
33 & -0.006966 & -0.0478 & 0.481056 \tabularnewline
34 & 0.043674 & 0.2994 & 0.382972 \tabularnewline
35 & -0.025084 & -0.172 & 0.4321 \tabularnewline
36 & -0.100383 & -0.6882 & 0.247358 \tabularnewline
\hline
\end{tabular}
%Source: https://freestatistics.org/blog/index.php?pk=63564&T=2

[TABLE]
[ROW][C]Partial Autocorrelation Function[/C][/ROW]
[ROW][C]Time lag k[/C][C]PACF(k)[/C][C]T-STAT[/C][C]P-value[/C][/ROW]
[ROW][C]1[/C][C]-0.532731[/C][C]-3.6522[/C][C]0.000326[/C][/ROW]
[ROW][C]2[/C][C]-0.253672[/C][C]-1.7391[/C][C]0.044283[/C][/ROW]
[ROW][C]3[/C][C]0.215733[/C][C]1.479[/C][C]0.072907[/C][/ROW]
[ROW][C]4[/C][C]0.061087[/C][C]0.4188[/C][C]0.338639[/C][/ROW]
[ROW][C]5[/C][C]0.008832[/C][C]0.0605[/C][C]0.475988[/C][/ROW]
[ROW][C]6[/C][C]0.282337[/C][C]1.9356[/C][C]0.029472[/C][/ROW]
[ROW][C]7[/C][C]-0.09921[/C][C]-0.6802[/C][C]0.249873[/C][/ROW]
[ROW][C]8[/C][C]-0.062021[/C][C]-0.4252[/C][C]0.336318[/C][/ROW]
[ROW][C]9[/C][C]-0.219389[/C][C]-1.5041[/C][C]0.069629[/C][/ROW]
[ROW][C]10[/C][C]0.060085[/C][C]0.4119[/C][C]0.341135[/C][/ROW]
[ROW][C]11[/C][C]0.099522[/C][C]0.6823[/C][C]0.249203[/C][/ROW]
[ROW][C]12[/C][C]-0.082426[/C][C]-0.5651[/C][C]0.287351[/C][/ROW]
[ROW][C]13[/C][C]-0.02222[/C][C]-0.1523[/C][C]0.439789[/C][/ROW]
[ROW][C]14[/C][C]-0.013006[/C][C]-0.0892[/C][C]0.464664[/C][/ROW]
[ROW][C]15[/C][C]0.148413[/C][C]1.0175[/C][C]0.15707[/C][/ROW]
[ROW][C]16[/C][C]-0.18124[/C][C]-1.2425[/C][C]0.110104[/C][/ROW]
[ROW][C]17[/C][C]0.064095[/C][C]0.4394[/C][C]0.331187[/C][/ROW]
[ROW][C]18[/C][C]0.201332[/C][C]1.3803[/C][C]0.087018[/C][/ROW]
[ROW][C]19[/C][C]-0.052078[/C][C]-0.357[/C][C]0.361335[/C][/ROW]
[ROW][C]20[/C][C]-0.243632[/C][C]-1.6703[/C][C]0.050758[/C][/ROW]
[ROW][C]21[/C][C]0.029938[/C][C]0.2052[/C][C]0.419134[/C][/ROW]
[ROW][C]22[/C][C]-0.150248[/C][C]-1.0301[/C][C]0.154129[/C][/ROW]
[ROW][C]23[/C][C]0.092803[/C][C]0.6362[/C][C]0.263857[/C][/ROW]
[ROW][C]24[/C][C]0.063063[/C][C]0.4323[/C][C]0.333737[/C][/ROW]
[ROW][C]25[/C][C]-0.000223[/C][C]-0.0015[/C][C]0.499395[/C][/ROW]
[ROW][C]26[/C][C]-0.03879[/C][C]-0.2659[/C][C]0.395728[/C][/ROW]
[ROW][C]27[/C][C]0.002598[/C][C]0.0178[/C][C]0.492932[/C][/ROW]
[ROW][C]28[/C][C]-0.057186[/C][C]-0.392[/C][C]0.348398[/C][/ROW]
[ROW][C]29[/C][C]-0.070013[/C][C]-0.48[/C][C]0.316732[/C][/ROW]
[ROW][C]30[/C][C]-0.047635[/C][C]-0.3266[/C][C]0.372721[/C][/ROW]
[ROW][C]31[/C][C]-0.111854[/C][C]-0.7668[/C][C]0.223508[/C][/ROW]
[ROW][C]32[/C][C]-0.042454[/C][C]-0.2911[/C][C]0.386146[/C][/ROW]
[ROW][C]33[/C][C]-0.006966[/C][C]-0.0478[/C][C]0.481056[/C][/ROW]
[ROW][C]34[/C][C]0.043674[/C][C]0.2994[/C][C]0.382972[/C][/ROW]
[ROW][C]35[/C][C]-0.025084[/C][C]-0.172[/C][C]0.4321[/C][/ROW]
[ROW][C]36[/C][C]-0.100383[/C][C]-0.6882[/C][C]0.247358[/C][/ROW]
[/TABLE]
Source: https://freestatistics.org/blog/index.php?pk=63564&T=2

Globally Unique Identifier (entire table): ba.freestatistics.org/blog/index.php?pk=63564&T=2

As an alternative you can also use a QR Code:  

The GUIDs for individual cells are displayed in the table below:

Partial Autocorrelation Function
Time lag kPACF(k)T-STATP-value
1-0.532731-3.65220.000326
2-0.253672-1.73910.044283
30.2157331.4790.072907
40.0610870.41880.338639
50.0088320.06050.475988
60.2823371.93560.029472
7-0.09921-0.68020.249873
8-0.062021-0.42520.336318
9-0.219389-1.50410.069629
100.0600850.41190.341135
110.0995220.68230.249203
12-0.082426-0.56510.287351
13-0.02222-0.15230.439789
14-0.013006-0.08920.464664
150.1484131.01750.15707
16-0.18124-1.24250.110104
170.0640950.43940.331187
180.2013321.38030.087018
19-0.052078-0.3570.361335
20-0.243632-1.67030.050758
210.0299380.20520.419134
22-0.150248-1.03010.154129
230.0928030.63620.263857
240.0630630.43230.333737
25-0.000223-0.00150.499395
26-0.03879-0.26590.395728
270.0025980.01780.492932
28-0.057186-0.3920.348398
29-0.070013-0.480.316732
30-0.047635-0.32660.372721
31-0.111854-0.76680.223508
32-0.042454-0.29110.386146
33-0.006966-0.04780.481056
340.0436740.29940.382972
35-0.025084-0.1720.4321
36-0.100383-0.68820.247358


Parameters (Session):
par1 = 36 ; par2 = 1 ; par3 = 1 ; par4 = 1 ; par5 = 12 ; par6 = MA ; par7 = 0.95 ;
Parameters (R input):
par1 = 36 ; par2 = 1 ; par3 = 1 ; par4 = 1 ; par5 = 12 ; par6 = MA ; par7 = 0.95 ;
R code (references can be found in the software module):
if (par1 == 'Default') {
par1 = 10*log10(length(x))
} else {
par1 <- as.numeric(par1)
}
par2 <- as.numeric(par2)
par3 <- as.numeric(par3)
par4 <- as.numeric(par4)
par5 <- as.numeric(par5)
if (par6 == 'White Noise') par6 <- 'white' else par6 <- 'ma'
par7 <- as.numeric(par7)
if (par2 == 0) {
x <- log(x)
} else {
x <- (x ^ par2 - 1) / par2
}
if (par3 > 0) x <- diff(x,lag=1,difference=par3)
if (par4 > 0) x <- diff(x,lag=par5,difference=par4)
bitmap(file='pic1.png')
racf <- acf(x, par1, main='Autocorrelation', xlab='time lag', ylab='ACF', ci.type=par6, ci=par7, sub=paste('(lambda=',par2,', d=',par3,', D=',par4,', CI=', par7, ', CI type=',par6,')',sep=''))
dev.off()
bitmap(file='pic2.png')
rpacf <- pacf(x,par1,main='Partial Autocorrelation',xlab='lags',ylab='PACF')
dev.off()
(myacf <- c(racf$acf))
(mypacf <- c(rpacf$acf))
lengthx <- length(x)
sqrtn <- sqrt(lengthx)
load(file='createtable')
a<-table.start()
a<-table.row.start(a)
a<-table.element(a,'Autocorrelation Function',4,TRUE)
a<-table.row.end(a)
a<-table.row.start(a)
a<-table.element(a,'Time lag k',header=TRUE)
a<-table.element(a,hyperlink('basics.htm','ACF(k)','click here for more information about the Autocorrelation Function'),header=TRUE)
a<-table.element(a,'T-STAT',header=TRUE)
a<-table.element(a,'P-value',header=TRUE)
a<-table.row.end(a)
for (i in 2:(par1+1)) {
a<-table.row.start(a)
a<-table.element(a,i-1,header=TRUE)
a<-table.element(a,round(myacf[i],6))
mytstat <- myacf[i]*sqrtn
a<-table.element(a,round(mytstat,4))
a<-table.element(a,round(1-pt(abs(mytstat),lengthx),6))
a<-table.row.end(a)
}
a<-table.end(a)
table.save(a,file='mytable.tab')
a<-table.start()
a<-table.row.start(a)
a<-table.element(a,'Partial Autocorrelation Function',4,TRUE)
a<-table.row.end(a)
a<-table.row.start(a)
a<-table.element(a,'Time lag k',header=TRUE)
a<-table.element(a,hyperlink('basics.htm','PACF(k)','click here for more information about the Partial Autocorrelation Function'),header=TRUE)
a<-table.element(a,'T-STAT',header=TRUE)
a<-table.element(a,'P-value',header=TRUE)
a<-table.row.end(a)
for (i in 1:par1) {
a<-table.row.start(a)
a<-table.element(a,i,header=TRUE)
a<-table.element(a,round(mypacf[i],6))
mytstat <- mypacf[i]*sqrtn
a<-table.element(a,round(mytstat,4))
a<-table.element(a,round(1-pt(abs(mytstat),lengthx),6))
a<-table.row.end(a)
}
a<-table.end(a)
table.save(a,file='mytable1.tab')