Free Statistics

of Irreproducible Research!

Author's title

Author*The author of this computation has been verified*
R Software Modulerwasp_arimabackwardselection.wasp
Title produced by softwareARIMA Backward Selection
Date of computationFri, 04 Dec 2009 07:27:12 -0700
Cite this page as followsStatistical Computations at FreeStatistics.org, Office for Research Development and Education, URL https://freestatistics.org/blog/index.php?v=date/2009/Dec/04/t1259936952zztw5bl9rxqw5pz.htm/, Retrieved Sat, 27 Apr 2024 15:36:40 +0000
Statistical Computations at FreeStatistics.org, Office for Research Development and Education, URL https://freestatistics.org/blog/index.php?pk=63605, Retrieved Sat, 27 Apr 2024 15:36:40 +0000
QR Codes:

Original text written by user:
IsPrivate?No (this computation is public)
User-defined keywords
Estimated Impact134
Family? (F = Feedback message, R = changed R code, M = changed R Module, P = changed Parameters, D = changed Data)
-     [Univariate Data Series] [data set] [2008-12-01 19:54:57] [b98453cac15ba1066b407e146608df68]
- RMP   [ARIMA Backward Selection] [] [2009-11-27 14:53:14] [b98453cac15ba1066b407e146608df68]
F   PD      [ARIMA Backward Selection] [WS 9.6] [2009-12-04 14:27:12] [29af64a72952b0c5025d716b5179273f] [Current]
-   P         [ARIMA Backward Selection] [correctie ARMA pr...] [2009-12-07 21:49:32] [cd6314e7e707a6546bd4604c9d1f2b69]
-               [ARIMA Backward Selection] [WS 9 Review 1 ARI...] [2009-12-09 15:29:29] [83058a88a37d754675a5cd22dab372fc]
Feedback Forum
2009-12-07 22:32:15 [Joris Van Mol] [reply
Deze grafiek ziet er in mijn ogen zéér raar uit en niet wat men ervan verwacht. Volgens mij heb je een aantal verkeerde parameters gebruikt en is dat daaraan te wijten.

- De lambda moest je instellen op 1 i.p.v. 1,4 want de p-waarde bij deze berekening was véél te hoog (70%)
- Volgens mij moest je d instellen op 0 i.p.v. 1 om de reeks stationair te maken en niet over te differentiëren
- Ik zou het MAX AR op 3 zetten i.p.v. op 2
- Ik zou het MAX SAR op 2 zetten i.p.v. 0
- Ik zou het maximum SAM op 1 zetten i.p.v. 0

Al deze veranderingen heb ik toegepast op jouw reeks en dan bekom ik iets helemaal anders, ik heb het hier voor jouw geblogd:

ARMA verbetering

http://www.freestatistics.org/blog/index.php?v=date/2009/Dec/07/t12602226295c116ro0l84qm6j.htm/


Post a new message
Dataseries X:
95.1
97.0
112.7
102.9
97.4
111.4
87.4
96.8
114.1
110.3
103.9
101.6
94.6
95.9
104.7
102.8
98.1
113.9
80.9
95.7
113.2
105.9
108.8
102.3
99.0
100.7
115.5
100.7
109.9
114.6
85.4
100.5
114.8
116.5
112.9
102.0
106.0
105.3
118.8
106.1
109.3
117.2
92.5
104.2
112.5
122.4
113.3
100.0
110.7
112.8
109.8
117.3
109.1
115.9
96.0
99.8
116.8
115.7
99.4
94.3


Summary of computational transaction
Raw Inputview raw input (R code)
Raw Outputview raw output of R engine
Computing time2 seconds
R Server'Gwilym Jenkins' @ 72.249.127.135

\begin{tabular}{lllllllll}
\hline
Summary of computational transaction \tabularnewline
Raw Input & view raw input (R code)  \tabularnewline
Raw Output & view raw output of R engine  \tabularnewline
Computing time & 2 seconds \tabularnewline
R Server & 'Gwilym Jenkins' @ 72.249.127.135 \tabularnewline
\hline
\end{tabular}
%Source: https://freestatistics.org/blog/index.php?pk=63605&T=0

[TABLE]
[ROW][C]Summary of computational transaction[/C][/ROW]
[ROW][C]Raw Input[/C][C]view raw input (R code) [/C][/ROW]
[ROW][C]Raw Output[/C][C]view raw output of R engine [/C][/ROW]
[ROW][C]Computing time[/C][C]2 seconds[/C][/ROW]
[ROW][C]R Server[/C][C]'Gwilym Jenkins' @ 72.249.127.135[/C][/ROW]
[/TABLE]
Source: https://freestatistics.org/blog/index.php?pk=63605&T=0

Globally Unique Identifier (entire table): ba.freestatistics.org/blog/index.php?pk=63605&T=0

As an alternative you can also use a QR Code:  

The GUIDs for individual cells are displayed in the table below:

Summary of computational transaction
Raw Inputview raw input (R code)
Raw Outputview raw output of R engine
Computing time2 seconds
R Server'Gwilym Jenkins' @ 72.249.127.135


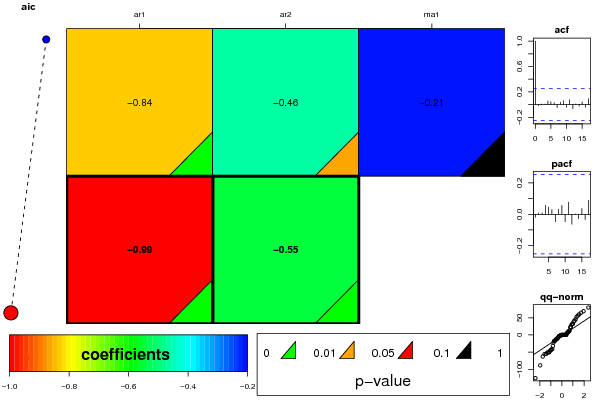
ARIMA Parameter Estimation and Backward Selection
Iterationar1ar2ma1
Estimates ( 1 )-0.8382-0.463-0.2094
(p-val)(8e-04 )(0.0146 )(0.4314 )
Estimates ( 2 )-0.9854-0.55140
(p-val)(0 )(0 )(NA )
Estimates ( 3 )NANANA
(p-val)(NA )(NA )(NA )
Estimates ( 4 )NANANA
(p-val)(NA )(NA )(NA )
Estimates ( 5 )NANANA
(p-val)(NA )(NA )(NA )

\begin{tabular}{lllllllll}
\hline
ARIMA Parameter Estimation and Backward Selection \tabularnewline
Iteration & ar1 & ar2 & ma1 \tabularnewline
Estimates ( 1 ) & -0.8382 & -0.463 & -0.2094 \tabularnewline
(p-val) & (8e-04 ) & (0.0146 ) & (0.4314 ) \tabularnewline
Estimates ( 2 ) & -0.9854 & -0.5514 & 0 \tabularnewline
(p-val) & (0 ) & (0 ) & (NA ) \tabularnewline
Estimates ( 3 ) & NA & NA & NA \tabularnewline
(p-val) & (NA ) & (NA ) & (NA ) \tabularnewline
Estimates ( 4 ) & NA & NA & NA \tabularnewline
(p-val) & (NA ) & (NA ) & (NA ) \tabularnewline
Estimates ( 5 ) & NA & NA & NA \tabularnewline
(p-val) & (NA ) & (NA ) & (NA ) \tabularnewline
\hline
\end{tabular}
%Source: https://freestatistics.org/blog/index.php?pk=63605&T=1

[TABLE]
[ROW][C]ARIMA Parameter Estimation and Backward Selection[/C][/ROW]
[ROW][C]Iteration[/C][C]ar1[/C][C]ar2[/C][C]ma1[/C][/ROW]
[ROW][C]Estimates ( 1 )[/C][C]-0.8382[/C][C]-0.463[/C][C]-0.2094[/C][/ROW]
[ROW][C](p-val)[/C][C](8e-04 )[/C][C](0.0146 )[/C][C](0.4314 )[/C][/ROW]
[ROW][C]Estimates ( 2 )[/C][C]-0.9854[/C][C]-0.5514[/C][C]0[/C][/ROW]
[ROW][C](p-val)[/C][C](0 )[/C][C](0 )[/C][C](NA )[/C][/ROW]
[ROW][C]Estimates ( 3 )[/C][C]NA[/C][C]NA[/C][C]NA[/C][/ROW]
[ROW][C](p-val)[/C][C](NA )[/C][C](NA )[/C][C](NA )[/C][/ROW]
[ROW][C]Estimates ( 4 )[/C][C]NA[/C][C]NA[/C][C]NA[/C][/ROW]
[ROW][C](p-val)[/C][C](NA )[/C][C](NA )[/C][C](NA )[/C][/ROW]
[ROW][C]Estimates ( 5 )[/C][C]NA[/C][C]NA[/C][C]NA[/C][/ROW]
[ROW][C](p-val)[/C][C](NA )[/C][C](NA )[/C][C](NA )[/C][/ROW]
[/TABLE]
Source: https://freestatistics.org/blog/index.php?pk=63605&T=1

Globally Unique Identifier (entire table): ba.freestatistics.org/blog/index.php?pk=63605&T=1

As an alternative you can also use a QR Code:  

The GUIDs for individual cells are displayed in the table below:

ARIMA Parameter Estimation and Backward Selection
Iterationar1ar2ma1
Estimates ( 1 )-0.8382-0.463-0.2094
(p-val)(8e-04 )(0.0146 )(0.4314 )
Estimates ( 2 )-0.9854-0.55140
(p-val)(0 )(0 )(NA )
Estimates ( 3 )NANANA
(p-val)(NA )(NA )(NA )
Estimates ( 4 )NANANA
(p-val)(NA )(NA )(NA )
Estimates ( 5 )NANANA
(p-val)(NA )(NA )(NA )


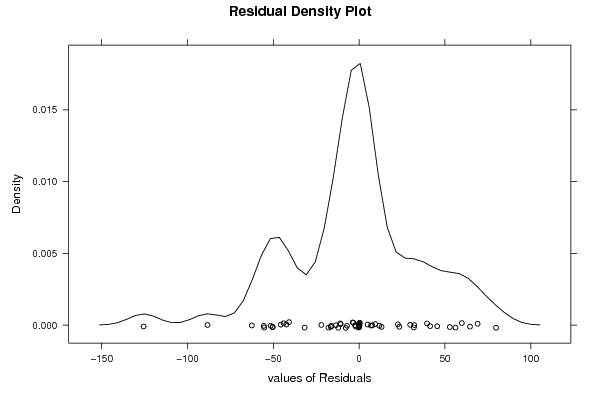
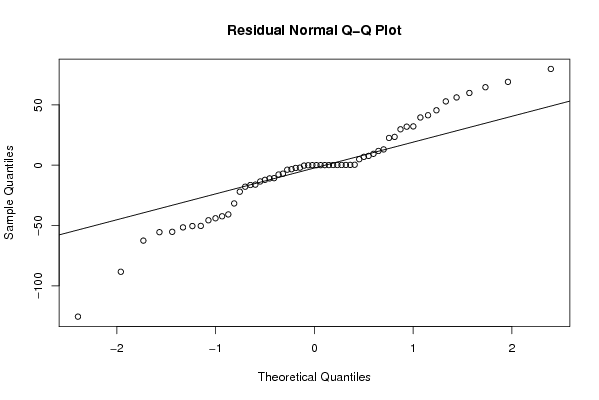
Estimated ARIMA Residuals
Value
-2.30391497037187
-3.37500331903966
-55.2565850145733
6.9010088897241
39.5444852006525
64.6121698558586
-45.6841280530172
-21.9973986866304
-2.04423625712394
-10.7699985433431
56.162564503503
29.7376304814118
45.5032802260219
22.5557238701779
79.76660165069
-51.5724840244958
41.3934815874325
-40.8254440132263
-3.76073001673854
-16.1504005481891
-12.1680945127610
59.8464957825712
9.40239482918958
-50.3592157376096
-7.0615703594284
13.0650553992260
4.94716796946637
0.0133187493240712
-44.0049178161089
-16.4819474141869
32.1309977045816
23.4414513405431
-55.5456770366704
7.69473054440561
-10.9782039776688
-31.7321362227295
11.7918525879638
69.0555256051501
-88.3657737296889
52.8750973652586
-7.76952815588425
-13.5101704119546
-17.8511374026434
-42.3695341740679
31.9048323269663
-62.5443991444954
-125.573329328092
-50.4807883113581

\begin{tabular}{lllllllll}
\hline
Estimated ARIMA Residuals \tabularnewline
Value \tabularnewline
-2.30391497037187 \tabularnewline
-3.37500331903966 \tabularnewline
-55.2565850145733 \tabularnewline
6.9010088897241 \tabularnewline
39.5444852006525 \tabularnewline
64.6121698558586 \tabularnewline
-45.6841280530172 \tabularnewline
-21.9973986866304 \tabularnewline
-2.04423625712394 \tabularnewline
-10.7699985433431 \tabularnewline
56.162564503503 \tabularnewline
29.7376304814118 \tabularnewline
45.5032802260219 \tabularnewline
22.5557238701779 \tabularnewline
79.76660165069 \tabularnewline
-51.5724840244958 \tabularnewline
41.3934815874325 \tabularnewline
-40.8254440132263 \tabularnewline
-3.76073001673854 \tabularnewline
-16.1504005481891 \tabularnewline
-12.1680945127610 \tabularnewline
59.8464957825712 \tabularnewline
9.40239482918958 \tabularnewline
-50.3592157376096 \tabularnewline
-7.0615703594284 \tabularnewline
13.0650553992260 \tabularnewline
4.94716796946637 \tabularnewline
0.0133187493240712 \tabularnewline
-44.0049178161089 \tabularnewline
-16.4819474141869 \tabularnewline
32.1309977045816 \tabularnewline
23.4414513405431 \tabularnewline
-55.5456770366704 \tabularnewline
7.69473054440561 \tabularnewline
-10.9782039776688 \tabularnewline
-31.7321362227295 \tabularnewline
11.7918525879638 \tabularnewline
69.0555256051501 \tabularnewline
-88.3657737296889 \tabularnewline
52.8750973652586 \tabularnewline
-7.76952815588425 \tabularnewline
-13.5101704119546 \tabularnewline
-17.8511374026434 \tabularnewline
-42.3695341740679 \tabularnewline
31.9048323269663 \tabularnewline
-62.5443991444954 \tabularnewline
-125.573329328092 \tabularnewline
-50.4807883113581 \tabularnewline
\hline
\end{tabular}
%Source: https://freestatistics.org/blog/index.php?pk=63605&T=2

[TABLE]
[ROW][C]Estimated ARIMA Residuals[/C][/ROW]
[ROW][C]Value[/C][/ROW]
[ROW][C]-2.30391497037187[/C][/ROW]
[ROW][C]-3.37500331903966[/C][/ROW]
[ROW][C]-55.2565850145733[/C][/ROW]
[ROW][C]6.9010088897241[/C][/ROW]
[ROW][C]39.5444852006525[/C][/ROW]
[ROW][C]64.6121698558586[/C][/ROW]
[ROW][C]-45.6841280530172[/C][/ROW]
[ROW][C]-21.9973986866304[/C][/ROW]
[ROW][C]-2.04423625712394[/C][/ROW]
[ROW][C]-10.7699985433431[/C][/ROW]
[ROW][C]56.162564503503[/C][/ROW]
[ROW][C]29.7376304814118[/C][/ROW]
[ROW][C]45.5032802260219[/C][/ROW]
[ROW][C]22.5557238701779[/C][/ROW]
[ROW][C]79.76660165069[/C][/ROW]
[ROW][C]-51.5724840244958[/C][/ROW]
[ROW][C]41.3934815874325[/C][/ROW]
[ROW][C]-40.8254440132263[/C][/ROW]
[ROW][C]-3.76073001673854[/C][/ROW]
[ROW][C]-16.1504005481891[/C][/ROW]
[ROW][C]-12.1680945127610[/C][/ROW]
[ROW][C]59.8464957825712[/C][/ROW]
[ROW][C]9.40239482918958[/C][/ROW]
[ROW][C]-50.3592157376096[/C][/ROW]
[ROW][C]-7.0615703594284[/C][/ROW]
[ROW][C]13.0650553992260[/C][/ROW]
[ROW][C]4.94716796946637[/C][/ROW]
[ROW][C]0.0133187493240712[/C][/ROW]
[ROW][C]-44.0049178161089[/C][/ROW]
[ROW][C]-16.4819474141869[/C][/ROW]
[ROW][C]32.1309977045816[/C][/ROW]
[ROW][C]23.4414513405431[/C][/ROW]
[ROW][C]-55.5456770366704[/C][/ROW]
[ROW][C]7.69473054440561[/C][/ROW]
[ROW][C]-10.9782039776688[/C][/ROW]
[ROW][C]-31.7321362227295[/C][/ROW]
[ROW][C]11.7918525879638[/C][/ROW]
[ROW][C]69.0555256051501[/C][/ROW]
[ROW][C]-88.3657737296889[/C][/ROW]
[ROW][C]52.8750973652586[/C][/ROW]
[ROW][C]-7.76952815588425[/C][/ROW]
[ROW][C]-13.5101704119546[/C][/ROW]
[ROW][C]-17.8511374026434[/C][/ROW]
[ROW][C]-42.3695341740679[/C][/ROW]
[ROW][C]31.9048323269663[/C][/ROW]
[ROW][C]-62.5443991444954[/C][/ROW]
[ROW][C]-125.573329328092[/C][/ROW]
[ROW][C]-50.4807883113581[/C][/ROW]
[/TABLE]
Source: https://freestatistics.org/blog/index.php?pk=63605&T=2

Globally Unique Identifier (entire table): ba.freestatistics.org/blog/index.php?pk=63605&T=2

As an alternative you can also use a QR Code:  

The GUIDs for individual cells are displayed in the table below:

Estimated ARIMA Residuals
Value
-2.30391497037187
-3.37500331903966
-55.2565850145733
6.9010088897241
39.5444852006525
64.6121698558586
-45.6841280530172
-21.9973986866304
-2.04423625712394
-10.7699985433431
56.162564503503
29.7376304814118
45.5032802260219
22.5557238701779
79.76660165069
-51.5724840244958
41.3934815874325
-40.8254440132263
-3.76073001673854
-16.1504005481891
-12.1680945127610
59.8464957825712
9.40239482918958
-50.3592157376096
-7.0615703594284
13.0650553992260
4.94716796946637
0.0133187493240712
-44.0049178161089
-16.4819474141869
32.1309977045816
23.4414513405431
-55.5456770366704
7.69473054440561
-10.9782039776688
-31.7321362227295
11.7918525879638
69.0555256051501
-88.3657737296889
52.8750973652586
-7.76952815588425
-13.5101704119546
-17.8511374026434
-42.3695341740679
31.9048323269663
-62.5443991444954
-125.573329328092
-50.4807883113581


Parameters (Session):
par1 = FALSE ; par2 = 1.5 ; par3 = 1 ; par4 = 1 ; par5 = 12 ; par6 = 3 ; par7 = 1 ; par8 = 2 ; par9 = 1 ;
Parameters (R input):
par1 = FALSE ; par2 = 1.4 ; par3 = 1 ; par4 = 1 ; par5 = 12 ; par6 = 2 ; par7 = 1 ; par8 = 0 ; par9 = 0 ;
R code (references can be found in the software module):
library(lattice)
if (par1 == 'TRUE') par1 <- TRUE
if (par1 == 'FALSE') par1 <- FALSE
par2 <- as.numeric(par2) #Box-Cox lambda transformation parameter
par3 <- as.numeric(par3) #degree of non-seasonal differencing
par4 <- as.numeric(par4) #degree of seasonal differencing
par5 <- as.numeric(par5) #seasonal period
par6 <- as.numeric(par6) #degree (p) of the non-seasonal AR(p) polynomial
par7 <- as.numeric(par7) #degree (q) of the non-seasonal MA(q) polynomial
par8 <- as.numeric(par8) #degree (P) of the seasonal AR(P) polynomial
par9 <- as.numeric(par9) #degree (Q) of the seasonal MA(Q) polynomial
armaGR <- function(arima.out, names, n){
try1 <- arima.out$coef
try2 <- sqrt(diag(arima.out$var.coef))
try.data.frame <- data.frame(matrix(NA,ncol=4,nrow=length(names)))
dimnames(try.data.frame) <- list(names,c('coef','std','tstat','pv'))
try.data.frame[,1] <- try1
for(i in 1:length(try2)) try.data.frame[which(rownames(try.data.frame)==names(try2)[i]),2] <- try2[i]
try.data.frame[,3] <- try.data.frame[,1] / try.data.frame[,2]
try.data.frame[,4] <- round((1-pt(abs(try.data.frame[,3]),df=n-(length(try2)+1)))*2,5)
vector <- rep(NA,length(names))
vector[is.na(try.data.frame[,4])] <- 0
maxi <- which.max(try.data.frame[,4])
continue <- max(try.data.frame[,4],na.rm=TRUE) > .05
vector[maxi] <- 0
list(summary=try.data.frame,next.vector=vector,continue=continue)
}
arimaSelect <- function(series, order=c(13,0,0), seasonal=list(order=c(2,0,0),period=12), include.mean=F){
nrc <- order[1]+order[3]+seasonal$order[1]+seasonal$order[3]
coeff <- matrix(NA, nrow=nrc*2, ncol=nrc)
pval <- matrix(NA, nrow=nrc*2, ncol=nrc)
mylist <- rep(list(NULL), nrc)
names <- NULL
if(order[1] > 0) names <- paste('ar',1:order[1],sep='')
if(order[3] > 0) names <- c( names , paste('ma',1:order[3],sep='') )
if(seasonal$order[1] > 0) names <- c(names, paste('sar',1:seasonal$order[1],sep=''))
if(seasonal$order[3] > 0) names <- c(names, paste('sma',1:seasonal$order[3],sep=''))
arima.out <- arima(series, order=order, seasonal=seasonal, include.mean=include.mean, method='ML')
mylist[[1]] <- arima.out
last.arma <- armaGR(arima.out, names, length(series))
mystop <- FALSE
i <- 1
coeff[i,] <- last.arma[[1]][,1]
pval [i,] <- last.arma[[1]][,4]
i <- 2
aic <- arima.out$aic
while(!mystop){
mylist[[i]] <- arima.out
arima.out <- arima(series, order=order, seasonal=seasonal, include.mean=include.mean, method='ML', fixed=last.arma$next.vector)
aic <- c(aic, arima.out$aic)
last.arma <- armaGR(arima.out, names, length(series))
mystop <- !last.arma$continue
coeff[i,] <- last.arma[[1]][,1]
pval [i,] <- last.arma[[1]][,4]
i <- i+1
}
list(coeff, pval, mylist, aic=aic)
}
arimaSelectplot <- function(arimaSelect.out,noms,choix){
noms <- names(arimaSelect.out[[3]][[1]]$coef)
coeff <- arimaSelect.out[[1]]
k <- min(which(is.na(coeff[,1])))-1
coeff <- coeff[1:k,]
pval <- arimaSelect.out[[2]][1:k,]
aic <- arimaSelect.out$aic[1:k]
coeff[coeff==0] <- NA
n <- ncol(coeff)
if(missing(choix)) choix <- k
layout(matrix(c(1,1,1,2,
3,3,3,2,
3,3,3,4,
5,6,7,7),nr=4),
widths=c(10,35,45,15),
heights=c(30,30,15,15))
couleurs <- rainbow(75)[1:50]#(50)
ticks <- pretty(coeff)
par(mar=c(1,1,3,1))
plot(aic,k:1-.5,type='o',pch=21,bg='blue',cex=2,axes=F,lty=2,xpd=NA)
points(aic[choix],k-choix+.5,pch=21,cex=4,bg=2,xpd=NA)
title('aic',line=2)
par(mar=c(3,0,0,0))
plot(0,axes=F,xlab='',ylab='',xlim=range(ticks),ylim=c(.1,1))
rect(xleft = min(ticks) + (0:49)/50*(max(ticks)-min(ticks)),
xright = min(ticks) + (1:50)/50*(max(ticks)-min(ticks)),
ytop = rep(1,50),
ybottom= rep(0,50),col=couleurs,border=NA)
axis(1,ticks)
rect(xleft=min(ticks),xright=max(ticks),ytop=1,ybottom=0)
text(mean(coeff,na.rm=T),.5,'coefficients',cex=2,font=2)
par(mar=c(1,1,3,1))
image(1:n,1:k,t(coeff[k:1,]),axes=F,col=couleurs,zlim=range(ticks))
for(i in 1:n) for(j in 1:k) if(!is.na(coeff[j,i])) {
if(pval[j,i]<.01) symb = 'green'
else if( (pval[j,i]<.05) & (pval[j,i]>=.01)) symb = 'orange'
else if( (pval[j,i]<.1) & (pval[j,i]>=.05)) symb = 'red'
else symb = 'black'
polygon(c(i+.5 ,i+.2 ,i+.5 ,i+.5),
c(k-j+0.5,k-j+0.5,k-j+0.8,k-j+0.5),
col=symb)
if(j==choix) {
rect(xleft=i-.5,
xright=i+.5,
ybottom=k-j+1.5,
ytop=k-j+.5,
lwd=4)
text(i,
k-j+1,
round(coeff[j,i],2),
cex=1.2,
font=2)
}
else{
rect(xleft=i-.5,xright=i+.5,ybottom=k-j+1.5,ytop=k-j+.5)
text(i,k-j+1,round(coeff[j,i],2),cex=1.2,font=1)
}
}
axis(3,1:n,noms)
par(mar=c(0.5,0,0,0.5))
plot(0,axes=F,xlab='',ylab='',type='n',xlim=c(0,8),ylim=c(-.2,.8))
cols <- c('green','orange','red','black')
niv <- c('0','0.01','0.05','0.1')
for(i in 0:3){
polygon(c(1+2*i ,1+2*i ,1+2*i-.5 ,1+2*i),
c(.4 ,.7 , .4 , .4),
col=cols[i+1])
text(2*i,0.5,niv[i+1],cex=1.5)
}
text(8,.5,1,cex=1.5)
text(4,0,'p-value',cex=2)
box()
residus <- arimaSelect.out[[3]][[choix]]$res
par(mar=c(1,2,4,1))
acf(residus,main='')
title('acf',line=.5)
par(mar=c(1,2,4,1))
pacf(residus,main='')
title('pacf',line=.5)
par(mar=c(2,2,4,1))
qqnorm(residus,main='')
title('qq-norm',line=.5)
qqline(residus)
residus
}
if (par2 == 0) x <- log(x)
if (par2 != 0) x <- x^par2
(selection <- arimaSelect(x, order=c(par6,par3,par7), seasonal=list(order=c(par8,par4,par9), period=par5)))
bitmap(file='test1.png')
resid <- arimaSelectplot(selection)
dev.off()
resid
bitmap(file='test2.png')
acf(resid,length(resid)/2, main='Residual Autocorrelation Function')
dev.off()
bitmap(file='test3.png')
pacf(resid,length(resid)/2, main='Residual Partial Autocorrelation Function')
dev.off()
bitmap(file='test4.png')
cpgram(resid, main='Residual Cumulative Periodogram')
dev.off()
bitmap(file='test5.png')
hist(resid, main='Residual Histogram', xlab='values of Residuals')
dev.off()
bitmap(file='test6.png')
densityplot(~resid,col='black',main='Residual Density Plot', xlab='values of Residuals')
dev.off()
bitmap(file='test7.png')
qqnorm(resid, main='Residual Normal Q-Q Plot')
qqline(resid)
dev.off()
ncols <- length(selection[[1]][1,])
nrows <- length(selection[[2]][,1])-1
load(file='createtable')
a<-table.start()
a<-table.row.start(a)
a<-table.element(a,'ARIMA Parameter Estimation and Backward Selection', ncols+1,TRUE)
a<-table.row.end(a)
a<-table.row.start(a)
a<-table.element(a,'Iteration', header=TRUE)
for (i in 1:ncols) {
a<-table.element(a,names(selection[[3]][[1]]$coef)[i],header=TRUE)
}
a<-table.row.end(a)
for (j in 1:nrows) {
a<-table.row.start(a)
mydum <- 'Estimates ('
mydum <- paste(mydum,j)
mydum <- paste(mydum,')')
a<-table.element(a,mydum, header=TRUE)
for (i in 1:ncols) {
a<-table.element(a,round(selection[[1]][j,i],4))
}
a<-table.row.end(a)
a<-table.row.start(a)
a<-table.element(a,'(p-val)', header=TRUE)
for (i in 1:ncols) {
mydum <- '('
mydum <- paste(mydum,round(selection[[2]][j,i],4),sep='')
mydum <- paste(mydum,')')
a<-table.element(a,mydum)
}
a<-table.row.end(a)
}
a<-table.end(a)
table.save(a,file='mytable.tab')
a<-table.start()
a<-table.row.start(a)
a<-table.element(a,'Estimated ARIMA Residuals', 1,TRUE)
a<-table.row.end(a)
a<-table.row.start(a)
a<-table.element(a,'Value', 1,TRUE)
a<-table.row.end(a)
for (i in (par4*par5+par3):length(resid)) {
a<-table.row.start(a)
a<-table.element(a,resid[i])
a<-table.row.end(a)
}
a<-table.end(a)
table.save(a,file='mytable1.tab')