Free Statistics

of Irreproducible Research!

Author's title

Author*Unverified author*
R Software Modulerwasp_arimabackwardselection.wasp
Title produced by softwareARIMA Backward Selection
Date of computationFri, 04 Dec 2009 07:43:30 -0700
Cite this page as followsStatistical Computations at FreeStatistics.org, Office for Research Development and Education, URL https://freestatistics.org/blog/index.php?v=date/2009/Dec/04/t12599378860w8ih5oepwag2qn.htm/, Retrieved Sat, 27 Apr 2024 18:04:40 +0000
Statistical Computations at FreeStatistics.org, Office for Research Development and Education, URL https://freestatistics.org/blog/index.php?pk=63650, Retrieved Sat, 27 Apr 2024 18:04:40 +0000
QR Codes:

Original text written by user:
IsPrivate?No (this computation is public)
User-defined keywordsWS9_backwards
Estimated Impact113
Family? (F = Feedback message, R = changed R code, M = changed R Module, P = changed Parameters, D = changed Data)
-     [Univariate Data Series] [data set] [2008-12-01 19:54:57] [b98453cac15ba1066b407e146608df68]
- RMP   [ARIMA Backward Selection] [] [2009-11-27 14:53:14] [b98453cac15ba1066b407e146608df68]
- R PD      [ARIMA Backward Selection] [] [2009-12-04 14:43:30] [804cfcbb1316ddd20a1b05c1540f0b0b] [Current]
Feedback Forum

Post a new message
Dataseries X:
106370
109375
116476
123297
114813
117925
126466
131235
120546
123791
129813
133463
122987
125418
130199
133016
121454
122044
128313
131556
120027
123001
130111
132524
123742
124931
133646
136557
127509
128945
137191
139716
129083
131604
139413
143125
133948
137116
144864
149277
138796
143258
150034
154708
144888
148762
156500
161088
152772
158011
163318
169969
162269
165765
170600
174681
166364
170240
176150
182056
172218
177856
182253
188090
176863
183273
187969
194650
183036
189516
193805
200499
188142
193732
197126
205140
191751
196700
199784
207360
196101
200824
205743
212489
200810
203683
207286
210910
194915
217920


Summary of computational transaction
Raw Inputview raw input (R code)
Raw Outputview raw output of R engine
Computing time5 seconds
R Server'Gwilym Jenkins' @ 72.249.127.135

\begin{tabular}{lllllllll}
\hline
Summary of computational transaction \tabularnewline
Raw Input & view raw input (R code)  \tabularnewline
Raw Output & view raw output of R engine  \tabularnewline
Computing time & 5 seconds \tabularnewline
R Server & 'Gwilym Jenkins' @ 72.249.127.135 \tabularnewline
\hline
\end{tabular}
%Source: https://freestatistics.org/blog/index.php?pk=63650&T=0

[TABLE]
[ROW][C]Summary of computational transaction[/C][/ROW]
[ROW][C]Raw Input[/C][C]view raw input (R code) [/C][/ROW]
[ROW][C]Raw Output[/C][C]view raw output of R engine [/C][/ROW]
[ROW][C]Computing time[/C][C]5 seconds[/C][/ROW]
[ROW][C]R Server[/C][C]'Gwilym Jenkins' @ 72.249.127.135[/C][/ROW]
[/TABLE]
Source: https://freestatistics.org/blog/index.php?pk=63650&T=0

Globally Unique Identifier (entire table): ba.freestatistics.org/blog/index.php?pk=63650&T=0

As an alternative you can also use a QR Code:  

The GUIDs for individual cells are displayed in the table below:

Summary of computational transaction
Raw Inputview raw input (R code)
Raw Outputview raw output of R engine
Computing time5 seconds
R Server'Gwilym Jenkins' @ 72.249.127.135


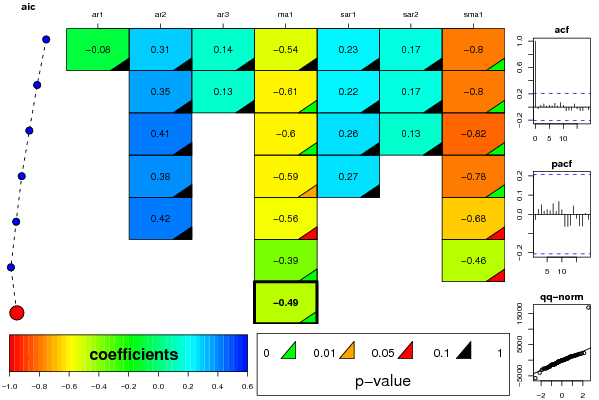
ARIMA Parameter Estimation and Backward Selection
Iterationar1ar2ar3ma1sar1sar2sma1
Estimates ( 1 )-0.07960.31030.1373-0.53530.22560.1733-0.8
(p-val)(0.9337 )(0.6312 )(0.5855 )(0.5669 )(0.4886 )(0.4822 )(0 )
Estimates ( 2 )00.35040.1297-0.60830.21830.1701-0.7985
(p-val)(NA )(0.3429 )(0.5929 )(0.0032 )(0.4779 )(0.4865 )(0 )
Estimates ( 3 )00.40810-0.60170.26280.1288-0.8209
(p-val)(NA )(0.3206 )(NA )(0.0084 )(0.3818 )(0.5747 )(0 )
Estimates ( 4 )00.37780-0.590.2750-0.778
(p-val)(NA )(0.3658 )(NA )(0.011 )(0.3859 )(NA )(0 )
Estimates ( 5 )00.41560-0.559100-0.6757
(p-val)(NA )(0.494 )(NA )(0.068 )(NA )(NA )(0.0654 )
Estimates ( 6 )000-0.387100-0.4627
(p-val)(NA )(NA )(NA )(0.0033 )(NA )(NA )(0.0543 )
Estimates ( 7 )000-0.4862000
(p-val)(NA )(NA )(NA )(2e-04 )(NA )(NA )(NA )
Estimates ( 8 )NANANANANANANA
(p-val)(NA )(NA )(NA )(NA )(NA )(NA )(NA )
Estimates ( 9 )NANANANANANANA
(p-val)(NA )(NA )(NA )(NA )(NA )(NA )(NA )
Estimates ( 10 )NANANANANANANA
(p-val)(NA )(NA )(NA )(NA )(NA )(NA )(NA )
Estimates ( 11 )NANANANANANANA
(p-val)(NA )(NA )(NA )(NA )(NA )(NA )(NA )
Estimates ( 12 )NANANANANANANA
(p-val)(NA )(NA )(NA )(NA )(NA )(NA )(NA )
Estimates ( 13 )NANANANANANANA
(p-val)(NA )(NA )(NA )(NA )(NA )(NA )(NA )

\begin{tabular}{lllllllll}
\hline
ARIMA Parameter Estimation and Backward Selection \tabularnewline
Iteration & ar1 & ar2 & ar3 & ma1 & sar1 & sar2 & sma1 \tabularnewline
Estimates ( 1 ) & -0.0796 & 0.3103 & 0.1373 & -0.5353 & 0.2256 & 0.1733 & -0.8 \tabularnewline
(p-val) & (0.9337 ) & (0.6312 ) & (0.5855 ) & (0.5669 ) & (0.4886 ) & (0.4822 ) & (0 ) \tabularnewline
Estimates ( 2 ) & 0 & 0.3504 & 0.1297 & -0.6083 & 0.2183 & 0.1701 & -0.7985 \tabularnewline
(p-val) & (NA ) & (0.3429 ) & (0.5929 ) & (0.0032 ) & (0.4779 ) & (0.4865 ) & (0 ) \tabularnewline
Estimates ( 3 ) & 0 & 0.4081 & 0 & -0.6017 & 0.2628 & 0.1288 & -0.8209 \tabularnewline
(p-val) & (NA ) & (0.3206 ) & (NA ) & (0.0084 ) & (0.3818 ) & (0.5747 ) & (0 ) \tabularnewline
Estimates ( 4 ) & 0 & 0.3778 & 0 & -0.59 & 0.275 & 0 & -0.778 \tabularnewline
(p-val) & (NA ) & (0.3658 ) & (NA ) & (0.011 ) & (0.3859 ) & (NA ) & (0 ) \tabularnewline
Estimates ( 5 ) & 0 & 0.4156 & 0 & -0.5591 & 0 & 0 & -0.6757 \tabularnewline
(p-val) & (NA ) & (0.494 ) & (NA ) & (0.068 ) & (NA ) & (NA ) & (0.0654 ) \tabularnewline
Estimates ( 6 ) & 0 & 0 & 0 & -0.3871 & 0 & 0 & -0.4627 \tabularnewline
(p-val) & (NA ) & (NA ) & (NA ) & (0.0033 ) & (NA ) & (NA ) & (0.0543 ) \tabularnewline
Estimates ( 7 ) & 0 & 0 & 0 & -0.4862 & 0 & 0 & 0 \tabularnewline
(p-val) & (NA ) & (NA ) & (NA ) & (2e-04 ) & (NA ) & (NA ) & (NA ) \tabularnewline
Estimates ( 8 ) & NA & NA & NA & NA & NA & NA & NA \tabularnewline
(p-val) & (NA ) & (NA ) & (NA ) & (NA ) & (NA ) & (NA ) & (NA ) \tabularnewline
Estimates ( 9 ) & NA & NA & NA & NA & NA & NA & NA \tabularnewline
(p-val) & (NA ) & (NA ) & (NA ) & (NA ) & (NA ) & (NA ) & (NA ) \tabularnewline
Estimates ( 10 ) & NA & NA & NA & NA & NA & NA & NA \tabularnewline
(p-val) & (NA ) & (NA ) & (NA ) & (NA ) & (NA ) & (NA ) & (NA ) \tabularnewline
Estimates ( 11 ) & NA & NA & NA & NA & NA & NA & NA \tabularnewline
(p-val) & (NA ) & (NA ) & (NA ) & (NA ) & (NA ) & (NA ) & (NA ) \tabularnewline
Estimates ( 12 ) & NA & NA & NA & NA & NA & NA & NA \tabularnewline
(p-val) & (NA ) & (NA ) & (NA ) & (NA ) & (NA ) & (NA ) & (NA ) \tabularnewline
Estimates ( 13 ) & NA & NA & NA & NA & NA & NA & NA \tabularnewline
(p-val) & (NA ) & (NA ) & (NA ) & (NA ) & (NA ) & (NA ) & (NA ) \tabularnewline
\hline
\end{tabular}
%Source: https://freestatistics.org/blog/index.php?pk=63650&T=1

[TABLE]
[ROW][C]ARIMA Parameter Estimation and Backward Selection[/C][/ROW]
[ROW][C]Iteration[/C][C]ar1[/C][C]ar2[/C][C]ar3[/C][C]ma1[/C][C]sar1[/C][C]sar2[/C][C]sma1[/C][/ROW]
[ROW][C]Estimates ( 1 )[/C][C]-0.0796[/C][C]0.3103[/C][C]0.1373[/C][C]-0.5353[/C][C]0.2256[/C][C]0.1733[/C][C]-0.8[/C][/ROW]
[ROW][C](p-val)[/C][C](0.9337 )[/C][C](0.6312 )[/C][C](0.5855 )[/C][C](0.5669 )[/C][C](0.4886 )[/C][C](0.4822 )[/C][C](0 )[/C][/ROW]
[ROW][C]Estimates ( 2 )[/C][C]0[/C][C]0.3504[/C][C]0.1297[/C][C]-0.6083[/C][C]0.2183[/C][C]0.1701[/C][C]-0.7985[/C][/ROW]
[ROW][C](p-val)[/C][C](NA )[/C][C](0.3429 )[/C][C](0.5929 )[/C][C](0.0032 )[/C][C](0.4779 )[/C][C](0.4865 )[/C][C](0 )[/C][/ROW]
[ROW][C]Estimates ( 3 )[/C][C]0[/C][C]0.4081[/C][C]0[/C][C]-0.6017[/C][C]0.2628[/C][C]0.1288[/C][C]-0.8209[/C][/ROW]
[ROW][C](p-val)[/C][C](NA )[/C][C](0.3206 )[/C][C](NA )[/C][C](0.0084 )[/C][C](0.3818 )[/C][C](0.5747 )[/C][C](0 )[/C][/ROW]
[ROW][C]Estimates ( 4 )[/C][C]0[/C][C]0.3778[/C][C]0[/C][C]-0.59[/C][C]0.275[/C][C]0[/C][C]-0.778[/C][/ROW]
[ROW][C](p-val)[/C][C](NA )[/C][C](0.3658 )[/C][C](NA )[/C][C](0.011 )[/C][C](0.3859 )[/C][C](NA )[/C][C](0 )[/C][/ROW]
[ROW][C]Estimates ( 5 )[/C][C]0[/C][C]0.4156[/C][C]0[/C][C]-0.5591[/C][C]0[/C][C]0[/C][C]-0.6757[/C][/ROW]
[ROW][C](p-val)[/C][C](NA )[/C][C](0.494 )[/C][C](NA )[/C][C](0.068 )[/C][C](NA )[/C][C](NA )[/C][C](0.0654 )[/C][/ROW]
[ROW][C]Estimates ( 6 )[/C][C]0[/C][C]0[/C][C]0[/C][C]-0.3871[/C][C]0[/C][C]0[/C][C]-0.4627[/C][/ROW]
[ROW][C](p-val)[/C][C](NA )[/C][C](NA )[/C][C](NA )[/C][C](0.0033 )[/C][C](NA )[/C][C](NA )[/C][C](0.0543 )[/C][/ROW]
[ROW][C]Estimates ( 7 )[/C][C]0[/C][C]0[/C][C]0[/C][C]-0.4862[/C][C]0[/C][C]0[/C][C]0[/C][/ROW]
[ROW][C](p-val)[/C][C](NA )[/C][C](NA )[/C][C](NA )[/C][C](2e-04 )[/C][C](NA )[/C][C](NA )[/C][C](NA )[/C][/ROW]
[ROW][C]Estimates ( 8 )[/C][C]NA[/C][C]NA[/C][C]NA[/C][C]NA[/C][C]NA[/C][C]NA[/C][C]NA[/C][/ROW]
[ROW][C](p-val)[/C][C](NA )[/C][C](NA )[/C][C](NA )[/C][C](NA )[/C][C](NA )[/C][C](NA )[/C][C](NA )[/C][/ROW]
[ROW][C]Estimates ( 9 )[/C][C]NA[/C][C]NA[/C][C]NA[/C][C]NA[/C][C]NA[/C][C]NA[/C][C]NA[/C][/ROW]
[ROW][C](p-val)[/C][C](NA )[/C][C](NA )[/C][C](NA )[/C][C](NA )[/C][C](NA )[/C][C](NA )[/C][C](NA )[/C][/ROW]
[ROW][C]Estimates ( 10 )[/C][C]NA[/C][C]NA[/C][C]NA[/C][C]NA[/C][C]NA[/C][C]NA[/C][C]NA[/C][/ROW]
[ROW][C](p-val)[/C][C](NA )[/C][C](NA )[/C][C](NA )[/C][C](NA )[/C][C](NA )[/C][C](NA )[/C][C](NA )[/C][/ROW]
[ROW][C]Estimates ( 11 )[/C][C]NA[/C][C]NA[/C][C]NA[/C][C]NA[/C][C]NA[/C][C]NA[/C][C]NA[/C][/ROW]
[ROW][C](p-val)[/C][C](NA )[/C][C](NA )[/C][C](NA )[/C][C](NA )[/C][C](NA )[/C][C](NA )[/C][C](NA )[/C][/ROW]
[ROW][C]Estimates ( 12 )[/C][C]NA[/C][C]NA[/C][C]NA[/C][C]NA[/C][C]NA[/C][C]NA[/C][C]NA[/C][/ROW]
[ROW][C](p-val)[/C][C](NA )[/C][C](NA )[/C][C](NA )[/C][C](NA )[/C][C](NA )[/C][C](NA )[/C][C](NA )[/C][/ROW]
[ROW][C]Estimates ( 13 )[/C][C]NA[/C][C]NA[/C][C]NA[/C][C]NA[/C][C]NA[/C][C]NA[/C][C]NA[/C][/ROW]
[ROW][C](p-val)[/C][C](NA )[/C][C](NA )[/C][C](NA )[/C][C](NA )[/C][C](NA )[/C][C](NA )[/C][C](NA )[/C][/ROW]
[/TABLE]
Source: https://freestatistics.org/blog/index.php?pk=63650&T=1

Globally Unique Identifier (entire table): ba.freestatistics.org/blog/index.php?pk=63650&T=1

As an alternative you can also use a QR Code:  

The GUIDs for individual cells are displayed in the table below:

ARIMA Parameter Estimation and Backward Selection
Iterationar1ar2ar3ma1sar1sar2sma1
Estimates ( 1 )-0.07960.31030.1373-0.53530.22560.1733-0.8
(p-val)(0.9337 )(0.6312 )(0.5855 )(0.5669 )(0.4886 )(0.4822 )(0 )
Estimates ( 2 )00.35040.1297-0.60830.21830.1701-0.7985
(p-val)(NA )(0.3429 )(0.5929 )(0.0032 )(0.4779 )(0.4865 )(0 )
Estimates ( 3 )00.40810-0.60170.26280.1288-0.8209
(p-val)(NA )(0.3206 )(NA )(0.0084 )(0.3818 )(0.5747 )(0 )
Estimates ( 4 )00.37780-0.590.2750-0.778
(p-val)(NA )(0.3658 )(NA )(0.011 )(0.3859 )(NA )(0 )
Estimates ( 5 )00.41560-0.559100-0.6757
(p-val)(NA )(0.494 )(NA )(0.068 )(NA )(NA )(0.0654 )
Estimates ( 6 )000-0.387100-0.4627
(p-val)(NA )(NA )(NA )(0.0033 )(NA )(NA )(0.0543 )
Estimates ( 7 )000-0.4862000
(p-val)(NA )(NA )(NA )(2e-04 )(NA )(NA )(NA )
Estimates ( 8 )NANANANANANANA
(p-val)(NA )(NA )(NA )(NA )(NA )(NA )(NA )
Estimates ( 9 )NANANANANANANA
(p-val)(NA )(NA )(NA )(NA )(NA )(NA )(NA )
Estimates ( 10 )NANANANANANANA
(p-val)(NA )(NA )(NA )(NA )(NA )(NA )(NA )
Estimates ( 11 )NANANANANANANA
(p-val)(NA )(NA )(NA )(NA )(NA )(NA )(NA )
Estimates ( 12 )NANANANANANANA
(p-val)(NA )(NA )(NA )(NA )(NA )(NA )(NA )
Estimates ( 13 )NANANANANANANA
(p-val)(NA )(NA )(NA )(NA )(NA )(NA )(NA )


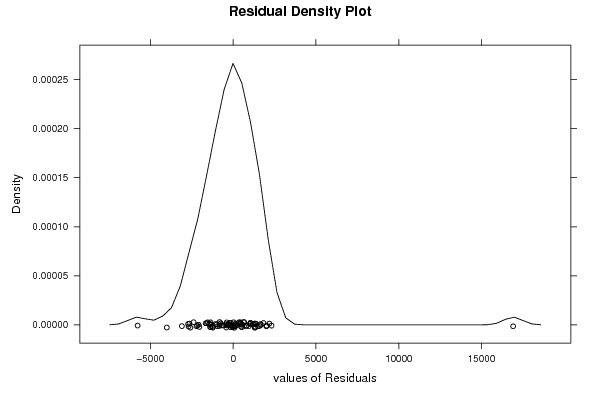
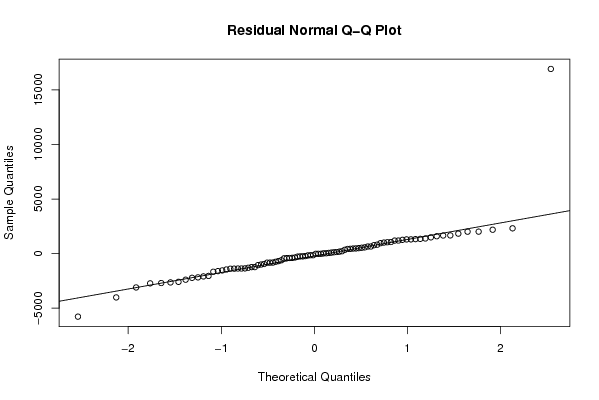
Estimated ARIMA Residuals
Value
-224.352448585086
90.2782060648381
1326.53645684760
-1351.84736054763
-2584.87183082932
-749.855355306601
-2217.94134085565
-2722.79602029646
-1662.62295029889
-1365.66429522788
-2638.03110287950
-2694.87743117034
-2389.69895794091
-3098.44432948766
-684.392243864269
-610.239395961192
-820.554571423557
1059.57883713138
1488.77309533581
-413.171491948611
2316.12974990559
-251.396547460378
2006.60908902554
817.01486653097
1195.71246096861
178.754301490753
573.646445069043
-145.313531086436
-1234.34065815956
475.727807695065
-19.4348201228450
1009.49118001091
1301.67809452914
1592.09241046984
461.106587649526
1350.06980835499
-359.907290984908
1658.19153873781
-401.916003248647
647.503733368985
503.30601962712
438.544663672869
648.790206010459
536.740370269297
1828.67845460724
2185.65833324480
-1363.27199063820
1667.41181874442
2011.45909554187
-280.587855086918
-1602.88796576521
-2174.79241855170
-826.828349049765
-430.180083168557
217.073744954625
1189.85182957685
-1053.43881597184
1303.25947620145
-831.008540643408
120.976411633416
-2042.71643918408
772.95794981167
-19.7245964015430
1041.18608410805
-950.786603329845
425.473405384187
-389.871204491628
347.369546934183
-1234.95278256936
-1000.89102762183
-1539.05335702142
954.78296640758
-1296.03080845692
-1384.61703782548
-1378.84153945584
-254.311954649641
1260.86376405155
-146.438113026696
1388.32615989028
-163.270464139842
145.751203749909
-2087.17487010315
-1455.34867322148
-4009.58910037171
-5771.45300903329
16905.9907887266

\begin{tabular}{lllllllll}
\hline
Estimated ARIMA Residuals \tabularnewline
Value \tabularnewline
-224.352448585086 \tabularnewline
90.2782060648381 \tabularnewline
1326.53645684760 \tabularnewline
-1351.84736054763 \tabularnewline
-2584.87183082932 \tabularnewline
-749.855355306601 \tabularnewline
-2217.94134085565 \tabularnewline
-2722.79602029646 \tabularnewline
-1662.62295029889 \tabularnewline
-1365.66429522788 \tabularnewline
-2638.03110287950 \tabularnewline
-2694.87743117034 \tabularnewline
-2389.69895794091 \tabularnewline
-3098.44432948766 \tabularnewline
-684.392243864269 \tabularnewline
-610.239395961192 \tabularnewline
-820.554571423557 \tabularnewline
1059.57883713138 \tabularnewline
1488.77309533581 \tabularnewline
-413.171491948611 \tabularnewline
2316.12974990559 \tabularnewline
-251.396547460378 \tabularnewline
2006.60908902554 \tabularnewline
817.01486653097 \tabularnewline
1195.71246096861 \tabularnewline
178.754301490753 \tabularnewline
573.646445069043 \tabularnewline
-145.313531086436 \tabularnewline
-1234.34065815956 \tabularnewline
475.727807695065 \tabularnewline
-19.4348201228450 \tabularnewline
1009.49118001091 \tabularnewline
1301.67809452914 \tabularnewline
1592.09241046984 \tabularnewline
461.106587649526 \tabularnewline
1350.06980835499 \tabularnewline
-359.907290984908 \tabularnewline
1658.19153873781 \tabularnewline
-401.916003248647 \tabularnewline
647.503733368985 \tabularnewline
503.30601962712 \tabularnewline
438.544663672869 \tabularnewline
648.790206010459 \tabularnewline
536.740370269297 \tabularnewline
1828.67845460724 \tabularnewline
2185.65833324480 \tabularnewline
-1363.27199063820 \tabularnewline
1667.41181874442 \tabularnewline
2011.45909554187 \tabularnewline
-280.587855086918 \tabularnewline
-1602.88796576521 \tabularnewline
-2174.79241855170 \tabularnewline
-826.828349049765 \tabularnewline
-430.180083168557 \tabularnewline
217.073744954625 \tabularnewline
1189.85182957685 \tabularnewline
-1053.43881597184 \tabularnewline
1303.25947620145 \tabularnewline
-831.008540643408 \tabularnewline
120.976411633416 \tabularnewline
-2042.71643918408 \tabularnewline
772.95794981167 \tabularnewline
-19.7245964015430 \tabularnewline
1041.18608410805 \tabularnewline
-950.786603329845 \tabularnewline
425.473405384187 \tabularnewline
-389.871204491628 \tabularnewline
347.369546934183 \tabularnewline
-1234.95278256936 \tabularnewline
-1000.89102762183 \tabularnewline
-1539.05335702142 \tabularnewline
954.78296640758 \tabularnewline
-1296.03080845692 \tabularnewline
-1384.61703782548 \tabularnewline
-1378.84153945584 \tabularnewline
-254.311954649641 \tabularnewline
1260.86376405155 \tabularnewline
-146.438113026696 \tabularnewline
1388.32615989028 \tabularnewline
-163.270464139842 \tabularnewline
145.751203749909 \tabularnewline
-2087.17487010315 \tabularnewline
-1455.34867322148 \tabularnewline
-4009.58910037171 \tabularnewline
-5771.45300903329 \tabularnewline
16905.9907887266 \tabularnewline
\hline
\end{tabular}
%Source: https://freestatistics.org/blog/index.php?pk=63650&T=2

[TABLE]
[ROW][C]Estimated ARIMA Residuals[/C][/ROW]
[ROW][C]Value[/C][/ROW]
[ROW][C]-224.352448585086[/C][/ROW]
[ROW][C]90.2782060648381[/C][/ROW]
[ROW][C]1326.53645684760[/C][/ROW]
[ROW][C]-1351.84736054763[/C][/ROW]
[ROW][C]-2584.87183082932[/C][/ROW]
[ROW][C]-749.855355306601[/C][/ROW]
[ROW][C]-2217.94134085565[/C][/ROW]
[ROW][C]-2722.79602029646[/C][/ROW]
[ROW][C]-1662.62295029889[/C][/ROW]
[ROW][C]-1365.66429522788[/C][/ROW]
[ROW][C]-2638.03110287950[/C][/ROW]
[ROW][C]-2694.87743117034[/C][/ROW]
[ROW][C]-2389.69895794091[/C][/ROW]
[ROW][C]-3098.44432948766[/C][/ROW]
[ROW][C]-684.392243864269[/C][/ROW]
[ROW][C]-610.239395961192[/C][/ROW]
[ROW][C]-820.554571423557[/C][/ROW]
[ROW][C]1059.57883713138[/C][/ROW]
[ROW][C]1488.77309533581[/C][/ROW]
[ROW][C]-413.171491948611[/C][/ROW]
[ROW][C]2316.12974990559[/C][/ROW]
[ROW][C]-251.396547460378[/C][/ROW]
[ROW][C]2006.60908902554[/C][/ROW]
[ROW][C]817.01486653097[/C][/ROW]
[ROW][C]1195.71246096861[/C][/ROW]
[ROW][C]178.754301490753[/C][/ROW]
[ROW][C]573.646445069043[/C][/ROW]
[ROW][C]-145.313531086436[/C][/ROW]
[ROW][C]-1234.34065815956[/C][/ROW]
[ROW][C]475.727807695065[/C][/ROW]
[ROW][C]-19.4348201228450[/C][/ROW]
[ROW][C]1009.49118001091[/C][/ROW]
[ROW][C]1301.67809452914[/C][/ROW]
[ROW][C]1592.09241046984[/C][/ROW]
[ROW][C]461.106587649526[/C][/ROW]
[ROW][C]1350.06980835499[/C][/ROW]
[ROW][C]-359.907290984908[/C][/ROW]
[ROW][C]1658.19153873781[/C][/ROW]
[ROW][C]-401.916003248647[/C][/ROW]
[ROW][C]647.503733368985[/C][/ROW]
[ROW][C]503.30601962712[/C][/ROW]
[ROW][C]438.544663672869[/C][/ROW]
[ROW][C]648.790206010459[/C][/ROW]
[ROW][C]536.740370269297[/C][/ROW]
[ROW][C]1828.67845460724[/C][/ROW]
[ROW][C]2185.65833324480[/C][/ROW]
[ROW][C]-1363.27199063820[/C][/ROW]
[ROW][C]1667.41181874442[/C][/ROW]
[ROW][C]2011.45909554187[/C][/ROW]
[ROW][C]-280.587855086918[/C][/ROW]
[ROW][C]-1602.88796576521[/C][/ROW]
[ROW][C]-2174.79241855170[/C][/ROW]
[ROW][C]-826.828349049765[/C][/ROW]
[ROW][C]-430.180083168557[/C][/ROW]
[ROW][C]217.073744954625[/C][/ROW]
[ROW][C]1189.85182957685[/C][/ROW]
[ROW][C]-1053.43881597184[/C][/ROW]
[ROW][C]1303.25947620145[/C][/ROW]
[ROW][C]-831.008540643408[/C][/ROW]
[ROW][C]120.976411633416[/C][/ROW]
[ROW][C]-2042.71643918408[/C][/ROW]
[ROW][C]772.95794981167[/C][/ROW]
[ROW][C]-19.7245964015430[/C][/ROW]
[ROW][C]1041.18608410805[/C][/ROW]
[ROW][C]-950.786603329845[/C][/ROW]
[ROW][C]425.473405384187[/C][/ROW]
[ROW][C]-389.871204491628[/C][/ROW]
[ROW][C]347.369546934183[/C][/ROW]
[ROW][C]-1234.95278256936[/C][/ROW]
[ROW][C]-1000.89102762183[/C][/ROW]
[ROW][C]-1539.05335702142[/C][/ROW]
[ROW][C]954.78296640758[/C][/ROW]
[ROW][C]-1296.03080845692[/C][/ROW]
[ROW][C]-1384.61703782548[/C][/ROW]
[ROW][C]-1378.84153945584[/C][/ROW]
[ROW][C]-254.311954649641[/C][/ROW]
[ROW][C]1260.86376405155[/C][/ROW]
[ROW][C]-146.438113026696[/C][/ROW]
[ROW][C]1388.32615989028[/C][/ROW]
[ROW][C]-163.270464139842[/C][/ROW]
[ROW][C]145.751203749909[/C][/ROW]
[ROW][C]-2087.17487010315[/C][/ROW]
[ROW][C]-1455.34867322148[/C][/ROW]
[ROW][C]-4009.58910037171[/C][/ROW]
[ROW][C]-5771.45300903329[/C][/ROW]
[ROW][C]16905.9907887266[/C][/ROW]
[/TABLE]
Source: https://freestatistics.org/blog/index.php?pk=63650&T=2

Globally Unique Identifier (entire table): ba.freestatistics.org/blog/index.php?pk=63650&T=2

As an alternative you can also use a QR Code:  

The GUIDs for individual cells are displayed in the table below:

Estimated ARIMA Residuals
Value
-224.352448585086
90.2782060648381
1326.53645684760
-1351.84736054763
-2584.87183082932
-749.855355306601
-2217.94134085565
-2722.79602029646
-1662.62295029889
-1365.66429522788
-2638.03110287950
-2694.87743117034
-2389.69895794091
-3098.44432948766
-684.392243864269
-610.239395961192
-820.554571423557
1059.57883713138
1488.77309533581
-413.171491948611
2316.12974990559
-251.396547460378
2006.60908902554
817.01486653097
1195.71246096861
178.754301490753
573.646445069043
-145.313531086436
-1234.34065815956
475.727807695065
-19.4348201228450
1009.49118001091
1301.67809452914
1592.09241046984
461.106587649526
1350.06980835499
-359.907290984908
1658.19153873781
-401.916003248647
647.503733368985
503.30601962712
438.544663672869
648.790206010459
536.740370269297
1828.67845460724
2185.65833324480
-1363.27199063820
1667.41181874442
2011.45909554187
-280.587855086918
-1602.88796576521
-2174.79241855170
-826.828349049765
-430.180083168557
217.073744954625
1189.85182957685
-1053.43881597184
1303.25947620145
-831.008540643408
120.976411633416
-2042.71643918408
772.95794981167
-19.7245964015430
1041.18608410805
-950.786603329845
425.473405384187
-389.871204491628
347.369546934183
-1234.95278256936
-1000.89102762183
-1539.05335702142
954.78296640758
-1296.03080845692
-1384.61703782548
-1378.84153945584
-254.311954649641
1260.86376405155
-146.438113026696
1388.32615989028
-163.270464139842
145.751203749909
-2087.17487010315
-1455.34867322148
-4009.58910037171
-5771.45300903329
16905.9907887266


Parameters (Session):
par1 = FALSE ; par2 = 1 ; par3 = 1 ; par4 = 1 ; par5 = 4 ; par6 = 3 ; par7 = 1 ; par8 = 2 ; par9 = 1 ;
Parameters (R input):
par1 = FALSE ; par2 = 1 ; par3 = 1 ; par4 = 1 ; par5 = 4 ; par6 = 3 ; par7 = 1 ; par8 = 2 ; par9 = 1 ;
R code (references can be found in the software module):
library(lattice)
if (par1 == 'TRUE') par1 <- TRUE
if (par1 == 'FALSE') par1 <- FALSE
par2 <- as.numeric(par2) #Box-Cox lambda transformation parameter
par3 <- as.numeric(par3) #degree of non-seasonal differencing
par4 <- as.numeric(par4) #degree of seasonal differencing
par5 <- as.numeric(par5) #seasonal period
par6 <- as.numeric(par6) #degree (p) of the non-seasonal AR(p) polynomial
par7 <- as.numeric(par7) #degree (q) of the non-seasonal MA(q) polynomial
par8 <- as.numeric(par8) #degree (P) of the seasonal AR(P) polynomial
par9 <- as.numeric(par9) #degree (Q) of the seasonal MA(Q) polynomial
armaGR <- function(arima.out, names, n){
try1 <- arima.out$coef
try2 <- sqrt(diag(arima.out$var.coef))
try.data.frame <- data.frame(matrix(NA,ncol=4,nrow=length(names)))
dimnames(try.data.frame) <- list(names,c('coef','std','tstat','pv'))
try.data.frame[,1] <- try1
for(i in 1:length(try2)) try.data.frame[which(rownames(try.data.frame)==names(try2)[i]),2] <- try2[i]
try.data.frame[,3] <- try.data.frame[,1] / try.data.frame[,2]
try.data.frame[,4] <- round((1-pt(abs(try.data.frame[,3]),df=n-(length(try2)+1)))*2,5)
vector <- rep(NA,length(names))
vector[is.na(try.data.frame[,4])] <- 0
maxi <- which.max(try.data.frame[,4])
continue <- max(try.data.frame[,4],na.rm=TRUE) > .05
vector[maxi] <- 0
list(summary=try.data.frame,next.vector=vector,continue=continue)
}
arimaSelect <- function(series, order=c(13,0,0), seasonal=list(order=c(2,0,0),period=12), include.mean=F){
nrc <- order[1]+order[3]+seasonal$order[1]+seasonal$order[3]
coeff <- matrix(NA, nrow=nrc*2, ncol=nrc)
pval <- matrix(NA, nrow=nrc*2, ncol=nrc)
mylist <- rep(list(NULL), nrc)
names <- NULL
if(order[1] > 0) names <- paste('ar',1:order[1],sep='')
if(order[3] > 0) names <- c( names , paste('ma',1:order[3],sep='') )
if(seasonal$order[1] > 0) names <- c(names, paste('sar',1:seasonal$order[1],sep=''))
if(seasonal$order[3] > 0) names <- c(names, paste('sma',1:seasonal$order[3],sep=''))
arima.out <- arima(series, order=order, seasonal=seasonal, include.mean=include.mean, method='ML')
mylist[[1]] <- arima.out
last.arma <- armaGR(arima.out, names, length(series))
mystop <- FALSE
i <- 1
coeff[i,] <- last.arma[[1]][,1]
pval [i,] <- last.arma[[1]][,4]
i <- 2
aic <- arima.out$aic
while(!mystop){
mylist[[i]] <- arima.out
arima.out <- arima(series, order=order, seasonal=seasonal, include.mean=include.mean, method='ML', fixed=last.arma$next.vector)
aic <- c(aic, arima.out$aic)
last.arma <- armaGR(arima.out, names, length(series))
mystop <- !last.arma$continue
coeff[i,] <- last.arma[[1]][,1]
pval [i,] <- last.arma[[1]][,4]
i <- i+1
}
list(coeff, pval, mylist, aic=aic)
}
arimaSelectplot <- function(arimaSelect.out,noms,choix){
noms <- names(arimaSelect.out[[3]][[1]]$coef)
coeff <- arimaSelect.out[[1]]
k <- min(which(is.na(coeff[,1])))-1
coeff <- coeff[1:k,]
pval <- arimaSelect.out[[2]][1:k,]
aic <- arimaSelect.out$aic[1:k]
coeff[coeff==0] <- NA
n <- ncol(coeff)
if(missing(choix)) choix <- k
layout(matrix(c(1,1,1,2,
3,3,3,2,
3,3,3,4,
5,6,7,7),nr=4),
widths=c(10,35,45,15),
heights=c(30,30,15,15))
couleurs <- rainbow(75)[1:50]#(50)
ticks <- pretty(coeff)
par(mar=c(1,1,3,1))
plot(aic,k:1-.5,type='o',pch=21,bg='blue',cex=2,axes=F,lty=2,xpd=NA)
points(aic[choix],k-choix+.5,pch=21,cex=4,bg=2,xpd=NA)
title('aic',line=2)
par(mar=c(3,0,0,0))
plot(0,axes=F,xlab='',ylab='',xlim=range(ticks),ylim=c(.1,1))
rect(xleft = min(ticks) + (0:49)/50*(max(ticks)-min(ticks)),
xright = min(ticks) + (1:50)/50*(max(ticks)-min(ticks)),
ytop = rep(1,50),
ybottom= rep(0,50),col=couleurs,border=NA)
axis(1,ticks)
rect(xleft=min(ticks),xright=max(ticks),ytop=1,ybottom=0)
text(mean(coeff,na.rm=T),.5,'coefficients',cex=2,font=2)
par(mar=c(1,1,3,1))
image(1:n,1:k,t(coeff[k:1,]),axes=F,col=couleurs,zlim=range(ticks))
for(i in 1:n) for(j in 1:k) if(!is.na(coeff[j,i])) {
if(pval[j,i]<.01) symb = 'green'
else if( (pval[j,i]<.05) & (pval[j,i]>=.01)) symb = 'orange'
else if( (pval[j,i]<.1) & (pval[j,i]>=.05)) symb = 'red'
else symb = 'black'
polygon(c(i+.5 ,i+.2 ,i+.5 ,i+.5),
c(k-j+0.5,k-j+0.5,k-j+0.8,k-j+0.5),
col=symb)
if(j==choix) {
rect(xleft=i-.5,
xright=i+.5,
ybottom=k-j+1.5,
ytop=k-j+.5,
lwd=4)
text(i,
k-j+1,
round(coeff[j,i],2),
cex=1.2,
font=2)
}
else{
rect(xleft=i-.5,xright=i+.5,ybottom=k-j+1.5,ytop=k-j+.5)
text(i,k-j+1,round(coeff[j,i],2),cex=1.2,font=1)
}
}
axis(3,1:n,noms)
par(mar=c(0.5,0,0,0.5))
plot(0,axes=F,xlab='',ylab='',type='n',xlim=c(0,8),ylim=c(-.2,.8))
cols <- c('green','orange','red','black')
niv <- c('0','0.01','0.05','0.1')
for(i in 0:3){
polygon(c(1+2*i ,1+2*i ,1+2*i-.5 ,1+2*i),
c(.4 ,.7 , .4 , .4),
col=cols[i+1])
text(2*i,0.5,niv[i+1],cex=1.5)
}
text(8,.5,1,cex=1.5)
text(4,0,'p-value',cex=2)
box()
residus <- arimaSelect.out[[3]][[choix]]$res
par(mar=c(1,2,4,1))
acf(residus,main='')
title('acf',line=.5)
par(mar=c(1,2,4,1))
pacf(residus,main='')
title('pacf',line=.5)
par(mar=c(2,2,4,1))
qqnorm(residus,main='')
title('qq-norm',line=.5)
qqline(residus)
residus
}
if (par2 == 0) x <- log(x)
if (par2 != 0) x <- x^par2
(selection <- arimaSelect(x, order=c(par6,par3,par7), seasonal=list(order=c(par8,par4,par9), period=par5)))
bitmap(file='test1.png')
resid <- arimaSelectplot(selection)
dev.off()
resid
bitmap(file='test2.png')
acf(resid,length(resid)/2, main='Residual Autocorrelation Function')
dev.off()
bitmap(file='test3.png')
pacf(resid,length(resid)/2, main='Residual Partial Autocorrelation Function')
dev.off()
bitmap(file='test4.png')
cpgram(resid, main='Residual Cumulative Periodogram')
dev.off()
bitmap(file='test5.png')
hist(resid, main='Residual Histogram', xlab='values of Residuals')
dev.off()
bitmap(file='test6.png')
densityplot(~resid,col='black',main='Residual Density Plot', xlab='values of Residuals')
dev.off()
bitmap(file='test7.png')
qqnorm(resid, main='Residual Normal Q-Q Plot')
qqline(resid)
dev.off()
ncols <- length(selection[[1]][1,])
nrows <- length(selection[[2]][,1])-1
load(file='createtable')
a<-table.start()
a<-table.row.start(a)
a<-table.element(a,'ARIMA Parameter Estimation and Backward Selection', ncols+1,TRUE)
a<-table.row.end(a)
a<-table.row.start(a)
a<-table.element(a,'Iteration', header=TRUE)
for (i in 1:ncols) {
a<-table.element(a,names(selection[[3]][[1]]$coef)[i],header=TRUE)
}
a<-table.row.end(a)
for (j in 1:nrows) {
a<-table.row.start(a)
mydum <- 'Estimates ('
mydum <- paste(mydum,j)
mydum <- paste(mydum,')')
a<-table.element(a,mydum, header=TRUE)
for (i in 1:ncols) {
a<-table.element(a,round(selection[[1]][j,i],4))
}
a<-table.row.end(a)
a<-table.row.start(a)
a<-table.element(a,'(p-val)', header=TRUE)
for (i in 1:ncols) {
mydum <- '('
mydum <- paste(mydum,round(selection[[2]][j,i],4),sep='')
mydum <- paste(mydum,')')
a<-table.element(a,mydum)
}
a<-table.row.end(a)
}
a<-table.end(a)
table.save(a,file='mytable.tab')
a<-table.start()
a<-table.row.start(a)
a<-table.element(a,'Estimated ARIMA Residuals', 1,TRUE)
a<-table.row.end(a)
a<-table.row.start(a)
a<-table.element(a,'Value', 1,TRUE)
a<-table.row.end(a)
for (i in (par4*par5+par3):length(resid)) {
a<-table.row.start(a)
a<-table.element(a,resid[i])
a<-table.row.end(a)
}
a<-table.end(a)
table.save(a,file='mytable1.tab')