Free Statistics

of Irreproducible Research!

Author's title

Author*The author of this computation has been verified*
R Software Modulerwasp_exponentialsmoothing.wasp
Title produced by softwareExponential Smoothing
Date of computationFri, 04 Dec 2009 08:04:59 -0700
Cite this page as followsStatistical Computations at FreeStatistics.org, Office for Research Development and Education, URL https://freestatistics.org/blog/index.php?v=date/2009/Dec/04/t1259939172qbupw8d5owqd628.htm/, Retrieved Sat, 27 Apr 2024 19:05:08 +0000
Statistical Computations at FreeStatistics.org, Office for Research Development and Education, URL https://freestatistics.org/blog/index.php?pk=63714, Retrieved Sat, 27 Apr 2024 19:05:08 +0000
QR Codes:

Original text written by user:
IsPrivate?No (this computation is public)
User-defined keywords
Estimated Impact85
Family? (F = Feedback message, R = changed R code, M = changed R Module, P = changed Parameters, D = changed Data)
-     [Univariate Data Series] [data set] [2008-12-01 19:54:57] [b98453cac15ba1066b407e146608df68]
- RMP   [Exponential Smoothing] [] [2009-11-27 15:04:36] [b98453cac15ba1066b407e146608df68]
-   PD      [Exponential Smoothing] [] [2009-12-04 15:04:59] [27b6e36591879260e4dc6bb7e89a38fd] [Current]
Feedback Forum

Post a new message
Dataseries X:
455
456
517
525
523
519
509
512
519
517
510
509
501
507
569
580
578
565
547
555
562
561
555
544
537
543
594
611
613
611
594
595
591
589
584
573
567
569
621
629
628
612
595
597
593
590
580
574
573
573
620
626
620
588
566
557
561
549
532
526
511
499
555
565
542
527
510
514
517
508
493
490
469
478
528
534
518
506
502
516
528
533
536
537
524
536
587
597
581
564


Summary of computational transaction
Raw Inputview raw input (R code)
Raw Outputview raw output of R engine
Computing time2 seconds
R Server'Gwilym Jenkins' @ 72.249.127.135

\begin{tabular}{lllllllll}
\hline
Summary of computational transaction \tabularnewline
Raw Input & view raw input (R code)  \tabularnewline
Raw Output & view raw output of R engine  \tabularnewline
Computing time & 2 seconds \tabularnewline
R Server & 'Gwilym Jenkins' @ 72.249.127.135 \tabularnewline
\hline
\end{tabular}
%Source: https://freestatistics.org/blog/index.php?pk=63714&T=0

[TABLE]
[ROW][C]Summary of computational transaction[/C][/ROW]
[ROW][C]Raw Input[/C][C]view raw input (R code) [/C][/ROW]
[ROW][C]Raw Output[/C][C]view raw output of R engine [/C][/ROW]
[ROW][C]Computing time[/C][C]2 seconds[/C][/ROW]
[ROW][C]R Server[/C][C]'Gwilym Jenkins' @ 72.249.127.135[/C][/ROW]
[/TABLE]
Source: https://freestatistics.org/blog/index.php?pk=63714&T=0

Globally Unique Identifier (entire table): ba.freestatistics.org/blog/index.php?pk=63714&T=0

As an alternative you can also use a QR Code:  

The GUIDs for individual cells are displayed in the table below:

Summary of computational transaction
Raw Inputview raw input (R code)
Raw Outputview raw output of R engine
Computing time2 seconds
R Server'Gwilym Jenkins' @ 72.249.127.135


Estimated Parameters of Exponential Smoothing
ParameterValue
alpha0.906716756463771
beta0.161303402714018
gamma1

\begin{tabular}{lllllllll}
\hline
Estimated Parameters of Exponential Smoothing \tabularnewline
Parameter & Value \tabularnewline
alpha & 0.906716756463771 \tabularnewline
beta & 0.161303402714018 \tabularnewline
gamma & 1 \tabularnewline
\hline
\end{tabular}
%Source: https://freestatistics.org/blog/index.php?pk=63714&T=1

[TABLE]
[ROW][C]Estimated Parameters of Exponential Smoothing[/C][/ROW]
[ROW][C]Parameter[/C][C]Value[/C][/ROW]
[ROW][C]alpha[/C][C]0.906716756463771[/C][/ROW]
[ROW][C]beta[/C][C]0.161303402714018[/C][/ROW]
[ROW][C]gamma[/C][C]1[/C][/ROW]
[/TABLE]
Source: https://freestatistics.org/blog/index.php?pk=63714&T=1

Globally Unique Identifier (entire table): ba.freestatistics.org/blog/index.php?pk=63714&T=1

As an alternative you can also use a QR Code:  

The GUIDs for individual cells are displayed in the table below:

Estimated Parameters of Exponential Smoothing
ParameterValue
alpha0.906716756463771
beta0.161303402714018
gamma1


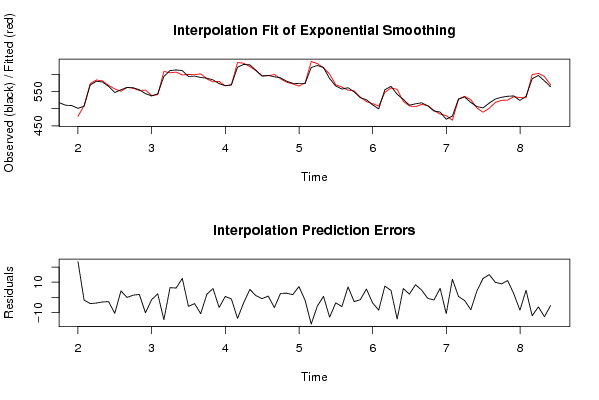
Interpolation Forecasts of Exponential Smoothing
tObservedFittedResiduals
13501477.3641156846923.6358843153104
14507508.737656888438-1.73765688843827
15569573.0868308734-4.08683087339978
16580583.691408167292-3.69140816729248
17578580.990102846686-2.99010284668611
18565567.804956761505-2.80495676150542
19547557.477105238679-10.4771052386786
20555550.7296546708694.27034532913115
21562562.032785957684-0.0327859576843821
22561559.5054414667261.49455853327368
23555553.0156761525971.98432384740272
24544554.144649566413-10.1446495664131
25537538.489914752371-1.48991475237074
26543540.6626012971182.33739870288230
27594608.694561837865-14.6945618378645
28611604.5422506163956.45774938360466
29613606.8192173523046.18078264769554
30611598.42281628370212.5771837162981
31594599.896870725808-5.8968707258075
32595599.056049737648-4.05604973764764
33591601.727567908138-10.7275679081380
34589586.8835900971152.11640990288470
35584578.1334510974525.8665489025484
36573579.627309598472-6.62730959847158
37567566.3457531366370.654246863362914
38569570.039498371553-1.03949837155278
39621634.832382917607-13.832382917607
40629632.514245841616-3.51424584161623
41628622.7356200235555.2643799764445
42612610.8335923776941.16640762230645
43595595.808827467011-0.80882746701127
44597596.0924669546920.9075330453079
45593599.688692757083-6.688692757083
46590587.3459638105182.65403618948153
47580577.207120091212.79287990878981
48574572.1832389526451.81676104735516
49573565.8614291409817.13857085901907
50573574.867786819753-1.86778681975318
51620637.551480369679-17.5514803696786
52626631.669886919662-5.6698869196623
53620619.3079556695930.692044330407157
54588601.028391871878-13.0283918718781
55566569.543672124262-3.54367212426234
56557563.037735417609-6.03773541760893
57561554.063512262126.93648773787982
58549551.781480708785-2.7814807087849
59532533.448497776438-1.44849777643765
60526520.4569723001215.54302769987873
61511514.60077667424-3.60077667423991
62499507.372225536103-8.37222553610292
63555547.5095899831557.49041001684463
64565560.4223283219014.57767167809902
65542556.202888754084-14.2028887540840
66527521.1500293041875.84997069581323
67510507.8055320312152.19446796878498
68514505.5931487612958.40685123870549
69517512.2050344671994.79496553280057
70508508.68416094887-0.68416094886993
71493494.675223013624-1.67522301362391
72490484.0030424153115.9969575846888
73469479.708725773371-10.7087257733709
74478466.00473612205311.9952638779475
75528527.3766176709170.62338232908337
76534536.049662457725-2.04966245772505
77518526.160612169776-8.16061216977585
78506501.6623535066214.33764649337888
79502489.48380605804112.5161939419589
80516501.00195616327714.9980438367234
81528518.051373764589.94862623542042
82533524.0690099079788.93099009202217
83536524.91646507756111.0835349224392
84537534.5593159742892.44068402571122
85524532.404508643861-8.40450864386094
86536531.271545155294.72845484471009
87587599.076817238046-12.0768172380461
88597603.244136809009-6.24413680900909
89581593.67169170928-12.6716917092793
90564569.365601685006-5.36560168500637

\begin{tabular}{lllllllll}
\hline
Interpolation Forecasts of Exponential Smoothing \tabularnewline
t & Observed & Fitted & Residuals \tabularnewline
13 & 501 & 477.36411568469 & 23.6358843153104 \tabularnewline
14 & 507 & 508.737656888438 & -1.73765688843827 \tabularnewline
15 & 569 & 573.0868308734 & -4.08683087339978 \tabularnewline
16 & 580 & 583.691408167292 & -3.69140816729248 \tabularnewline
17 & 578 & 580.990102846686 & -2.99010284668611 \tabularnewline
18 & 565 & 567.804956761505 & -2.80495676150542 \tabularnewline
19 & 547 & 557.477105238679 & -10.4771052386786 \tabularnewline
20 & 555 & 550.729654670869 & 4.27034532913115 \tabularnewline
21 & 562 & 562.032785957684 & -0.0327859576843821 \tabularnewline
22 & 561 & 559.505441466726 & 1.49455853327368 \tabularnewline
23 & 555 & 553.015676152597 & 1.98432384740272 \tabularnewline
24 & 544 & 554.144649566413 & -10.1446495664131 \tabularnewline
25 & 537 & 538.489914752371 & -1.48991475237074 \tabularnewline
26 & 543 & 540.662601297118 & 2.33739870288230 \tabularnewline
27 & 594 & 608.694561837865 & -14.6945618378645 \tabularnewline
28 & 611 & 604.542250616395 & 6.45774938360466 \tabularnewline
29 & 613 & 606.819217352304 & 6.18078264769554 \tabularnewline
30 & 611 & 598.422816283702 & 12.5771837162981 \tabularnewline
31 & 594 & 599.896870725808 & -5.8968707258075 \tabularnewline
32 & 595 & 599.056049737648 & -4.05604973764764 \tabularnewline
33 & 591 & 601.727567908138 & -10.7275679081380 \tabularnewline
34 & 589 & 586.883590097115 & 2.11640990288470 \tabularnewline
35 & 584 & 578.133451097452 & 5.8665489025484 \tabularnewline
36 & 573 & 579.627309598472 & -6.62730959847158 \tabularnewline
37 & 567 & 566.345753136637 & 0.654246863362914 \tabularnewline
38 & 569 & 570.039498371553 & -1.03949837155278 \tabularnewline
39 & 621 & 634.832382917607 & -13.832382917607 \tabularnewline
40 & 629 & 632.514245841616 & -3.51424584161623 \tabularnewline
41 & 628 & 622.735620023555 & 5.2643799764445 \tabularnewline
42 & 612 & 610.833592377694 & 1.16640762230645 \tabularnewline
43 & 595 & 595.808827467011 & -0.80882746701127 \tabularnewline
44 & 597 & 596.092466954692 & 0.9075330453079 \tabularnewline
45 & 593 & 599.688692757083 & -6.688692757083 \tabularnewline
46 & 590 & 587.345963810518 & 2.65403618948153 \tabularnewline
47 & 580 & 577.20712009121 & 2.79287990878981 \tabularnewline
48 & 574 & 572.183238952645 & 1.81676104735516 \tabularnewline
49 & 573 & 565.861429140981 & 7.13857085901907 \tabularnewline
50 & 573 & 574.867786819753 & -1.86778681975318 \tabularnewline
51 & 620 & 637.551480369679 & -17.5514803696786 \tabularnewline
52 & 626 & 631.669886919662 & -5.6698869196623 \tabularnewline
53 & 620 & 619.307955669593 & 0.692044330407157 \tabularnewline
54 & 588 & 601.028391871878 & -13.0283918718781 \tabularnewline
55 & 566 & 569.543672124262 & -3.54367212426234 \tabularnewline
56 & 557 & 563.037735417609 & -6.03773541760893 \tabularnewline
57 & 561 & 554.06351226212 & 6.93648773787982 \tabularnewline
58 & 549 & 551.781480708785 & -2.7814807087849 \tabularnewline
59 & 532 & 533.448497776438 & -1.44849777643765 \tabularnewline
60 & 526 & 520.456972300121 & 5.54302769987873 \tabularnewline
61 & 511 & 514.60077667424 & -3.60077667423991 \tabularnewline
62 & 499 & 507.372225536103 & -8.37222553610292 \tabularnewline
63 & 555 & 547.509589983155 & 7.49041001684463 \tabularnewline
64 & 565 & 560.422328321901 & 4.57767167809902 \tabularnewline
65 & 542 & 556.202888754084 & -14.2028887540840 \tabularnewline
66 & 527 & 521.150029304187 & 5.84997069581323 \tabularnewline
67 & 510 & 507.805532031215 & 2.19446796878498 \tabularnewline
68 & 514 & 505.593148761295 & 8.40685123870549 \tabularnewline
69 & 517 & 512.205034467199 & 4.79496553280057 \tabularnewline
70 & 508 & 508.68416094887 & -0.68416094886993 \tabularnewline
71 & 493 & 494.675223013624 & -1.67522301362391 \tabularnewline
72 & 490 & 484.003042415311 & 5.9969575846888 \tabularnewline
73 & 469 & 479.708725773371 & -10.7087257733709 \tabularnewline
74 & 478 & 466.004736122053 & 11.9952638779475 \tabularnewline
75 & 528 & 527.376617670917 & 0.62338232908337 \tabularnewline
76 & 534 & 536.049662457725 & -2.04966245772505 \tabularnewline
77 & 518 & 526.160612169776 & -8.16061216977585 \tabularnewline
78 & 506 & 501.662353506621 & 4.33764649337888 \tabularnewline
79 & 502 & 489.483806058041 & 12.5161939419589 \tabularnewline
80 & 516 & 501.001956163277 & 14.9980438367234 \tabularnewline
81 & 528 & 518.05137376458 & 9.94862623542042 \tabularnewline
82 & 533 & 524.069009907978 & 8.93099009202217 \tabularnewline
83 & 536 & 524.916465077561 & 11.0835349224392 \tabularnewline
84 & 537 & 534.559315974289 & 2.44068402571122 \tabularnewline
85 & 524 & 532.404508643861 & -8.40450864386094 \tabularnewline
86 & 536 & 531.27154515529 & 4.72845484471009 \tabularnewline
87 & 587 & 599.076817238046 & -12.0768172380461 \tabularnewline
88 & 597 & 603.244136809009 & -6.24413680900909 \tabularnewline
89 & 581 & 593.67169170928 & -12.6716917092793 \tabularnewline
90 & 564 & 569.365601685006 & -5.36560168500637 \tabularnewline
\hline
\end{tabular}
%Source: https://freestatistics.org/blog/index.php?pk=63714&T=2

[TABLE]
[ROW][C]Interpolation Forecasts of Exponential Smoothing[/C][/ROW]
[ROW][C]t[/C][C]Observed[/C][C]Fitted[/C][C]Residuals[/C][/ROW]
[ROW][C]13[/C][C]501[/C][C]477.36411568469[/C][C]23.6358843153104[/C][/ROW]
[ROW][C]14[/C][C]507[/C][C]508.737656888438[/C][C]-1.73765688843827[/C][/ROW]
[ROW][C]15[/C][C]569[/C][C]573.0868308734[/C][C]-4.08683087339978[/C][/ROW]
[ROW][C]16[/C][C]580[/C][C]583.691408167292[/C][C]-3.69140816729248[/C][/ROW]
[ROW][C]17[/C][C]578[/C][C]580.990102846686[/C][C]-2.99010284668611[/C][/ROW]
[ROW][C]18[/C][C]565[/C][C]567.804956761505[/C][C]-2.80495676150542[/C][/ROW]
[ROW][C]19[/C][C]547[/C][C]557.477105238679[/C][C]-10.4771052386786[/C][/ROW]
[ROW][C]20[/C][C]555[/C][C]550.729654670869[/C][C]4.27034532913115[/C][/ROW]
[ROW][C]21[/C][C]562[/C][C]562.032785957684[/C][C]-0.0327859576843821[/C][/ROW]
[ROW][C]22[/C][C]561[/C][C]559.505441466726[/C][C]1.49455853327368[/C][/ROW]
[ROW][C]23[/C][C]555[/C][C]553.015676152597[/C][C]1.98432384740272[/C][/ROW]
[ROW][C]24[/C][C]544[/C][C]554.144649566413[/C][C]-10.1446495664131[/C][/ROW]
[ROW][C]25[/C][C]537[/C][C]538.489914752371[/C][C]-1.48991475237074[/C][/ROW]
[ROW][C]26[/C][C]543[/C][C]540.662601297118[/C][C]2.33739870288230[/C][/ROW]
[ROW][C]27[/C][C]594[/C][C]608.694561837865[/C][C]-14.6945618378645[/C][/ROW]
[ROW][C]28[/C][C]611[/C][C]604.542250616395[/C][C]6.45774938360466[/C][/ROW]
[ROW][C]29[/C][C]613[/C][C]606.819217352304[/C][C]6.18078264769554[/C][/ROW]
[ROW][C]30[/C][C]611[/C][C]598.422816283702[/C][C]12.5771837162981[/C][/ROW]
[ROW][C]31[/C][C]594[/C][C]599.896870725808[/C][C]-5.8968707258075[/C][/ROW]
[ROW][C]32[/C][C]595[/C][C]599.056049737648[/C][C]-4.05604973764764[/C][/ROW]
[ROW][C]33[/C][C]591[/C][C]601.727567908138[/C][C]-10.7275679081380[/C][/ROW]
[ROW][C]34[/C][C]589[/C][C]586.883590097115[/C][C]2.11640990288470[/C][/ROW]
[ROW][C]35[/C][C]584[/C][C]578.133451097452[/C][C]5.8665489025484[/C][/ROW]
[ROW][C]36[/C][C]573[/C][C]579.627309598472[/C][C]-6.62730959847158[/C][/ROW]
[ROW][C]37[/C][C]567[/C][C]566.345753136637[/C][C]0.654246863362914[/C][/ROW]
[ROW][C]38[/C][C]569[/C][C]570.039498371553[/C][C]-1.03949837155278[/C][/ROW]
[ROW][C]39[/C][C]621[/C][C]634.832382917607[/C][C]-13.832382917607[/C][/ROW]
[ROW][C]40[/C][C]629[/C][C]632.514245841616[/C][C]-3.51424584161623[/C][/ROW]
[ROW][C]41[/C][C]628[/C][C]622.735620023555[/C][C]5.2643799764445[/C][/ROW]
[ROW][C]42[/C][C]612[/C][C]610.833592377694[/C][C]1.16640762230645[/C][/ROW]
[ROW][C]43[/C][C]595[/C][C]595.808827467011[/C][C]-0.80882746701127[/C][/ROW]
[ROW][C]44[/C][C]597[/C][C]596.092466954692[/C][C]0.9075330453079[/C][/ROW]
[ROW][C]45[/C][C]593[/C][C]599.688692757083[/C][C]-6.688692757083[/C][/ROW]
[ROW][C]46[/C][C]590[/C][C]587.345963810518[/C][C]2.65403618948153[/C][/ROW]
[ROW][C]47[/C][C]580[/C][C]577.20712009121[/C][C]2.79287990878981[/C][/ROW]
[ROW][C]48[/C][C]574[/C][C]572.183238952645[/C][C]1.81676104735516[/C][/ROW]
[ROW][C]49[/C][C]573[/C][C]565.861429140981[/C][C]7.13857085901907[/C][/ROW]
[ROW][C]50[/C][C]573[/C][C]574.867786819753[/C][C]-1.86778681975318[/C][/ROW]
[ROW][C]51[/C][C]620[/C][C]637.551480369679[/C][C]-17.5514803696786[/C][/ROW]
[ROW][C]52[/C][C]626[/C][C]631.669886919662[/C][C]-5.6698869196623[/C][/ROW]
[ROW][C]53[/C][C]620[/C][C]619.307955669593[/C][C]0.692044330407157[/C][/ROW]
[ROW][C]54[/C][C]588[/C][C]601.028391871878[/C][C]-13.0283918718781[/C][/ROW]
[ROW][C]55[/C][C]566[/C][C]569.543672124262[/C][C]-3.54367212426234[/C][/ROW]
[ROW][C]56[/C][C]557[/C][C]563.037735417609[/C][C]-6.03773541760893[/C][/ROW]
[ROW][C]57[/C][C]561[/C][C]554.06351226212[/C][C]6.93648773787982[/C][/ROW]
[ROW][C]58[/C][C]549[/C][C]551.781480708785[/C][C]-2.7814807087849[/C][/ROW]
[ROW][C]59[/C][C]532[/C][C]533.448497776438[/C][C]-1.44849777643765[/C][/ROW]
[ROW][C]60[/C][C]526[/C][C]520.456972300121[/C][C]5.54302769987873[/C][/ROW]
[ROW][C]61[/C][C]511[/C][C]514.60077667424[/C][C]-3.60077667423991[/C][/ROW]
[ROW][C]62[/C][C]499[/C][C]507.372225536103[/C][C]-8.37222553610292[/C][/ROW]
[ROW][C]63[/C][C]555[/C][C]547.509589983155[/C][C]7.49041001684463[/C][/ROW]
[ROW][C]64[/C][C]565[/C][C]560.422328321901[/C][C]4.57767167809902[/C][/ROW]
[ROW][C]65[/C][C]542[/C][C]556.202888754084[/C][C]-14.2028887540840[/C][/ROW]
[ROW][C]66[/C][C]527[/C][C]521.150029304187[/C][C]5.84997069581323[/C][/ROW]
[ROW][C]67[/C][C]510[/C][C]507.805532031215[/C][C]2.19446796878498[/C][/ROW]
[ROW][C]68[/C][C]514[/C][C]505.593148761295[/C][C]8.40685123870549[/C][/ROW]
[ROW][C]69[/C][C]517[/C][C]512.205034467199[/C][C]4.79496553280057[/C][/ROW]
[ROW][C]70[/C][C]508[/C][C]508.68416094887[/C][C]-0.68416094886993[/C][/ROW]
[ROW][C]71[/C][C]493[/C][C]494.675223013624[/C][C]-1.67522301362391[/C][/ROW]
[ROW][C]72[/C][C]490[/C][C]484.003042415311[/C][C]5.9969575846888[/C][/ROW]
[ROW][C]73[/C][C]469[/C][C]479.708725773371[/C][C]-10.7087257733709[/C][/ROW]
[ROW][C]74[/C][C]478[/C][C]466.004736122053[/C][C]11.9952638779475[/C][/ROW]
[ROW][C]75[/C][C]528[/C][C]527.376617670917[/C][C]0.62338232908337[/C][/ROW]
[ROW][C]76[/C][C]534[/C][C]536.049662457725[/C][C]-2.04966245772505[/C][/ROW]
[ROW][C]77[/C][C]518[/C][C]526.160612169776[/C][C]-8.16061216977585[/C][/ROW]
[ROW][C]78[/C][C]506[/C][C]501.662353506621[/C][C]4.33764649337888[/C][/ROW]
[ROW][C]79[/C][C]502[/C][C]489.483806058041[/C][C]12.5161939419589[/C][/ROW]
[ROW][C]80[/C][C]516[/C][C]501.001956163277[/C][C]14.9980438367234[/C][/ROW]
[ROW][C]81[/C][C]528[/C][C]518.05137376458[/C][C]9.94862623542042[/C][/ROW]
[ROW][C]82[/C][C]533[/C][C]524.069009907978[/C][C]8.93099009202217[/C][/ROW]
[ROW][C]83[/C][C]536[/C][C]524.916465077561[/C][C]11.0835349224392[/C][/ROW]
[ROW][C]84[/C][C]537[/C][C]534.559315974289[/C][C]2.44068402571122[/C][/ROW]
[ROW][C]85[/C][C]524[/C][C]532.404508643861[/C][C]-8.40450864386094[/C][/ROW]
[ROW][C]86[/C][C]536[/C][C]531.27154515529[/C][C]4.72845484471009[/C][/ROW]
[ROW][C]87[/C][C]587[/C][C]599.076817238046[/C][C]-12.0768172380461[/C][/ROW]
[ROW][C]88[/C][C]597[/C][C]603.244136809009[/C][C]-6.24413680900909[/C][/ROW]
[ROW][C]89[/C][C]581[/C][C]593.67169170928[/C][C]-12.6716917092793[/C][/ROW]
[ROW][C]90[/C][C]564[/C][C]569.365601685006[/C][C]-5.36560168500637[/C][/ROW]
[/TABLE]
Source: https://freestatistics.org/blog/index.php?pk=63714&T=2

Globally Unique Identifier (entire table): ba.freestatistics.org/blog/index.php?pk=63714&T=2

As an alternative you can also use a QR Code:  

The GUIDs for individual cells are displayed in the table below:

Interpolation Forecasts of Exponential Smoothing
tObservedFittedResiduals
13501477.3641156846923.6358843153104
14507508.737656888438-1.73765688843827
15569573.0868308734-4.08683087339978
16580583.691408167292-3.69140816729248
17578580.990102846686-2.99010284668611
18565567.804956761505-2.80495676150542
19547557.477105238679-10.4771052386786
20555550.7296546708694.27034532913115
21562562.032785957684-0.0327859576843821
22561559.5054414667261.49455853327368
23555553.0156761525971.98432384740272
24544554.144649566413-10.1446495664131
25537538.489914752371-1.48991475237074
26543540.6626012971182.33739870288230
27594608.694561837865-14.6945618378645
28611604.5422506163956.45774938360466
29613606.8192173523046.18078264769554
30611598.42281628370212.5771837162981
31594599.896870725808-5.8968707258075
32595599.056049737648-4.05604973764764
33591601.727567908138-10.7275679081380
34589586.8835900971152.11640990288470
35584578.1334510974525.8665489025484
36573579.627309598472-6.62730959847158
37567566.3457531366370.654246863362914
38569570.039498371553-1.03949837155278
39621634.832382917607-13.832382917607
40629632.514245841616-3.51424584161623
41628622.7356200235555.2643799764445
42612610.8335923776941.16640762230645
43595595.808827467011-0.80882746701127
44597596.0924669546920.9075330453079
45593599.688692757083-6.688692757083
46590587.3459638105182.65403618948153
47580577.207120091212.79287990878981
48574572.1832389526451.81676104735516
49573565.8614291409817.13857085901907
50573574.867786819753-1.86778681975318
51620637.551480369679-17.5514803696786
52626631.669886919662-5.6698869196623
53620619.3079556695930.692044330407157
54588601.028391871878-13.0283918718781
55566569.543672124262-3.54367212426234
56557563.037735417609-6.03773541760893
57561554.063512262126.93648773787982
58549551.781480708785-2.7814807087849
59532533.448497776438-1.44849777643765
60526520.4569723001215.54302769987873
61511514.60077667424-3.60077667423991
62499507.372225536103-8.37222553610292
63555547.5095899831557.49041001684463
64565560.4223283219014.57767167809902
65542556.202888754084-14.2028887540840
66527521.1500293041875.84997069581323
67510507.8055320312152.19446796878498
68514505.5931487612958.40685123870549
69517512.2050344671994.79496553280057
70508508.68416094887-0.68416094886993
71493494.675223013624-1.67522301362391
72490484.0030424153115.9969575846888
73469479.708725773371-10.7087257733709
74478466.00473612205311.9952638779475
75528527.3766176709170.62338232908337
76534536.049662457725-2.04966245772505
77518526.160612169776-8.16061216977585
78506501.6623535066214.33764649337888
79502489.48380605804112.5161939419589
80516501.00195616327714.9980438367234
81528518.051373764589.94862623542042
82533524.0690099079788.93099009202217
83536524.91646507756111.0835349224392
84537534.5593159742892.44068402571122
85524532.404508643861-8.40450864386094
86536531.271545155294.72845484471009
87587599.076817238046-12.0768172380461
88597603.244136809009-6.24413680900909
89581593.67169170928-12.6716917092793
90564569.365601685006-5.36560168500637


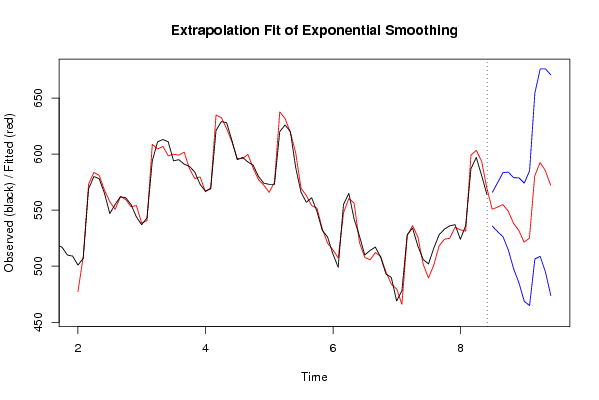
Extrapolation Forecasts of Exponential Smoothing
tForecast95% Lower Bound95% Upper Bound
91550.831518797796535.704880127584565.958157468008
92552.658046829374530.667581587187574.648512071562
93554.882651899764526.31249226132583.452811538207
94549.190992721756514.421724165481583.96026127803
95538.274955498514497.633118837529578.9167921595
96531.967718547043485.125805550542578.809631543544
97521.376289153361468.668977268996574.083601037726
98524.968025583507464.896770212826585.039280954188
99580.451063453985506.402523682629654.49960322534
100592.380356152948508.815697400668675.945014905228
101585.255286759573494.570513253785675.940060265361
102572.23232009109473.816801599748670.647838582431

\begin{tabular}{lllllllll}
\hline
Extrapolation Forecasts of Exponential Smoothing \tabularnewline
t & Forecast & 95% Lower Bound & 95% Upper Bound \tabularnewline
91 & 550.831518797796 & 535.704880127584 & 565.958157468008 \tabularnewline
92 & 552.658046829374 & 530.667581587187 & 574.648512071562 \tabularnewline
93 & 554.882651899764 & 526.31249226132 & 583.452811538207 \tabularnewline
94 & 549.190992721756 & 514.421724165481 & 583.96026127803 \tabularnewline
95 & 538.274955498514 & 497.633118837529 & 578.9167921595 \tabularnewline
96 & 531.967718547043 & 485.125805550542 & 578.809631543544 \tabularnewline
97 & 521.376289153361 & 468.668977268996 & 574.083601037726 \tabularnewline
98 & 524.968025583507 & 464.896770212826 & 585.039280954188 \tabularnewline
99 & 580.451063453985 & 506.402523682629 & 654.49960322534 \tabularnewline
100 & 592.380356152948 & 508.815697400668 & 675.945014905228 \tabularnewline
101 & 585.255286759573 & 494.570513253785 & 675.940060265361 \tabularnewline
102 & 572.23232009109 & 473.816801599748 & 670.647838582431 \tabularnewline
\hline
\end{tabular}
%Source: https://freestatistics.org/blog/index.php?pk=63714&T=3

[TABLE]
[ROW][C]Extrapolation Forecasts of Exponential Smoothing[/C][/ROW]
[ROW][C]t[/C][C]Forecast[/C][C]95% Lower Bound[/C][C]95% Upper Bound[/C][/ROW]
[ROW][C]91[/C][C]550.831518797796[/C][C]535.704880127584[/C][C]565.958157468008[/C][/ROW]
[ROW][C]92[/C][C]552.658046829374[/C][C]530.667581587187[/C][C]574.648512071562[/C][/ROW]
[ROW][C]93[/C][C]554.882651899764[/C][C]526.31249226132[/C][C]583.452811538207[/C][/ROW]
[ROW][C]94[/C][C]549.190992721756[/C][C]514.421724165481[/C][C]583.96026127803[/C][/ROW]
[ROW][C]95[/C][C]538.274955498514[/C][C]497.633118837529[/C][C]578.9167921595[/C][/ROW]
[ROW][C]96[/C][C]531.967718547043[/C][C]485.125805550542[/C][C]578.809631543544[/C][/ROW]
[ROW][C]97[/C][C]521.376289153361[/C][C]468.668977268996[/C][C]574.083601037726[/C][/ROW]
[ROW][C]98[/C][C]524.968025583507[/C][C]464.896770212826[/C][C]585.039280954188[/C][/ROW]
[ROW][C]99[/C][C]580.451063453985[/C][C]506.402523682629[/C][C]654.49960322534[/C][/ROW]
[ROW][C]100[/C][C]592.380356152948[/C][C]508.815697400668[/C][C]675.945014905228[/C][/ROW]
[ROW][C]101[/C][C]585.255286759573[/C][C]494.570513253785[/C][C]675.940060265361[/C][/ROW]
[ROW][C]102[/C][C]572.23232009109[/C][C]473.816801599748[/C][C]670.647838582431[/C][/ROW]
[/TABLE]
Source: https://freestatistics.org/blog/index.php?pk=63714&T=3

Globally Unique Identifier (entire table): ba.freestatistics.org/blog/index.php?pk=63714&T=3

As an alternative you can also use a QR Code:  

The GUIDs for individual cells are displayed in the table below:

Extrapolation Forecasts of Exponential Smoothing
tForecast95% Lower Bound95% Upper Bound
91550.831518797796535.704880127584565.958157468008
92552.658046829374530.667581587187574.648512071562
93554.882651899764526.31249226132583.452811538207
94549.190992721756514.421724165481583.96026127803
95538.274955498514497.633118837529578.9167921595
96531.967718547043485.125805550542578.809631543544
97521.376289153361468.668977268996574.083601037726
98524.968025583507464.896770212826585.039280954188
99580.451063453985506.402523682629654.49960322534
100592.380356152948508.815697400668675.945014905228
101585.255286759573494.570513253785675.940060265361
102572.23232009109473.816801599748670.647838582431


Parameters (Session):
par1 = multiplicative ; par2 = 12 ;
Parameters (R input):
par1 = 12 ; par2 = Triple ; par3 = multiplicative ;
R code (references can be found in the software module):
par1 <- as.numeric(par1)
if (par2 == 'Single') K <- 1
if (par2 == 'Double') K <- 2
if (par2 == 'Triple') K <- par1
nx <- length(x)
nxmK <- nx - K
x <- ts(x, frequency = par1)
if (par2 == 'Single') fit <- HoltWinters(x, gamma=0, beta=0)
if (par2 == 'Double') fit <- HoltWinters(x, gamma=0)
if (par2 == 'Triple') fit <- HoltWinters(x, seasonal=par3)
fit
myresid <- x - fit$fitted[,'xhat']
bitmap(file='test1.png')
op <- par(mfrow=c(2,1))
plot(fit,ylab='Observed (black) / Fitted (red)',main='Interpolation Fit of Exponential Smoothing')
plot(myresid,ylab='Residuals',main='Interpolation Prediction Errors')
par(op)
dev.off()
bitmap(file='test2.png')
p <- predict(fit, par1, prediction.interval=TRUE)
np <- length(p[,1])
plot(fit,p,ylab='Observed (black) / Fitted (red)',main='Extrapolation Fit of Exponential Smoothing')
dev.off()
bitmap(file='test3.png')
op <- par(mfrow = c(2,2))
acf(as.numeric(myresid),lag.max = nx/2,main='Residual ACF')
spectrum(myresid,main='Residals Periodogram')
cpgram(myresid,main='Residal Cumulative Periodogram')
qqnorm(myresid,main='Residual Normal QQ Plot')
qqline(myresid)
par(op)
dev.off()
load(file='createtable')
a<-table.start()
a<-table.row.start(a)
a<-table.element(a,'Estimated Parameters of Exponential Smoothing',2,TRUE)
a<-table.row.end(a)
a<-table.row.start(a)
a<-table.element(a,'Parameter',header=TRUE)
a<-table.element(a,'Value',header=TRUE)
a<-table.row.end(a)
a<-table.row.start(a)
a<-table.element(a,'alpha',header=TRUE)
a<-table.element(a,fit$alpha)
a<-table.row.end(a)
a<-table.row.start(a)
a<-table.element(a,'beta',header=TRUE)
a<-table.element(a,fit$beta)
a<-table.row.end(a)
a<-table.row.start(a)
a<-table.element(a,'gamma',header=TRUE)
a<-table.element(a,fit$gamma)
a<-table.row.end(a)
a<-table.end(a)
table.save(a,file='mytable.tab')
a<-table.start()
a<-table.row.start(a)
a<-table.element(a,'Interpolation Forecasts of Exponential Smoothing',4,TRUE)
a<-table.row.end(a)
a<-table.row.start(a)
a<-table.element(a,'t',header=TRUE)
a<-table.element(a,'Observed',header=TRUE)
a<-table.element(a,'Fitted',header=TRUE)
a<-table.element(a,'Residuals',header=TRUE)
a<-table.row.end(a)
for (i in 1:nxmK) {
a<-table.row.start(a)
a<-table.element(a,i+K,header=TRUE)
a<-table.element(a,x[i+K])
a<-table.element(a,fit$fitted[i,'xhat'])
a<-table.element(a,myresid[i])
a<-table.row.end(a)
}
a<-table.end(a)
table.save(a,file='mytable1.tab')
a<-table.start()
a<-table.row.start(a)
a<-table.element(a,'Extrapolation Forecasts of Exponential Smoothing',4,TRUE)
a<-table.row.end(a)
a<-table.row.start(a)
a<-table.element(a,'t',header=TRUE)
a<-table.element(a,'Forecast',header=TRUE)
a<-table.element(a,'95% Lower Bound',header=TRUE)
a<-table.element(a,'95% Upper Bound',header=TRUE)
a<-table.row.end(a)
for (i in 1:np) {
a<-table.row.start(a)
a<-table.element(a,nx+i,header=TRUE)
a<-table.element(a,p[i,'fit'])
a<-table.element(a,p[i,'lwr'])
a<-table.element(a,p[i,'upr'])
a<-table.row.end(a)
}
a<-table.end(a)
table.save(a,file='mytable2.tab')