Free Statistics

of Irreproducible Research!

Author's title

Author*The author of this computation has been verified*
R Software Modulerwasp_exponentialsmoothing.wasp
Title produced by softwareExponential Smoothing
Date of computationFri, 04 Dec 2009 08:09:47 -0700
Cite this page as followsStatistical Computations at FreeStatistics.org, Office for Research Development and Education, URL https://freestatistics.org/blog/index.php?v=date/2009/Dec/04/t12599394240f0p21jqg33kgi4.htm/, Retrieved Sat, 27 Apr 2024 15:59:24 +0000
Statistical Computations at FreeStatistics.org, Office for Research Development and Education, URL https://freestatistics.org/blog/index.php?pk=63722, Retrieved Sat, 27 Apr 2024 15:59:24 +0000
QR Codes:

Original text written by user:
IsPrivate?No (this computation is public)
User-defined keywords
Estimated Impact95
Family? (F = Feedback message, R = changed R code, M = changed R Module, P = changed Parameters, D = changed Data)
-     [Univariate Data Series] [data set] [2008-12-01 19:54:57] [b98453cac15ba1066b407e146608df68]
- RMP   [Exponential Smoothing] [] [2009-11-27 15:04:36] [b98453cac15ba1066b407e146608df68]
-    D      [Exponential Smoothing] [Shw9] [2009-12-04 15:09:47] [7a39e26d7a09dd77604df90cb29f8d39] [Current]
-             [Exponential Smoothing] [Workshop 9] [2009-12-04 19:00:53] [1433a524809eda02c3198b3ae6eebb69]
-    D          [Exponential Smoothing] [verbetering workshop] [2009-12-06 13:43:35] [1433a524809eda02c3198b3ae6eebb69]
Feedback Forum

Post a new message
Dataseries X:
0.7461
0.7775
0.7790
0.7744
0.7905
0.7719
0.7811
0.7557
0.7637
0.7595
0.7471
0.7615
0.7487
0.7389
0.7337
0.7510
0.7382
0.7159
0.7542
0.7636
0.7433
0.7658
0.7627
0.7480
0.7692
0.7850
0.7913
0.7720
0.7880
0.8070
0.8268
0.8244
0.8487
0.8572
0.8214
0.8827
0.9216
0.8865
0.8816
0.8884
0.9466
0.9180
0.9337
0.9559
0.9626
0.9434
0.8639
0.7996
0.6680
0.6572
0.6928
0.6438
0.6454
0.6873
0.7265
0.7912
0.8114
0.8281
0.8393


Summary of computational transaction
Raw Inputview raw input (R code)
Raw Outputview raw output of R engine
Computing time1 seconds
R Server'Gwilym Jenkins' @ 72.249.127.135

\begin{tabular}{lllllllll}
\hline
Summary of computational transaction \tabularnewline
Raw Input & view raw input (R code)  \tabularnewline
Raw Output & view raw output of R engine  \tabularnewline
Computing time & 1 seconds \tabularnewline
R Server & 'Gwilym Jenkins' @ 72.249.127.135 \tabularnewline
\hline
\end{tabular}
%Source: https://freestatistics.org/blog/index.php?pk=63722&T=0

[TABLE]
[ROW][C]Summary of computational transaction[/C][/ROW]
[ROW][C]Raw Input[/C][C]view raw input (R code) [/C][/ROW]
[ROW][C]Raw Output[/C][C]view raw output of R engine [/C][/ROW]
[ROW][C]Computing time[/C][C]1 seconds[/C][/ROW]
[ROW][C]R Server[/C][C]'Gwilym Jenkins' @ 72.249.127.135[/C][/ROW]
[/TABLE]
Source: https://freestatistics.org/blog/index.php?pk=63722&T=0

Globally Unique Identifier (entire table): ba.freestatistics.org/blog/index.php?pk=63722&T=0

As an alternative you can also use a QR Code:  

The GUIDs for individual cells are displayed in the table below:

Summary of computational transaction
Raw Inputview raw input (R code)
Raw Outputview raw output of R engine
Computing time1 seconds
R Server'Gwilym Jenkins' @ 72.249.127.135


Estimated Parameters of Exponential Smoothing
ParameterValue
alpha1
beta0
gamma0.112416719167165

\begin{tabular}{lllllllll}
\hline
Estimated Parameters of Exponential Smoothing \tabularnewline
Parameter & Value \tabularnewline
alpha & 1 \tabularnewline
beta & 0 \tabularnewline
gamma & 0.112416719167165 \tabularnewline
\hline
\end{tabular}
%Source: https://freestatistics.org/blog/index.php?pk=63722&T=1

[TABLE]
[ROW][C]Estimated Parameters of Exponential Smoothing[/C][/ROW]
[ROW][C]Parameter[/C][C]Value[/C][/ROW]
[ROW][C]alpha[/C][C]1[/C][/ROW]
[ROW][C]beta[/C][C]0[/C][/ROW]
[ROW][C]gamma[/C][C]0.112416719167165[/C][/ROW]
[/TABLE]
Source: https://freestatistics.org/blog/index.php?pk=63722&T=1

Globally Unique Identifier (entire table): ba.freestatistics.org/blog/index.php?pk=63722&T=1

As an alternative you can also use a QR Code:  

The GUIDs for individual cells are displayed in the table below:

Estimated Parameters of Exponential Smoothing
ParameterValue
alpha1
beta0
gamma0.112416719167165


Interpolation Forecasts of Exponential Smoothing
tObservedFittedResiduals
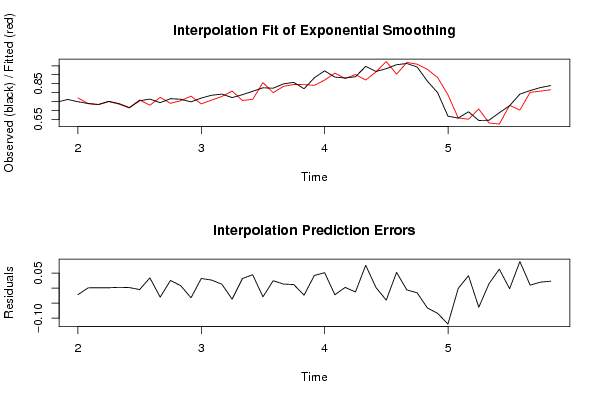
130.74870.77021543621658-0.0215154362165800
140.73890.7376384867820250.00126151321797496
150.73370.7321805336004370.00151946639956313
160.7510.7495105449245390.00148945507546094
170.73820.7352563310732750.00294366892672526
180.71590.7138356470631860.00206435293681373
190.75420.758762077687273-0.00456207768727257
200.76360.72906321634990.0345367836501003
210.74330.77315026377842-0.0298502637784199
220.76580.7399299944207290.0258700055792712
230.76270.7543956022652670.0083043977347328
240.7480.779971607373924-0.0319716073739239
250.76920.736752117344470.0324478826555293
260.7850.7578915771845040.0271084228154962
270.79130.77798801524530.0133119847546993
280.7720.808515098750218-0.0365150987502176
290.7880.7558732089384750.0321267910615254
300.8070.7621256051489920.0448743948510082
310.82680.855584241788373-0.0287842417883730
320.82440.7994399464242090.0249600535757915
330.84870.8348756260784320.0138243739215682
340.85720.8451453596163430.0120546403836573
350.82140.844678255714324-0.0232782557143235
360.88270.8401620902385250.0425379097614749
370.92160.8697991480603490.0518008519396509
380.88650.908456015103419-0.0219560151034186
390.88160.8788439672399570.00275603276004266
400.88840.90101702948735-0.0126170294873493
410.94660.8701496176770110.076450382322989
420.9180.915916515839930.00208348416006976
430.93370.973556362701898-0.0398563627018984
440.95590.9030662886410630.0528337113589374
450.96260.9683770264477-0.00577702644770073
460.94340.958845834908377-0.0154458349083770
470.86390.929824478113762-0.0659244781137619
480.79960.883741230302334-0.0841412303023337
490.6680.787718908620932-0.119718908620932
500.65720.657910467490316-0.000710467490316335
510.69280.6509989446549840.0418010553450159
520.64380.707613214169847-0.0638132141698472
530.64540.6300120783518730.0153879216481265
540.68730.6238495404293960.0634504595706037
550.72650.728365657343788-0.00186565734378763
560.79120.7022114887595640.0889885112404356
570.81140.8011703295593460.0102296704406537
580.82810.8079107000167560.0201892999832435
590.83930.8159339973404990.0233660026595008

\begin{tabular}{lllllllll}
\hline
Interpolation Forecasts of Exponential Smoothing \tabularnewline
t & Observed & Fitted & Residuals \tabularnewline
13 & 0.7487 & 0.77021543621658 & -0.0215154362165800 \tabularnewline
14 & 0.7389 & 0.737638486782025 & 0.00126151321797496 \tabularnewline
15 & 0.7337 & 0.732180533600437 & 0.00151946639956313 \tabularnewline
16 & 0.751 & 0.749510544924539 & 0.00148945507546094 \tabularnewline
17 & 0.7382 & 0.735256331073275 & 0.00294366892672526 \tabularnewline
18 & 0.7159 & 0.713835647063186 & 0.00206435293681373 \tabularnewline
19 & 0.7542 & 0.758762077687273 & -0.00456207768727257 \tabularnewline
20 & 0.7636 & 0.7290632163499 & 0.0345367836501003 \tabularnewline
21 & 0.7433 & 0.77315026377842 & -0.0298502637784199 \tabularnewline
22 & 0.7658 & 0.739929994420729 & 0.0258700055792712 \tabularnewline
23 & 0.7627 & 0.754395602265267 & 0.0083043977347328 \tabularnewline
24 & 0.748 & 0.779971607373924 & -0.0319716073739239 \tabularnewline
25 & 0.7692 & 0.73675211734447 & 0.0324478826555293 \tabularnewline
26 & 0.785 & 0.757891577184504 & 0.0271084228154962 \tabularnewline
27 & 0.7913 & 0.7779880152453 & 0.0133119847546993 \tabularnewline
28 & 0.772 & 0.808515098750218 & -0.0365150987502176 \tabularnewline
29 & 0.788 & 0.755873208938475 & 0.0321267910615254 \tabularnewline
30 & 0.807 & 0.762125605148992 & 0.0448743948510082 \tabularnewline
31 & 0.8268 & 0.855584241788373 & -0.0287842417883730 \tabularnewline
32 & 0.8244 & 0.799439946424209 & 0.0249600535757915 \tabularnewline
33 & 0.8487 & 0.834875626078432 & 0.0138243739215682 \tabularnewline
34 & 0.8572 & 0.845145359616343 & 0.0120546403836573 \tabularnewline
35 & 0.8214 & 0.844678255714324 & -0.0232782557143235 \tabularnewline
36 & 0.8827 & 0.840162090238525 & 0.0425379097614749 \tabularnewline
37 & 0.9216 & 0.869799148060349 & 0.0518008519396509 \tabularnewline
38 & 0.8865 & 0.908456015103419 & -0.0219560151034186 \tabularnewline
39 & 0.8816 & 0.878843967239957 & 0.00275603276004266 \tabularnewline
40 & 0.8884 & 0.90101702948735 & -0.0126170294873493 \tabularnewline
41 & 0.9466 & 0.870149617677011 & 0.076450382322989 \tabularnewline
42 & 0.918 & 0.91591651583993 & 0.00208348416006976 \tabularnewline
43 & 0.9337 & 0.973556362701898 & -0.0398563627018984 \tabularnewline
44 & 0.9559 & 0.903066288641063 & 0.0528337113589374 \tabularnewline
45 & 0.9626 & 0.9683770264477 & -0.00577702644770073 \tabularnewline
46 & 0.9434 & 0.958845834908377 & -0.0154458349083770 \tabularnewline
47 & 0.8639 & 0.929824478113762 & -0.0659244781137619 \tabularnewline
48 & 0.7996 & 0.883741230302334 & -0.0841412303023337 \tabularnewline
49 & 0.668 & 0.787718908620932 & -0.119718908620932 \tabularnewline
50 & 0.6572 & 0.657910467490316 & -0.000710467490316335 \tabularnewline
51 & 0.6928 & 0.650998944654984 & 0.0418010553450159 \tabularnewline
52 & 0.6438 & 0.707613214169847 & -0.0638132141698472 \tabularnewline
53 & 0.6454 & 0.630012078351873 & 0.0153879216481265 \tabularnewline
54 & 0.6873 & 0.623849540429396 & 0.0634504595706037 \tabularnewline
55 & 0.7265 & 0.728365657343788 & -0.00186565734378763 \tabularnewline
56 & 0.7912 & 0.702211488759564 & 0.0889885112404356 \tabularnewline
57 & 0.8114 & 0.801170329559346 & 0.0102296704406537 \tabularnewline
58 & 0.8281 & 0.807910700016756 & 0.0201892999832435 \tabularnewline
59 & 0.8393 & 0.815933997340499 & 0.0233660026595008 \tabularnewline
\hline
\end{tabular}
%Source: https://freestatistics.org/blog/index.php?pk=63722&T=2

[TABLE]
[ROW][C]Interpolation Forecasts of Exponential Smoothing[/C][/ROW]
[ROW][C]t[/C][C]Observed[/C][C]Fitted[/C][C]Residuals[/C][/ROW]
[ROW][C]13[/C][C]0.7487[/C][C]0.77021543621658[/C][C]-0.0215154362165800[/C][/ROW]
[ROW][C]14[/C][C]0.7389[/C][C]0.737638486782025[/C][C]0.00126151321797496[/C][/ROW]
[ROW][C]15[/C][C]0.7337[/C][C]0.732180533600437[/C][C]0.00151946639956313[/C][/ROW]
[ROW][C]16[/C][C]0.751[/C][C]0.749510544924539[/C][C]0.00148945507546094[/C][/ROW]
[ROW][C]17[/C][C]0.7382[/C][C]0.735256331073275[/C][C]0.00294366892672526[/C][/ROW]
[ROW][C]18[/C][C]0.7159[/C][C]0.713835647063186[/C][C]0.00206435293681373[/C][/ROW]
[ROW][C]19[/C][C]0.7542[/C][C]0.758762077687273[/C][C]-0.00456207768727257[/C][/ROW]
[ROW][C]20[/C][C]0.7636[/C][C]0.7290632163499[/C][C]0.0345367836501003[/C][/ROW]
[ROW][C]21[/C][C]0.7433[/C][C]0.77315026377842[/C][C]-0.0298502637784199[/C][/ROW]
[ROW][C]22[/C][C]0.7658[/C][C]0.739929994420729[/C][C]0.0258700055792712[/C][/ROW]
[ROW][C]23[/C][C]0.7627[/C][C]0.754395602265267[/C][C]0.0083043977347328[/C][/ROW]
[ROW][C]24[/C][C]0.748[/C][C]0.779971607373924[/C][C]-0.0319716073739239[/C][/ROW]
[ROW][C]25[/C][C]0.7692[/C][C]0.73675211734447[/C][C]0.0324478826555293[/C][/ROW]
[ROW][C]26[/C][C]0.785[/C][C]0.757891577184504[/C][C]0.0271084228154962[/C][/ROW]
[ROW][C]27[/C][C]0.7913[/C][C]0.7779880152453[/C][C]0.0133119847546993[/C][/ROW]
[ROW][C]28[/C][C]0.772[/C][C]0.808515098750218[/C][C]-0.0365150987502176[/C][/ROW]
[ROW][C]29[/C][C]0.788[/C][C]0.755873208938475[/C][C]0.0321267910615254[/C][/ROW]
[ROW][C]30[/C][C]0.807[/C][C]0.762125605148992[/C][C]0.0448743948510082[/C][/ROW]
[ROW][C]31[/C][C]0.8268[/C][C]0.855584241788373[/C][C]-0.0287842417883730[/C][/ROW]
[ROW][C]32[/C][C]0.8244[/C][C]0.799439946424209[/C][C]0.0249600535757915[/C][/ROW]
[ROW][C]33[/C][C]0.8487[/C][C]0.834875626078432[/C][C]0.0138243739215682[/C][/ROW]
[ROW][C]34[/C][C]0.8572[/C][C]0.845145359616343[/C][C]0.0120546403836573[/C][/ROW]
[ROW][C]35[/C][C]0.8214[/C][C]0.844678255714324[/C][C]-0.0232782557143235[/C][/ROW]
[ROW][C]36[/C][C]0.8827[/C][C]0.840162090238525[/C][C]0.0425379097614749[/C][/ROW]
[ROW][C]37[/C][C]0.9216[/C][C]0.869799148060349[/C][C]0.0518008519396509[/C][/ROW]
[ROW][C]38[/C][C]0.8865[/C][C]0.908456015103419[/C][C]-0.0219560151034186[/C][/ROW]
[ROW][C]39[/C][C]0.8816[/C][C]0.878843967239957[/C][C]0.00275603276004266[/C][/ROW]
[ROW][C]40[/C][C]0.8884[/C][C]0.90101702948735[/C][C]-0.0126170294873493[/C][/ROW]
[ROW][C]41[/C][C]0.9466[/C][C]0.870149617677011[/C][C]0.076450382322989[/C][/ROW]
[ROW][C]42[/C][C]0.918[/C][C]0.91591651583993[/C][C]0.00208348416006976[/C][/ROW]
[ROW][C]43[/C][C]0.9337[/C][C]0.973556362701898[/C][C]-0.0398563627018984[/C][/ROW]
[ROW][C]44[/C][C]0.9559[/C][C]0.903066288641063[/C][C]0.0528337113589374[/C][/ROW]
[ROW][C]45[/C][C]0.9626[/C][C]0.9683770264477[/C][C]-0.00577702644770073[/C][/ROW]
[ROW][C]46[/C][C]0.9434[/C][C]0.958845834908377[/C][C]-0.0154458349083770[/C][/ROW]
[ROW][C]47[/C][C]0.8639[/C][C]0.929824478113762[/C][C]-0.0659244781137619[/C][/ROW]
[ROW][C]48[/C][C]0.7996[/C][C]0.883741230302334[/C][C]-0.0841412303023337[/C][/ROW]
[ROW][C]49[/C][C]0.668[/C][C]0.787718908620932[/C][C]-0.119718908620932[/C][/ROW]
[ROW][C]50[/C][C]0.6572[/C][C]0.657910467490316[/C][C]-0.000710467490316335[/C][/ROW]
[ROW][C]51[/C][C]0.6928[/C][C]0.650998944654984[/C][C]0.0418010553450159[/C][/ROW]
[ROW][C]52[/C][C]0.6438[/C][C]0.707613214169847[/C][C]-0.0638132141698472[/C][/ROW]
[ROW][C]53[/C][C]0.6454[/C][C]0.630012078351873[/C][C]0.0153879216481265[/C][/ROW]
[ROW][C]54[/C][C]0.6873[/C][C]0.623849540429396[/C][C]0.0634504595706037[/C][/ROW]
[ROW][C]55[/C][C]0.7265[/C][C]0.728365657343788[/C][C]-0.00186565734378763[/C][/ROW]
[ROW][C]56[/C][C]0.7912[/C][C]0.702211488759564[/C][C]0.0889885112404356[/C][/ROW]
[ROW][C]57[/C][C]0.8114[/C][C]0.801170329559346[/C][C]0.0102296704406537[/C][/ROW]
[ROW][C]58[/C][C]0.8281[/C][C]0.807910700016756[/C][C]0.0201892999832435[/C][/ROW]
[ROW][C]59[/C][C]0.8393[/C][C]0.815933997340499[/C][C]0.0233660026595008[/C][/ROW]
[/TABLE]
Source: https://freestatistics.org/blog/index.php?pk=63722&T=2

Globally Unique Identifier (entire table): ba.freestatistics.org/blog/index.php?pk=63722&T=2

As an alternative you can also use a QR Code:  

The GUIDs for individual cells are displayed in the table below:

Interpolation Forecasts of Exponential Smoothing
tObservedFittedResiduals
130.74870.77021543621658-0.0215154362165800
140.73890.7376384867820250.00126151321797496
150.73370.7321805336004370.00151946639956313
160.7510.7495105449245390.00148945507546094
170.73820.7352563310732750.00294366892672526
180.71590.7138356470631860.00206435293681373
190.75420.758762077687273-0.00456207768727257
200.76360.72906321634990.0345367836501003
210.74330.77315026377842-0.0298502637784199
220.76580.7399299944207290.0258700055792712
230.76270.7543956022652670.0083043977347328
240.7480.779971607373924-0.0319716073739239
250.76920.736752117344470.0324478826555293
260.7850.7578915771845040.0271084228154962
270.79130.77798801524530.0133119847546993
280.7720.808515098750218-0.0365150987502176
290.7880.7558732089384750.0321267910615254
300.8070.7621256051489920.0448743948510082
310.82680.855584241788373-0.0287842417883730
320.82440.7994399464242090.0249600535757915
330.84870.8348756260784320.0138243739215682
340.85720.8451453596163430.0120546403836573
350.82140.844678255714324-0.0232782557143235
360.88270.8401620902385250.0425379097614749
370.92160.8697991480603490.0518008519396509
380.88650.908456015103419-0.0219560151034186
390.88160.8788439672399570.00275603276004266
400.88840.90101702948735-0.0126170294873493
410.94660.8701496176770110.076450382322989
420.9180.915916515839930.00208348416006976
430.93370.973556362701898-0.0398563627018984
440.95590.9030662886410630.0528337113589374
450.96260.9683770264477-0.00577702644770073
460.94340.958845834908377-0.0154458349083770
470.86390.929824478113762-0.0659244781137619
480.79960.883741230302334-0.0841412303023337
490.6680.787718908620932-0.119718908620932
500.65720.657910467490316-0.000710467490316335
510.69280.6509989446549840.0418010553450159
520.64380.707613214169847-0.0638132141698472
530.64540.6300120783518730.0153879216481265
540.68730.6238495404293960.0634504595706037
550.72650.728365657343788-0.00186565734378763
560.79120.7022114887595640.0889885112404356
570.81140.8011703295593460.0102296704406537
580.82810.8079107000167560.0201892999832435
590.83930.8159339973404990.0233660026595008


Extrapolation Forecasts of Exponential Smoothing
tForecast95% Lower Bound95% Upper Bound
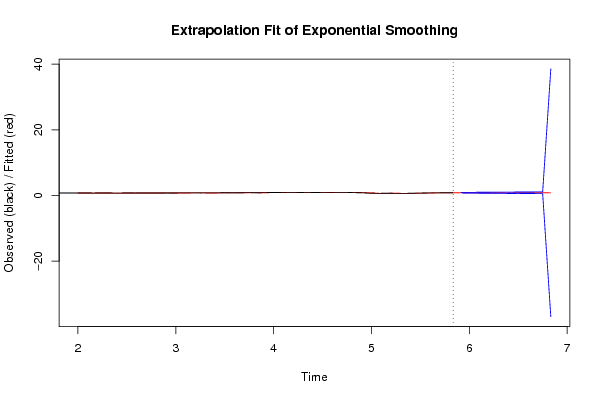
600.858516598641870.7804783526289730.936554844654767
610.8459125129949480.7362248343567180.955600191633178
620.8336801362424550.7001388352261850.967221437258725
630.8263592613927140.6724188511508650.980299671634562
640.8444292667351990.6684820452940641.02037648817633
650.8269810825644540.6374339184137441.01652824671517
660.7999246983854740.6002442179803150.999605178790633
670.8480645270355030.6219484489377961.07418060513321
680.8200532780954960.5873841448717591.05272241131923
690.8304627480459820.581695234027331.07923026206464
700.8269400548297550.566635198373551.08724491128596
710.814788232265826-36.904392729852338.5339691943839

\begin{tabular}{lllllllll}
\hline
Extrapolation Forecasts of Exponential Smoothing \tabularnewline
t & Forecast & 95% Lower Bound & 95% Upper Bound \tabularnewline
60 & 0.85851659864187 & 0.780478352628973 & 0.936554844654767 \tabularnewline
61 & 0.845912512994948 & 0.736224834356718 & 0.955600191633178 \tabularnewline
62 & 0.833680136242455 & 0.700138835226185 & 0.967221437258725 \tabularnewline
63 & 0.826359261392714 & 0.672418851150865 & 0.980299671634562 \tabularnewline
64 & 0.844429266735199 & 0.668482045294064 & 1.02037648817633 \tabularnewline
65 & 0.826981082564454 & 0.637433918413744 & 1.01652824671517 \tabularnewline
66 & 0.799924698385474 & 0.600244217980315 & 0.999605178790633 \tabularnewline
67 & 0.848064527035503 & 0.621948448937796 & 1.07418060513321 \tabularnewline
68 & 0.820053278095496 & 0.587384144871759 & 1.05272241131923 \tabularnewline
69 & 0.830462748045982 & 0.58169523402733 & 1.07923026206464 \tabularnewline
70 & 0.826940054829755 & 0.56663519837355 & 1.08724491128596 \tabularnewline
71 & 0.814788232265826 & -36.9043927298523 & 38.5339691943839 \tabularnewline
\hline
\end{tabular}
%Source: https://freestatistics.org/blog/index.php?pk=63722&T=3

[TABLE]
[ROW][C]Extrapolation Forecasts of Exponential Smoothing[/C][/ROW]
[ROW][C]t[/C][C]Forecast[/C][C]95% Lower Bound[/C][C]95% Upper Bound[/C][/ROW]
[ROW][C]60[/C][C]0.85851659864187[/C][C]0.780478352628973[/C][C]0.936554844654767[/C][/ROW]
[ROW][C]61[/C][C]0.845912512994948[/C][C]0.736224834356718[/C][C]0.955600191633178[/C][/ROW]
[ROW][C]62[/C][C]0.833680136242455[/C][C]0.700138835226185[/C][C]0.967221437258725[/C][/ROW]
[ROW][C]63[/C][C]0.826359261392714[/C][C]0.672418851150865[/C][C]0.980299671634562[/C][/ROW]
[ROW][C]64[/C][C]0.844429266735199[/C][C]0.668482045294064[/C][C]1.02037648817633[/C][/ROW]
[ROW][C]65[/C][C]0.826981082564454[/C][C]0.637433918413744[/C][C]1.01652824671517[/C][/ROW]
[ROW][C]66[/C][C]0.799924698385474[/C][C]0.600244217980315[/C][C]0.999605178790633[/C][/ROW]
[ROW][C]67[/C][C]0.848064527035503[/C][C]0.621948448937796[/C][C]1.07418060513321[/C][/ROW]
[ROW][C]68[/C][C]0.820053278095496[/C][C]0.587384144871759[/C][C]1.05272241131923[/C][/ROW]
[ROW][C]69[/C][C]0.830462748045982[/C][C]0.58169523402733[/C][C]1.07923026206464[/C][/ROW]
[ROW][C]70[/C][C]0.826940054829755[/C][C]0.56663519837355[/C][C]1.08724491128596[/C][/ROW]
[ROW][C]71[/C][C]0.814788232265826[/C][C]-36.9043927298523[/C][C]38.5339691943839[/C][/ROW]
[/TABLE]
Source: https://freestatistics.org/blog/index.php?pk=63722&T=3

Globally Unique Identifier (entire table): ba.freestatistics.org/blog/index.php?pk=63722&T=3

As an alternative you can also use a QR Code:  

The GUIDs for individual cells are displayed in the table below:

Extrapolation Forecasts of Exponential Smoothing
tForecast95% Lower Bound95% Upper Bound
600.858516598641870.7804783526289730.936554844654767
610.8459125129949480.7362248343567180.955600191633178
620.8336801362424550.7001388352261850.967221437258725
630.8263592613927140.6724188511508650.980299671634562
640.8444292667351990.6684820452940641.02037648817633
650.8269810825644540.6374339184137441.01652824671517
660.7999246983854740.6002442179803150.999605178790633
670.8480645270355030.6219484489377961.07418060513321
680.8200532780954960.5873841448717591.05272241131923
690.8304627480459820.581695234027331.07923026206464
700.8269400548297550.566635198373551.08724491128596
710.814788232265826-36.904392729852338.5339691943839


Parameters (Session):
par1 = 12 ; par2 = Triple ; par3 = multiplicative ;
Parameters (R input):
par1 = 12 ; par2 = Triple ; par3 = multiplicative ;
R code (references can be found in the software module):
par1 <- as.numeric(par1)
if (par2 == 'Single') K <- 1
if (par2 == 'Double') K <- 2
if (par2 == 'Triple') K <- par1
nx <- length(x)
nxmK <- nx - K
x <- ts(x, frequency = par1)
if (par2 == 'Single') fit <- HoltWinters(x, gamma=0, beta=0)
if (par2 == 'Double') fit <- HoltWinters(x, gamma=0)
if (par2 == 'Triple') fit <- HoltWinters(x, seasonal=par3)
fit
myresid <- x - fit$fitted[,'xhat']
bitmap(file='test1.png')
op <- par(mfrow=c(2,1))
plot(fit,ylab='Observed (black) / Fitted (red)',main='Interpolation Fit of Exponential Smoothing')
plot(myresid,ylab='Residuals',main='Interpolation Prediction Errors')
par(op)
dev.off()
bitmap(file='test2.png')
p <- predict(fit, par1, prediction.interval=TRUE)
np <- length(p[,1])
plot(fit,p,ylab='Observed (black) / Fitted (red)',main='Extrapolation Fit of Exponential Smoothing')
dev.off()
bitmap(file='test3.png')
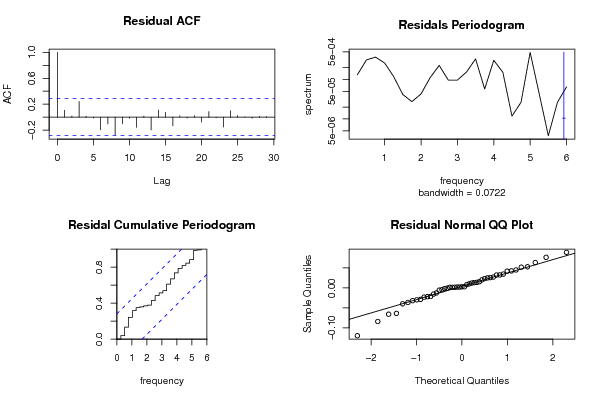
op <- par(mfrow = c(2,2))
acf(as.numeric(myresid),lag.max = nx/2,main='Residual ACF')
spectrum(myresid,main='Residals Periodogram')
cpgram(myresid,main='Residal Cumulative Periodogram')
qqnorm(myresid,main='Residual Normal QQ Plot')
qqline(myresid)
par(op)
dev.off()
load(file='createtable')
a<-table.start()
a<-table.row.start(a)
a<-table.element(a,'Estimated Parameters of Exponential Smoothing',2,TRUE)
a<-table.row.end(a)
a<-table.row.start(a)
a<-table.element(a,'Parameter',header=TRUE)
a<-table.element(a,'Value',header=TRUE)
a<-table.row.end(a)
a<-table.row.start(a)
a<-table.element(a,'alpha',header=TRUE)
a<-table.element(a,fit$alpha)
a<-table.row.end(a)
a<-table.row.start(a)
a<-table.element(a,'beta',header=TRUE)
a<-table.element(a,fit$beta)
a<-table.row.end(a)
a<-table.row.start(a)
a<-table.element(a,'gamma',header=TRUE)
a<-table.element(a,fit$gamma)
a<-table.row.end(a)
a<-table.end(a)
table.save(a,file='mytable.tab')
a<-table.start()
a<-table.row.start(a)
a<-table.element(a,'Interpolation Forecasts of Exponential Smoothing',4,TRUE)
a<-table.row.end(a)
a<-table.row.start(a)
a<-table.element(a,'t',header=TRUE)
a<-table.element(a,'Observed',header=TRUE)
a<-table.element(a,'Fitted',header=TRUE)
a<-table.element(a,'Residuals',header=TRUE)
a<-table.row.end(a)
for (i in 1:nxmK) {
a<-table.row.start(a)
a<-table.element(a,i+K,header=TRUE)
a<-table.element(a,x[i+K])
a<-table.element(a,fit$fitted[i,'xhat'])
a<-table.element(a,myresid[i])
a<-table.row.end(a)
}
a<-table.end(a)
table.save(a,file='mytable1.tab')
a<-table.start()
a<-table.row.start(a)
a<-table.element(a,'Extrapolation Forecasts of Exponential Smoothing',4,TRUE)
a<-table.row.end(a)
a<-table.row.start(a)
a<-table.element(a,'t',header=TRUE)
a<-table.element(a,'Forecast',header=TRUE)
a<-table.element(a,'95% Lower Bound',header=TRUE)
a<-table.element(a,'95% Upper Bound',header=TRUE)
a<-table.row.end(a)
for (i in 1:np) {
a<-table.row.start(a)
a<-table.element(a,nx+i,header=TRUE)
a<-table.element(a,p[i,'fit'])
a<-table.element(a,p[i,'lwr'])
a<-table.element(a,p[i,'upr'])
a<-table.row.end(a)
}
a<-table.end(a)
table.save(a,file='mytable2.tab')