Free Statistics

of Irreproducible Research!

Author's title

Author*The author of this computation has been verified*
R Software Modulerwasp_exponentialsmoothing.wasp
Title produced by softwareExponential Smoothing
Date of computationFri, 04 Dec 2009 08:18:06 -0700
Cite this page as followsStatistical Computations at FreeStatistics.org, Office for Research Development and Education, URL https://freestatistics.org/blog/index.php?v=date/2009/Dec/04/t125993996898mkwdhheo680dt.htm/, Retrieved Sun, 28 Apr 2024 13:31:29 +0000
Statistical Computations at FreeStatistics.org, Office for Research Development and Education, URL https://freestatistics.org/blog/index.php?pk=63743, Retrieved Sun, 28 Apr 2024 13:31:29 +0000
QR Codes:

Original text written by user:
IsPrivate?No (this computation is public)
User-defined keywordsKVN WS9
Estimated Impact93
Family? (F = Feedback message, R = changed R code, M = changed R Module, P = changed Parameters, D = changed Data)
-     [Univariate Data Series] [data set] [2008-12-01 19:54:57] [b98453cac15ba1066b407e146608df68]
- RMP   [Exponential Smoothing] [] [2009-11-27 15:04:36] [b98453cac15ba1066b407e146608df68]
-    D      [Exponential Smoothing] [WS9 Exponential S...] [2009-12-04 15:18:06] [f1100e00818182135823a11ccbd0f3b9] [Current]
Feedback Forum

Post a new message
Dataseries X:
9487
8700
9627
8947
9283
8829
9947
9628
9318
9605
8640
9214
9567
8547
9185
9470
9123
9278
10170
9434
9655
9429
8739
9552
9687
9019
9672
9206
9069
9788
10312
10105
9863
9656
9295
9946
9701
9049
10190
9706
9765
9893
9994
10433
10073
10112
9266
9820
10097
9115
10411
9678
10408
10153
10368
10581
10597
10680
9738
9556


Summary of computational transaction
Raw Inputview raw input (R code)
Raw Outputview raw output of R engine
Computing time3 seconds
R Server'Gwilym Jenkins' @ 72.249.127.135

\begin{tabular}{lllllllll}
\hline
Summary of computational transaction \tabularnewline
Raw Input & view raw input (R code)  \tabularnewline
Raw Output & view raw output of R engine  \tabularnewline
Computing time & 3 seconds \tabularnewline
R Server & 'Gwilym Jenkins' @ 72.249.127.135 \tabularnewline
\hline
\end{tabular}
%Source: https://freestatistics.org/blog/index.php?pk=63743&T=0

[TABLE]
[ROW][C]Summary of computational transaction[/C][/ROW]
[ROW][C]Raw Input[/C][C]view raw input (R code) [/C][/ROW]
[ROW][C]Raw Output[/C][C]view raw output of R engine [/C][/ROW]
[ROW][C]Computing time[/C][C]3 seconds[/C][/ROW]
[ROW][C]R Server[/C][C]'Gwilym Jenkins' @ 72.249.127.135[/C][/ROW]
[/TABLE]
Source: https://freestatistics.org/blog/index.php?pk=63743&T=0

Globally Unique Identifier (entire table): ba.freestatistics.org/blog/index.php?pk=63743&T=0

As an alternative you can also use a QR Code:  

The GUIDs for individual cells are displayed in the table below:

Summary of computational transaction
Raw Inputview raw input (R code)
Raw Outputview raw output of R engine
Computing time3 seconds
R Server'Gwilym Jenkins' @ 72.249.127.135


Estimated Parameters of Exponential Smoothing
ParameterValue
alpha0.009156096475084
beta0.812848002111988
gamma0.833462678892081

\begin{tabular}{lllllllll}
\hline
Estimated Parameters of Exponential Smoothing \tabularnewline
Parameter & Value \tabularnewline
alpha & 0.009156096475084 \tabularnewline
beta & 0.812848002111988 \tabularnewline
gamma & 0.833462678892081 \tabularnewline
\hline
\end{tabular}
%Source: https://freestatistics.org/blog/index.php?pk=63743&T=1

[TABLE]
[ROW][C]Estimated Parameters of Exponential Smoothing[/C][/ROW]
[ROW][C]Parameter[/C][C]Value[/C][/ROW]
[ROW][C]alpha[/C][C]0.009156096475084[/C][/ROW]
[ROW][C]beta[/C][C]0.812848002111988[/C][/ROW]
[ROW][C]gamma[/C][C]0.833462678892081[/C][/ROW]
[/TABLE]
Source: https://freestatistics.org/blog/index.php?pk=63743&T=1

Globally Unique Identifier (entire table): ba.freestatistics.org/blog/index.php?pk=63743&T=1

As an alternative you can also use a QR Code:  

The GUIDs for individual cells are displayed in the table below:

Estimated Parameters of Exponential Smoothing
ParameterValue
alpha0.009156096475084
beta0.812848002111988
gamma0.833462678892081


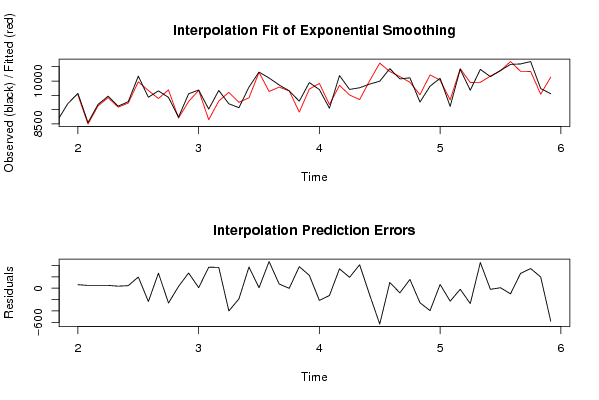
Interpolation Forecasts of Exponential Smoothing
tObservedFittedResiduals
1395679504.6211907573762.3788092426312
1485478497.5953941767149.4046058232889
1591859134.3715488208750.6284511791328
1694709419.9447724153150.0552275846912
1791239086.8466716476936.1533283523077
1892789232.437191849345.5628081506929
19101709972.17813280312197.821867196884
2094349668.37052643057-234.370526430568
2196559389.14053659324265.859463406765
2294299688.6802711065-259.680271106492
2387398707.3842379586331.6157620413705
2495529283.39278430658268.607215693422
2596879676.4203920387810.5796079612210
2690198648.95048781814370.049512181862
2796729304.463711084367.536288916001
2892069605.45821250016-399.458212500162
2990699257.01606983497-188.016069834974
3097889414.38648161398373.613518386021
311031210303.32888000748.67111999263761
32101059634.90329740947470.09670259053
3398639787.851506299775.1484937003006
3496569657.6997988451-1.69979884510758
3592958914.55273764873380.44726235127
3699469719.04753684196226.952463158043
3797019915.76260133212-214.762601332119
3890499176.32621688454-127.326216884545
39101909848.06241635255341.937583647452
4097069513.49652211917192.503477880829
4197659351.32399773923413.676002260770
42989310011.5769550406-118.576955040602
43999410624.780152-630.780151999999
441043310330.8472734194102.152726580614
451007310153.8417277231-80.8417277231401
46101129956.5284051429155.471594857101
4792669521.55817626532-255.558176265324
48982010214.0778465724-394.077846572382
491009710030.199961675766.8000383243361
5091159342.83461443313-227.83461443313
511041110429.0561821783-18.0561821782794
5296789948.12953723954-270.129537239542
53104089955.09156859064452.908431409363
541015310172.2841648514-19.2841648514459
551036810359.02471851598.97528148409765
561058110679.8494940193-98.8494940192577
571059710335.7061881076261.293811892412
581068010333.3314094461346.668590553863
5997389539.61480190356198.385198096435
60955610138.0385857807-582.038585780661

\begin{tabular}{lllllllll}
\hline
Interpolation Forecasts of Exponential Smoothing \tabularnewline
t & Observed & Fitted & Residuals \tabularnewline
13 & 9567 & 9504.62119075737 & 62.3788092426312 \tabularnewline
14 & 8547 & 8497.59539417671 & 49.4046058232889 \tabularnewline
15 & 9185 & 9134.37154882087 & 50.6284511791328 \tabularnewline
16 & 9470 & 9419.94477241531 & 50.0552275846912 \tabularnewline
17 & 9123 & 9086.84667164769 & 36.1533283523077 \tabularnewline
18 & 9278 & 9232.4371918493 & 45.5628081506929 \tabularnewline
19 & 10170 & 9972.17813280312 & 197.821867196884 \tabularnewline
20 & 9434 & 9668.37052643057 & -234.370526430568 \tabularnewline
21 & 9655 & 9389.14053659324 & 265.859463406765 \tabularnewline
22 & 9429 & 9688.6802711065 & -259.680271106492 \tabularnewline
23 & 8739 & 8707.38423795863 & 31.6157620413705 \tabularnewline
24 & 9552 & 9283.39278430658 & 268.607215693422 \tabularnewline
25 & 9687 & 9676.42039203878 & 10.5796079612210 \tabularnewline
26 & 9019 & 8648.95048781814 & 370.049512181862 \tabularnewline
27 & 9672 & 9304.463711084 & 367.536288916001 \tabularnewline
28 & 9206 & 9605.45821250016 & -399.458212500162 \tabularnewline
29 & 9069 & 9257.01606983497 & -188.016069834974 \tabularnewline
30 & 9788 & 9414.38648161398 & 373.613518386021 \tabularnewline
31 & 10312 & 10303.3288800074 & 8.67111999263761 \tabularnewline
32 & 10105 & 9634.90329740947 & 470.09670259053 \tabularnewline
33 & 9863 & 9787.8515062997 & 75.1484937003006 \tabularnewline
34 & 9656 & 9657.6997988451 & -1.69979884510758 \tabularnewline
35 & 9295 & 8914.55273764873 & 380.44726235127 \tabularnewline
36 & 9946 & 9719.04753684196 & 226.952463158043 \tabularnewline
37 & 9701 & 9915.76260133212 & -214.762601332119 \tabularnewline
38 & 9049 & 9176.32621688454 & -127.326216884545 \tabularnewline
39 & 10190 & 9848.06241635255 & 341.937583647452 \tabularnewline
40 & 9706 & 9513.49652211917 & 192.503477880829 \tabularnewline
41 & 9765 & 9351.32399773923 & 413.676002260770 \tabularnewline
42 & 9893 & 10011.5769550406 & -118.576955040602 \tabularnewline
43 & 9994 & 10624.780152 & -630.780151999999 \tabularnewline
44 & 10433 & 10330.8472734194 & 102.152726580614 \tabularnewline
45 & 10073 & 10153.8417277231 & -80.8417277231401 \tabularnewline
46 & 10112 & 9956.5284051429 & 155.471594857101 \tabularnewline
47 & 9266 & 9521.55817626532 & -255.558176265324 \tabularnewline
48 & 9820 & 10214.0778465724 & -394.077846572382 \tabularnewline
49 & 10097 & 10030.1999616757 & 66.8000383243361 \tabularnewline
50 & 9115 & 9342.83461443313 & -227.83461443313 \tabularnewline
51 & 10411 & 10429.0561821783 & -18.0561821782794 \tabularnewline
52 & 9678 & 9948.12953723954 & -270.129537239542 \tabularnewline
53 & 10408 & 9955.09156859064 & 452.908431409363 \tabularnewline
54 & 10153 & 10172.2841648514 & -19.2841648514459 \tabularnewline
55 & 10368 & 10359.0247185159 & 8.97528148409765 \tabularnewline
56 & 10581 & 10679.8494940193 & -98.8494940192577 \tabularnewline
57 & 10597 & 10335.7061881076 & 261.293811892412 \tabularnewline
58 & 10680 & 10333.3314094461 & 346.668590553863 \tabularnewline
59 & 9738 & 9539.61480190356 & 198.385198096435 \tabularnewline
60 & 9556 & 10138.0385857807 & -582.038585780661 \tabularnewline
\hline
\end{tabular}
%Source: https://freestatistics.org/blog/index.php?pk=63743&T=2

[TABLE]
[ROW][C]Interpolation Forecasts of Exponential Smoothing[/C][/ROW]
[ROW][C]t[/C][C]Observed[/C][C]Fitted[/C][C]Residuals[/C][/ROW]
[ROW][C]13[/C][C]9567[/C][C]9504.62119075737[/C][C]62.3788092426312[/C][/ROW]
[ROW][C]14[/C][C]8547[/C][C]8497.59539417671[/C][C]49.4046058232889[/C][/ROW]
[ROW][C]15[/C][C]9185[/C][C]9134.37154882087[/C][C]50.6284511791328[/C][/ROW]
[ROW][C]16[/C][C]9470[/C][C]9419.94477241531[/C][C]50.0552275846912[/C][/ROW]
[ROW][C]17[/C][C]9123[/C][C]9086.84667164769[/C][C]36.1533283523077[/C][/ROW]
[ROW][C]18[/C][C]9278[/C][C]9232.4371918493[/C][C]45.5628081506929[/C][/ROW]
[ROW][C]19[/C][C]10170[/C][C]9972.17813280312[/C][C]197.821867196884[/C][/ROW]
[ROW][C]20[/C][C]9434[/C][C]9668.37052643057[/C][C]-234.370526430568[/C][/ROW]
[ROW][C]21[/C][C]9655[/C][C]9389.14053659324[/C][C]265.859463406765[/C][/ROW]
[ROW][C]22[/C][C]9429[/C][C]9688.6802711065[/C][C]-259.680271106492[/C][/ROW]
[ROW][C]23[/C][C]8739[/C][C]8707.38423795863[/C][C]31.6157620413705[/C][/ROW]
[ROW][C]24[/C][C]9552[/C][C]9283.39278430658[/C][C]268.607215693422[/C][/ROW]
[ROW][C]25[/C][C]9687[/C][C]9676.42039203878[/C][C]10.5796079612210[/C][/ROW]
[ROW][C]26[/C][C]9019[/C][C]8648.95048781814[/C][C]370.049512181862[/C][/ROW]
[ROW][C]27[/C][C]9672[/C][C]9304.463711084[/C][C]367.536288916001[/C][/ROW]
[ROW][C]28[/C][C]9206[/C][C]9605.45821250016[/C][C]-399.458212500162[/C][/ROW]
[ROW][C]29[/C][C]9069[/C][C]9257.01606983497[/C][C]-188.016069834974[/C][/ROW]
[ROW][C]30[/C][C]9788[/C][C]9414.38648161398[/C][C]373.613518386021[/C][/ROW]
[ROW][C]31[/C][C]10312[/C][C]10303.3288800074[/C][C]8.67111999263761[/C][/ROW]
[ROW][C]32[/C][C]10105[/C][C]9634.90329740947[/C][C]470.09670259053[/C][/ROW]
[ROW][C]33[/C][C]9863[/C][C]9787.8515062997[/C][C]75.1484937003006[/C][/ROW]
[ROW][C]34[/C][C]9656[/C][C]9657.6997988451[/C][C]-1.69979884510758[/C][/ROW]
[ROW][C]35[/C][C]9295[/C][C]8914.55273764873[/C][C]380.44726235127[/C][/ROW]
[ROW][C]36[/C][C]9946[/C][C]9719.04753684196[/C][C]226.952463158043[/C][/ROW]
[ROW][C]37[/C][C]9701[/C][C]9915.76260133212[/C][C]-214.762601332119[/C][/ROW]
[ROW][C]38[/C][C]9049[/C][C]9176.32621688454[/C][C]-127.326216884545[/C][/ROW]
[ROW][C]39[/C][C]10190[/C][C]9848.06241635255[/C][C]341.937583647452[/C][/ROW]
[ROW][C]40[/C][C]9706[/C][C]9513.49652211917[/C][C]192.503477880829[/C][/ROW]
[ROW][C]41[/C][C]9765[/C][C]9351.32399773923[/C][C]413.676002260770[/C][/ROW]
[ROW][C]42[/C][C]9893[/C][C]10011.5769550406[/C][C]-118.576955040602[/C][/ROW]
[ROW][C]43[/C][C]9994[/C][C]10624.780152[/C][C]-630.780151999999[/C][/ROW]
[ROW][C]44[/C][C]10433[/C][C]10330.8472734194[/C][C]102.152726580614[/C][/ROW]
[ROW][C]45[/C][C]10073[/C][C]10153.8417277231[/C][C]-80.8417277231401[/C][/ROW]
[ROW][C]46[/C][C]10112[/C][C]9956.5284051429[/C][C]155.471594857101[/C][/ROW]
[ROW][C]47[/C][C]9266[/C][C]9521.55817626532[/C][C]-255.558176265324[/C][/ROW]
[ROW][C]48[/C][C]9820[/C][C]10214.0778465724[/C][C]-394.077846572382[/C][/ROW]
[ROW][C]49[/C][C]10097[/C][C]10030.1999616757[/C][C]66.8000383243361[/C][/ROW]
[ROW][C]50[/C][C]9115[/C][C]9342.83461443313[/C][C]-227.83461443313[/C][/ROW]
[ROW][C]51[/C][C]10411[/C][C]10429.0561821783[/C][C]-18.0561821782794[/C][/ROW]
[ROW][C]52[/C][C]9678[/C][C]9948.12953723954[/C][C]-270.129537239542[/C][/ROW]
[ROW][C]53[/C][C]10408[/C][C]9955.09156859064[/C][C]452.908431409363[/C][/ROW]
[ROW][C]54[/C][C]10153[/C][C]10172.2841648514[/C][C]-19.2841648514459[/C][/ROW]
[ROW][C]55[/C][C]10368[/C][C]10359.0247185159[/C][C]8.97528148409765[/C][/ROW]
[ROW][C]56[/C][C]10581[/C][C]10679.8494940193[/C][C]-98.8494940192577[/C][/ROW]
[ROW][C]57[/C][C]10597[/C][C]10335.7061881076[/C][C]261.293811892412[/C][/ROW]
[ROW][C]58[/C][C]10680[/C][C]10333.3314094461[/C][C]346.668590553863[/C][/ROW]
[ROW][C]59[/C][C]9738[/C][C]9539.61480190356[/C][C]198.385198096435[/C][/ROW]
[ROW][C]60[/C][C]9556[/C][C]10138.0385857807[/C][C]-582.038585780661[/C][/ROW]
[/TABLE]
Source: https://freestatistics.org/blog/index.php?pk=63743&T=2

Globally Unique Identifier (entire table): ba.freestatistics.org/blog/index.php?pk=63743&T=2

As an alternative you can also use a QR Code:  

The GUIDs for individual cells are displayed in the table below:

Interpolation Forecasts of Exponential Smoothing
tObservedFittedResiduals
1395679504.6211907573762.3788092426312
1485478497.5953941767149.4046058232889
1591859134.3715488208750.6284511791328
1694709419.9447724153150.0552275846912
1791239086.8466716476936.1533283523077
1892789232.437191849345.5628081506929
19101709972.17813280312197.821867196884
2094349668.37052643057-234.370526430568
2196559389.14053659324265.859463406765
2294299688.6802711065-259.680271106492
2387398707.3842379586331.6157620413705
2495529283.39278430658268.607215693422
2596879676.4203920387810.5796079612210
2690198648.95048781814370.049512181862
2796729304.463711084367.536288916001
2892069605.45821250016-399.458212500162
2990699257.01606983497-188.016069834974
3097889414.38648161398373.613518386021
311031210303.32888000748.67111999263761
32101059634.90329740947470.09670259053
3398639787.851506299775.1484937003006
3496569657.6997988451-1.69979884510758
3592958914.55273764873380.44726235127
3699469719.04753684196226.952463158043
3797019915.76260133212-214.762601332119
3890499176.32621688454-127.326216884545
39101909848.06241635255341.937583647452
4097069513.49652211917192.503477880829
4197659351.32399773923413.676002260770
42989310011.5769550406-118.576955040602
43999410624.780152-630.780151999999
441043310330.8472734194102.152726580614
451007310153.8417277231-80.8417277231401
46101129956.5284051429155.471594857101
4792669521.55817626532-255.558176265324
48982010214.0778465724-394.077846572382
491009710030.199961675766.8000383243361
5091159342.83461443313-227.83461443313
511041110429.0561821783-18.0561821782794
5296789948.12953723954-270.129537239542
53104089955.09156859064452.908431409363
541015310172.2841648514-19.2841648514459
551036810359.02471851598.97528148409765
561058110679.8494940193-98.8494940192577
571059710335.7061881076261.293811892412
581068010333.3314094461346.668590553863
5997389539.61480190356198.385198096435
60955610138.0385857807-582.038585780661


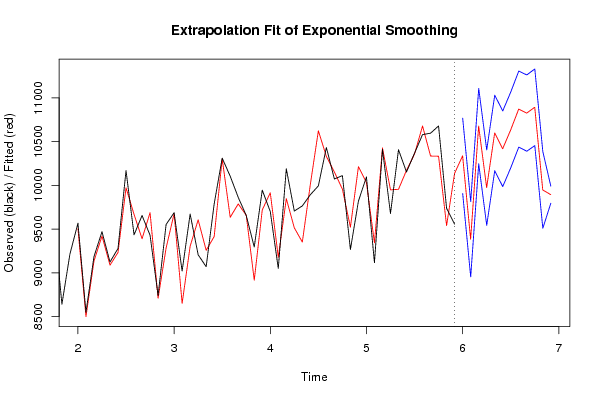
Extrapolation Forecasts of Exponential Smoothing
tForecast95% Lower Bound95% Upper Bound
6110338.36075488449907.491457856410769.2300519124
629383.523972191758952.584837953459814.46310643004
6310678.612511112710247.444553289811109.7804689355
649973.835796937669542.4112523874610405.2603414879
6510599.845929974610167.837751371311031.8541085779
6610418.73435505719986.0769612286510851.3917488856
6710634.938010142610201.251006449411068.6250138357
6810873.080979118510437.992587273011308.1693709640
6910827.208833393810390.591541669811263.8261251178
7010893.713545036310455.109806320511332.3172837522
719947.646764463799508.416970883910386.8765580437
729893.568416713249795.971649125089991.1651843014

\begin{tabular}{lllllllll}
\hline
Extrapolation Forecasts of Exponential Smoothing \tabularnewline
t & Forecast & 95% Lower Bound & 95% Upper Bound \tabularnewline
61 & 10338.3607548844 & 9907.4914578564 & 10769.2300519124 \tabularnewline
62 & 9383.52397219175 & 8952.58483795345 & 9814.46310643004 \tabularnewline
63 & 10678.6125111127 & 10247.4445532898 & 11109.7804689355 \tabularnewline
64 & 9973.83579693766 & 9542.41125238746 & 10405.2603414879 \tabularnewline
65 & 10599.8459299746 & 10167.8377513713 & 11031.8541085779 \tabularnewline
66 & 10418.7343550571 & 9986.07696122865 & 10851.3917488856 \tabularnewline
67 & 10634.9380101426 & 10201.2510064494 & 11068.6250138357 \tabularnewline
68 & 10873.0809791185 & 10437.9925872730 & 11308.1693709640 \tabularnewline
69 & 10827.2088333938 & 10390.5915416698 & 11263.8261251178 \tabularnewline
70 & 10893.7135450363 & 10455.1098063205 & 11332.3172837522 \tabularnewline
71 & 9947.64676446379 & 9508.4169708839 & 10386.8765580437 \tabularnewline
72 & 9893.56841671324 & 9795.97164912508 & 9991.1651843014 \tabularnewline
\hline
\end{tabular}
%Source: https://freestatistics.org/blog/index.php?pk=63743&T=3

[TABLE]
[ROW][C]Extrapolation Forecasts of Exponential Smoothing[/C][/ROW]
[ROW][C]t[/C][C]Forecast[/C][C]95% Lower Bound[/C][C]95% Upper Bound[/C][/ROW]
[ROW][C]61[/C][C]10338.3607548844[/C][C]9907.4914578564[/C][C]10769.2300519124[/C][/ROW]
[ROW][C]62[/C][C]9383.52397219175[/C][C]8952.58483795345[/C][C]9814.46310643004[/C][/ROW]
[ROW][C]63[/C][C]10678.6125111127[/C][C]10247.4445532898[/C][C]11109.7804689355[/C][/ROW]
[ROW][C]64[/C][C]9973.83579693766[/C][C]9542.41125238746[/C][C]10405.2603414879[/C][/ROW]
[ROW][C]65[/C][C]10599.8459299746[/C][C]10167.8377513713[/C][C]11031.8541085779[/C][/ROW]
[ROW][C]66[/C][C]10418.7343550571[/C][C]9986.07696122865[/C][C]10851.3917488856[/C][/ROW]
[ROW][C]67[/C][C]10634.9380101426[/C][C]10201.2510064494[/C][C]11068.6250138357[/C][/ROW]
[ROW][C]68[/C][C]10873.0809791185[/C][C]10437.9925872730[/C][C]11308.1693709640[/C][/ROW]
[ROW][C]69[/C][C]10827.2088333938[/C][C]10390.5915416698[/C][C]11263.8261251178[/C][/ROW]
[ROW][C]70[/C][C]10893.7135450363[/C][C]10455.1098063205[/C][C]11332.3172837522[/C][/ROW]
[ROW][C]71[/C][C]9947.64676446379[/C][C]9508.4169708839[/C][C]10386.8765580437[/C][/ROW]
[ROW][C]72[/C][C]9893.56841671324[/C][C]9795.97164912508[/C][C]9991.1651843014[/C][/ROW]
[/TABLE]
Source: https://freestatistics.org/blog/index.php?pk=63743&T=3

Globally Unique Identifier (entire table): ba.freestatistics.org/blog/index.php?pk=63743&T=3

As an alternative you can also use a QR Code:  

The GUIDs for individual cells are displayed in the table below:

Extrapolation Forecasts of Exponential Smoothing
tForecast95% Lower Bound95% Upper Bound
6110338.36075488449907.491457856410769.2300519124
629383.523972191758952.584837953459814.46310643004
6310678.612511112710247.444553289811109.7804689355
649973.835796937669542.4112523874610405.2603414879
6510599.845929974610167.837751371311031.8541085779
6610418.73435505719986.0769612286510851.3917488856
6710634.938010142610201.251006449411068.6250138357
6810873.080979118510437.992587273011308.1693709640
6910827.208833393810390.591541669811263.8261251178
7010893.713545036310455.109806320511332.3172837522
719947.646764463799508.416970883910386.8765580437
729893.568416713249795.971649125089991.1651843014


Parameters (Session):
par1 = 12 ; par2 = Triple ; par3 = multiplicative ;
Parameters (R input):
par1 = 12 ; par2 = Triple ; par3 = multiplicative ;
R code (references can be found in the software module):
par1 <- as.numeric(par1)
if (par2 == 'Single') K <- 1
if (par2 == 'Double') K <- 2
if (par2 == 'Triple') K <- par1
nx <- length(x)
nxmK <- nx - K
x <- ts(x, frequency = par1)
if (par2 == 'Single') fit <- HoltWinters(x, gamma=0, beta=0)
if (par2 == 'Double') fit <- HoltWinters(x, gamma=0)
if (par2 == 'Triple') fit <- HoltWinters(x, seasonal=par3)
fit
myresid <- x - fit$fitted[,'xhat']
bitmap(file='test1.png')
op <- par(mfrow=c(2,1))
plot(fit,ylab='Observed (black) / Fitted (red)',main='Interpolation Fit of Exponential Smoothing')
plot(myresid,ylab='Residuals',main='Interpolation Prediction Errors')
par(op)
dev.off()
bitmap(file='test2.png')
p <- predict(fit, par1, prediction.interval=TRUE)
np <- length(p[,1])
plot(fit,p,ylab='Observed (black) / Fitted (red)',main='Extrapolation Fit of Exponential Smoothing')
dev.off()
bitmap(file='test3.png')
op <- par(mfrow = c(2,2))
acf(as.numeric(myresid),lag.max = nx/2,main='Residual ACF')
spectrum(myresid,main='Residals Periodogram')
cpgram(myresid,main='Residal Cumulative Periodogram')
qqnorm(myresid,main='Residual Normal QQ Plot')
qqline(myresid)
par(op)
dev.off()
load(file='createtable')
a<-table.start()
a<-table.row.start(a)
a<-table.element(a,'Estimated Parameters of Exponential Smoothing',2,TRUE)
a<-table.row.end(a)
a<-table.row.start(a)
a<-table.element(a,'Parameter',header=TRUE)
a<-table.element(a,'Value',header=TRUE)
a<-table.row.end(a)
a<-table.row.start(a)
a<-table.element(a,'alpha',header=TRUE)
a<-table.element(a,fit$alpha)
a<-table.row.end(a)
a<-table.row.start(a)
a<-table.element(a,'beta',header=TRUE)
a<-table.element(a,fit$beta)
a<-table.row.end(a)
a<-table.row.start(a)
a<-table.element(a,'gamma',header=TRUE)
a<-table.element(a,fit$gamma)
a<-table.row.end(a)
a<-table.end(a)
table.save(a,file='mytable.tab')
a<-table.start()
a<-table.row.start(a)
a<-table.element(a,'Interpolation Forecasts of Exponential Smoothing',4,TRUE)
a<-table.row.end(a)
a<-table.row.start(a)
a<-table.element(a,'t',header=TRUE)
a<-table.element(a,'Observed',header=TRUE)
a<-table.element(a,'Fitted',header=TRUE)
a<-table.element(a,'Residuals',header=TRUE)
a<-table.row.end(a)
for (i in 1:nxmK) {
a<-table.row.start(a)
a<-table.element(a,i+K,header=TRUE)
a<-table.element(a,x[i+K])
a<-table.element(a,fit$fitted[i,'xhat'])
a<-table.element(a,myresid[i])
a<-table.row.end(a)
}
a<-table.end(a)
table.save(a,file='mytable1.tab')
a<-table.start()
a<-table.row.start(a)
a<-table.element(a,'Extrapolation Forecasts of Exponential Smoothing',4,TRUE)
a<-table.row.end(a)
a<-table.row.start(a)
a<-table.element(a,'t',header=TRUE)
a<-table.element(a,'Forecast',header=TRUE)
a<-table.element(a,'95% Lower Bound',header=TRUE)
a<-table.element(a,'95% Upper Bound',header=TRUE)
a<-table.row.end(a)
for (i in 1:np) {
a<-table.row.start(a)
a<-table.element(a,nx+i,header=TRUE)
a<-table.element(a,p[i,'fit'])
a<-table.element(a,p[i,'lwr'])
a<-table.element(a,p[i,'upr'])
a<-table.row.end(a)
}
a<-table.end(a)
table.save(a,file='mytable2.tab')