Free Statistics

of Irreproducible Research!

Author's title

Author*The author of this computation has been verified*
R Software Modulerwasp_autocorrelation.wasp
Title produced by software(Partial) Autocorrelation Function
Date of computationFri, 04 Dec 2009 08:29:39 -0700
Cite this page as followsStatistical Computations at FreeStatistics.org, Office for Research Development and Education, URL https://freestatistics.org/blog/index.php?v=date/2009/Dec/04/t125994066702l03zr491scyur.htm/, Retrieved Sat, 27 Apr 2024 16:46:36 +0000
Statistical Computations at FreeStatistics.org, Office for Research Development and Education, URL https://freestatistics.org/blog/index.php?pk=63763, Retrieved Sat, 27 Apr 2024 16:46:36 +0000
QR Codes:

Original text written by user:
IsPrivate?No (this computation is public)
User-defined keywords
Estimated Impact97
Family? (F = Feedback message, R = changed R code, M = changed R Module, P = changed Parameters, D = changed Data)
-     [Univariate Data Series] [data set] [2008-12-01 19:54:57] [b98453cac15ba1066b407e146608df68]
- RMP   [(Partial) Autocorrelation Function] [] [2009-11-27 14:46:03] [b98453cac15ba1066b407e146608df68]
-    D      [(Partial) Autocorrelation Function] [] [2009-12-04 15:29:39] [a1151e037da67acc5ce4bbcb8804d7f1] [Current]
Feedback Forum

Post a new message
Dataseries X:
392
394
392
396
392
396
419
421
420
418
410
418
426
428
430
424
423
427
441
449
452
462
455
461
461
463
462
456
455
456
472
472
471
465
459
465
468
467
463
460
462
461
476
476
471
453
443
442
444
438
427
424
416
406
431
434
418
412
404
409
412


Summary of computational transaction
Raw Inputview raw input (R code)
Raw Outputview raw output of R engine
Computing time0 seconds
R Server'Gwilym Jenkins' @ 72.249.127.135

\begin{tabular}{lllllllll}
\hline
Summary of computational transaction \tabularnewline
Raw Input & view raw input (R code)  \tabularnewline
Raw Output & view raw output of R engine  \tabularnewline
Computing time & 0 seconds \tabularnewline
R Server & 'Gwilym Jenkins' @ 72.249.127.135 \tabularnewline
\hline
\end{tabular}
%Source: https://freestatistics.org/blog/index.php?pk=63763&T=0

[TABLE]
[ROW][C]Summary of computational transaction[/C][/ROW]
[ROW][C]Raw Input[/C][C]view raw input (R code) [/C][/ROW]
[ROW][C]Raw Output[/C][C]view raw output of R engine [/C][/ROW]
[ROW][C]Computing time[/C][C]0 seconds[/C][/ROW]
[ROW][C]R Server[/C][C]'Gwilym Jenkins' @ 72.249.127.135[/C][/ROW]
[/TABLE]
Source: https://freestatistics.org/blog/index.php?pk=63763&T=0

Globally Unique Identifier (entire table): ba.freestatistics.org/blog/index.php?pk=63763&T=0

As an alternative you can also use a QR Code:  

The GUIDs for individual cells are displayed in the table below:

Summary of computational transaction
Raw Inputview raw input (R code)
Raw Outputview raw output of R engine
Computing time0 seconds
R Server'Gwilym Jenkins' @ 72.249.127.135


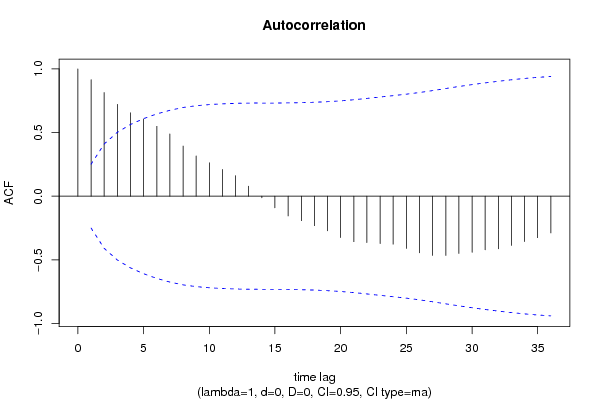
Autocorrelation Function
Time lag kACF(k)T-STATP-value
10.9151797.14780
20.8143696.36040
30.7215995.63590
40.6553475.11842e-06
50.6062974.73537e-06
60.5494764.29153.2e-05
70.4891653.82050.000157
80.3940233.07740.001563
90.3160372.46830.008197
100.2620622.04680.022498
110.210251.64210.052857
120.1613161.25990.106249
130.0788710.6160.270092
14-0.01296-0.10120.459855
15-0.091972-0.71830.23765
16-0.154916-1.20990.115486
17-0.192291-1.50180.069148
18-0.232032-1.81220.037437
19-0.271863-2.12330.018896
20-0.32547-2.5420.006789
21-0.35811-2.79690.003446
22-0.36511-2.85160.002964
23-0.372501-2.90930.002524
24-0.377357-2.94730.002268
25-0.410577-3.20670.00107
26-0.445087-3.47620.000471
27-0.465575-3.63630.000285
28-0.466078-3.64020.000281
29-0.450358-3.51740.000415
30-0.441005-3.44440.00052
31-0.421298-3.29040.000833
32-0.414189-3.23490.000983
33-0.387741-3.02840.001801
34-0.357017-2.78840.003527
35-0.326396-2.54920.006663
36-0.288575-2.25380.013905

\begin{tabular}{lllllllll}
\hline
Autocorrelation Function \tabularnewline
Time lag k & ACF(k) & T-STAT & P-value \tabularnewline
1 & 0.915179 & 7.1478 & 0 \tabularnewline
2 & 0.814369 & 6.3604 & 0 \tabularnewline
3 & 0.721599 & 5.6359 & 0 \tabularnewline
4 & 0.655347 & 5.1184 & 2e-06 \tabularnewline
5 & 0.606297 & 4.7353 & 7e-06 \tabularnewline
6 & 0.549476 & 4.2915 & 3.2e-05 \tabularnewline
7 & 0.489165 & 3.8205 & 0.000157 \tabularnewline
8 & 0.394023 & 3.0774 & 0.001563 \tabularnewline
9 & 0.316037 & 2.4683 & 0.008197 \tabularnewline
10 & 0.262062 & 2.0468 & 0.022498 \tabularnewline
11 & 0.21025 & 1.6421 & 0.052857 \tabularnewline
12 & 0.161316 & 1.2599 & 0.106249 \tabularnewline
13 & 0.078871 & 0.616 & 0.270092 \tabularnewline
14 & -0.01296 & -0.1012 & 0.459855 \tabularnewline
15 & -0.091972 & -0.7183 & 0.23765 \tabularnewline
16 & -0.154916 & -1.2099 & 0.115486 \tabularnewline
17 & -0.192291 & -1.5018 & 0.069148 \tabularnewline
18 & -0.232032 & -1.8122 & 0.037437 \tabularnewline
19 & -0.271863 & -2.1233 & 0.018896 \tabularnewline
20 & -0.32547 & -2.542 & 0.006789 \tabularnewline
21 & -0.35811 & -2.7969 & 0.003446 \tabularnewline
22 & -0.36511 & -2.8516 & 0.002964 \tabularnewline
23 & -0.372501 & -2.9093 & 0.002524 \tabularnewline
24 & -0.377357 & -2.9473 & 0.002268 \tabularnewline
25 & -0.410577 & -3.2067 & 0.00107 \tabularnewline
26 & -0.445087 & -3.4762 & 0.000471 \tabularnewline
27 & -0.465575 & -3.6363 & 0.000285 \tabularnewline
28 & -0.466078 & -3.6402 & 0.000281 \tabularnewline
29 & -0.450358 & -3.5174 & 0.000415 \tabularnewline
30 & -0.441005 & -3.4444 & 0.00052 \tabularnewline
31 & -0.421298 & -3.2904 & 0.000833 \tabularnewline
32 & -0.414189 & -3.2349 & 0.000983 \tabularnewline
33 & -0.387741 & -3.0284 & 0.001801 \tabularnewline
34 & -0.357017 & -2.7884 & 0.003527 \tabularnewline
35 & -0.326396 & -2.5492 & 0.006663 \tabularnewline
36 & -0.288575 & -2.2538 & 0.013905 \tabularnewline
\hline
\end{tabular}
%Source: https://freestatistics.org/blog/index.php?pk=63763&T=1

[TABLE]
[ROW][C]Autocorrelation Function[/C][/ROW]
[ROW][C]Time lag k[/C][C]ACF(k)[/C][C]T-STAT[/C][C]P-value[/C][/ROW]
[ROW][C]1[/C][C]0.915179[/C][C]7.1478[/C][C]0[/C][/ROW]
[ROW][C]2[/C][C]0.814369[/C][C]6.3604[/C][C]0[/C][/ROW]
[ROW][C]3[/C][C]0.721599[/C][C]5.6359[/C][C]0[/C][/ROW]
[ROW][C]4[/C][C]0.655347[/C][C]5.1184[/C][C]2e-06[/C][/ROW]
[ROW][C]5[/C][C]0.606297[/C][C]4.7353[/C][C]7e-06[/C][/ROW]
[ROW][C]6[/C][C]0.549476[/C][C]4.2915[/C][C]3.2e-05[/C][/ROW]
[ROW][C]7[/C][C]0.489165[/C][C]3.8205[/C][C]0.000157[/C][/ROW]
[ROW][C]8[/C][C]0.394023[/C][C]3.0774[/C][C]0.001563[/C][/ROW]
[ROW][C]9[/C][C]0.316037[/C][C]2.4683[/C][C]0.008197[/C][/ROW]
[ROW][C]10[/C][C]0.262062[/C][C]2.0468[/C][C]0.022498[/C][/ROW]
[ROW][C]11[/C][C]0.21025[/C][C]1.6421[/C][C]0.052857[/C][/ROW]
[ROW][C]12[/C][C]0.161316[/C][C]1.2599[/C][C]0.106249[/C][/ROW]
[ROW][C]13[/C][C]0.078871[/C][C]0.616[/C][C]0.270092[/C][/ROW]
[ROW][C]14[/C][C]-0.01296[/C][C]-0.1012[/C][C]0.459855[/C][/ROW]
[ROW][C]15[/C][C]-0.091972[/C][C]-0.7183[/C][C]0.23765[/C][/ROW]
[ROW][C]16[/C][C]-0.154916[/C][C]-1.2099[/C][C]0.115486[/C][/ROW]
[ROW][C]17[/C][C]-0.192291[/C][C]-1.5018[/C][C]0.069148[/C][/ROW]
[ROW][C]18[/C][C]-0.232032[/C][C]-1.8122[/C][C]0.037437[/C][/ROW]
[ROW][C]19[/C][C]-0.271863[/C][C]-2.1233[/C][C]0.018896[/C][/ROW]
[ROW][C]20[/C][C]-0.32547[/C][C]-2.542[/C][C]0.006789[/C][/ROW]
[ROW][C]21[/C][C]-0.35811[/C][C]-2.7969[/C][C]0.003446[/C][/ROW]
[ROW][C]22[/C][C]-0.36511[/C][C]-2.8516[/C][C]0.002964[/C][/ROW]
[ROW][C]23[/C][C]-0.372501[/C][C]-2.9093[/C][C]0.002524[/C][/ROW]
[ROW][C]24[/C][C]-0.377357[/C][C]-2.9473[/C][C]0.002268[/C][/ROW]
[ROW][C]25[/C][C]-0.410577[/C][C]-3.2067[/C][C]0.00107[/C][/ROW]
[ROW][C]26[/C][C]-0.445087[/C][C]-3.4762[/C][C]0.000471[/C][/ROW]
[ROW][C]27[/C][C]-0.465575[/C][C]-3.6363[/C][C]0.000285[/C][/ROW]
[ROW][C]28[/C][C]-0.466078[/C][C]-3.6402[/C][C]0.000281[/C][/ROW]
[ROW][C]29[/C][C]-0.450358[/C][C]-3.5174[/C][C]0.000415[/C][/ROW]
[ROW][C]30[/C][C]-0.441005[/C][C]-3.4444[/C][C]0.00052[/C][/ROW]
[ROW][C]31[/C][C]-0.421298[/C][C]-3.2904[/C][C]0.000833[/C][/ROW]
[ROW][C]32[/C][C]-0.414189[/C][C]-3.2349[/C][C]0.000983[/C][/ROW]
[ROW][C]33[/C][C]-0.387741[/C][C]-3.0284[/C][C]0.001801[/C][/ROW]
[ROW][C]34[/C][C]-0.357017[/C][C]-2.7884[/C][C]0.003527[/C][/ROW]
[ROW][C]35[/C][C]-0.326396[/C][C]-2.5492[/C][C]0.006663[/C][/ROW]
[ROW][C]36[/C][C]-0.288575[/C][C]-2.2538[/C][C]0.013905[/C][/ROW]
[/TABLE]
Source: https://freestatistics.org/blog/index.php?pk=63763&T=1

Globally Unique Identifier (entire table): ba.freestatistics.org/blog/index.php?pk=63763&T=1

As an alternative you can also use a QR Code:  

The GUIDs for individual cells are displayed in the table below:

Autocorrelation Function
Time lag kACF(k)T-STATP-value
10.9151797.14780
20.8143696.36040
30.7215995.63590
40.6553475.11842e-06
50.6062974.73537e-06
60.5494764.29153.2e-05
70.4891653.82050.000157
80.3940233.07740.001563
90.3160372.46830.008197
100.2620622.04680.022498
110.210251.64210.052857
120.1613161.25990.106249
130.0788710.6160.270092
14-0.01296-0.10120.459855
15-0.091972-0.71830.23765
16-0.154916-1.20990.115486
17-0.192291-1.50180.069148
18-0.232032-1.81220.037437
19-0.271863-2.12330.018896
20-0.32547-2.5420.006789
21-0.35811-2.79690.003446
22-0.36511-2.85160.002964
23-0.372501-2.90930.002524
24-0.377357-2.94730.002268
25-0.410577-3.20670.00107
26-0.445087-3.47620.000471
27-0.465575-3.63630.000285
28-0.466078-3.64020.000281
29-0.450358-3.51740.000415
30-0.441005-3.44440.00052
31-0.421298-3.29040.000833
32-0.414189-3.23490.000983
33-0.387741-3.02840.001801
34-0.357017-2.78840.003527
35-0.326396-2.54920.006663
36-0.288575-2.25380.013905


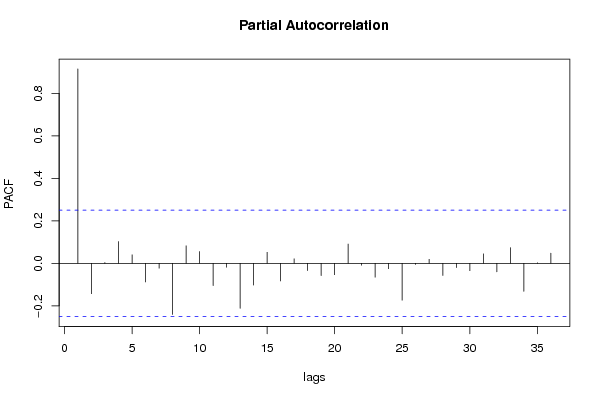
Partial Autocorrelation Function
Time lag kPACF(k)T-STATP-value
10.9151797.14780
2-0.142711-1.11460.134695
30.0034570.0270.489274
40.1027670.80260.212651
50.0399480.3120.378052
6-0.087615-0.68430.248191
7-0.023-0.17960.429017
8-0.240455-1.8780.032581
90.0823850.64340.261173
100.055760.43550.332368
11-0.10487-0.81910.20797
12-0.018277-0.14280.443478
13-0.211977-1.65560.05147
14-0.102191-0.79810.213944
150.0517020.40380.343884
16-0.082725-0.64610.260318
170.0213950.16710.433923
18-0.034227-0.26730.395062
19-0.057655-0.45030.327045
20-0.053198-0.41550.339622
210.0906480.7080.240827
22-0.008491-0.06630.47367
23-0.064927-0.50710.306959
24-0.025083-0.19590.422667
25-0.173164-1.35250.090612
26-0.004981-0.03890.484548
270.0192490.15030.440498
28-0.05699-0.44510.328908
29-0.019914-0.15550.438456
30-0.034745-0.27140.393514
310.0446040.34840.364381
32-0.039694-0.310.3788
330.0739240.57740.28291
34-0.131738-1.02890.153794
350.0027080.02110.491598
360.0479360.37440.354705

\begin{tabular}{lllllllll}
\hline
Partial Autocorrelation Function \tabularnewline
Time lag k & PACF(k) & T-STAT & P-value \tabularnewline
1 & 0.915179 & 7.1478 & 0 \tabularnewline
2 & -0.142711 & -1.1146 & 0.134695 \tabularnewline
3 & 0.003457 & 0.027 & 0.489274 \tabularnewline
4 & 0.102767 & 0.8026 & 0.212651 \tabularnewline
5 & 0.039948 & 0.312 & 0.378052 \tabularnewline
6 & -0.087615 & -0.6843 & 0.248191 \tabularnewline
7 & -0.023 & -0.1796 & 0.429017 \tabularnewline
8 & -0.240455 & -1.878 & 0.032581 \tabularnewline
9 & 0.082385 & 0.6434 & 0.261173 \tabularnewline
10 & 0.05576 & 0.4355 & 0.332368 \tabularnewline
11 & -0.10487 & -0.8191 & 0.20797 \tabularnewline
12 & -0.018277 & -0.1428 & 0.443478 \tabularnewline
13 & -0.211977 & -1.6556 & 0.05147 \tabularnewline
14 & -0.102191 & -0.7981 & 0.213944 \tabularnewline
15 & 0.051702 & 0.4038 & 0.343884 \tabularnewline
16 & -0.082725 & -0.6461 & 0.260318 \tabularnewline
17 & 0.021395 & 0.1671 & 0.433923 \tabularnewline
18 & -0.034227 & -0.2673 & 0.395062 \tabularnewline
19 & -0.057655 & -0.4503 & 0.327045 \tabularnewline
20 & -0.053198 & -0.4155 & 0.339622 \tabularnewline
21 & 0.090648 & 0.708 & 0.240827 \tabularnewline
22 & -0.008491 & -0.0663 & 0.47367 \tabularnewline
23 & -0.064927 & -0.5071 & 0.306959 \tabularnewline
24 & -0.025083 & -0.1959 & 0.422667 \tabularnewline
25 & -0.173164 & -1.3525 & 0.090612 \tabularnewline
26 & -0.004981 & -0.0389 & 0.484548 \tabularnewline
27 & 0.019249 & 0.1503 & 0.440498 \tabularnewline
28 & -0.05699 & -0.4451 & 0.328908 \tabularnewline
29 & -0.019914 & -0.1555 & 0.438456 \tabularnewline
30 & -0.034745 & -0.2714 & 0.393514 \tabularnewline
31 & 0.044604 & 0.3484 & 0.364381 \tabularnewline
32 & -0.039694 & -0.31 & 0.3788 \tabularnewline
33 & 0.073924 & 0.5774 & 0.28291 \tabularnewline
34 & -0.131738 & -1.0289 & 0.153794 \tabularnewline
35 & 0.002708 & 0.0211 & 0.491598 \tabularnewline
36 & 0.047936 & 0.3744 & 0.354705 \tabularnewline
\hline
\end{tabular}
%Source: https://freestatistics.org/blog/index.php?pk=63763&T=2

[TABLE]
[ROW][C]Partial Autocorrelation Function[/C][/ROW]
[ROW][C]Time lag k[/C][C]PACF(k)[/C][C]T-STAT[/C][C]P-value[/C][/ROW]
[ROW][C]1[/C][C]0.915179[/C][C]7.1478[/C][C]0[/C][/ROW]
[ROW][C]2[/C][C]-0.142711[/C][C]-1.1146[/C][C]0.134695[/C][/ROW]
[ROW][C]3[/C][C]0.003457[/C][C]0.027[/C][C]0.489274[/C][/ROW]
[ROW][C]4[/C][C]0.102767[/C][C]0.8026[/C][C]0.212651[/C][/ROW]
[ROW][C]5[/C][C]0.039948[/C][C]0.312[/C][C]0.378052[/C][/ROW]
[ROW][C]6[/C][C]-0.087615[/C][C]-0.6843[/C][C]0.248191[/C][/ROW]
[ROW][C]7[/C][C]-0.023[/C][C]-0.1796[/C][C]0.429017[/C][/ROW]
[ROW][C]8[/C][C]-0.240455[/C][C]-1.878[/C][C]0.032581[/C][/ROW]
[ROW][C]9[/C][C]0.082385[/C][C]0.6434[/C][C]0.261173[/C][/ROW]
[ROW][C]10[/C][C]0.05576[/C][C]0.4355[/C][C]0.332368[/C][/ROW]
[ROW][C]11[/C][C]-0.10487[/C][C]-0.8191[/C][C]0.20797[/C][/ROW]
[ROW][C]12[/C][C]-0.018277[/C][C]-0.1428[/C][C]0.443478[/C][/ROW]
[ROW][C]13[/C][C]-0.211977[/C][C]-1.6556[/C][C]0.05147[/C][/ROW]
[ROW][C]14[/C][C]-0.102191[/C][C]-0.7981[/C][C]0.213944[/C][/ROW]
[ROW][C]15[/C][C]0.051702[/C][C]0.4038[/C][C]0.343884[/C][/ROW]
[ROW][C]16[/C][C]-0.082725[/C][C]-0.6461[/C][C]0.260318[/C][/ROW]
[ROW][C]17[/C][C]0.021395[/C][C]0.1671[/C][C]0.433923[/C][/ROW]
[ROW][C]18[/C][C]-0.034227[/C][C]-0.2673[/C][C]0.395062[/C][/ROW]
[ROW][C]19[/C][C]-0.057655[/C][C]-0.4503[/C][C]0.327045[/C][/ROW]
[ROW][C]20[/C][C]-0.053198[/C][C]-0.4155[/C][C]0.339622[/C][/ROW]
[ROW][C]21[/C][C]0.090648[/C][C]0.708[/C][C]0.240827[/C][/ROW]
[ROW][C]22[/C][C]-0.008491[/C][C]-0.0663[/C][C]0.47367[/C][/ROW]
[ROW][C]23[/C][C]-0.064927[/C][C]-0.5071[/C][C]0.306959[/C][/ROW]
[ROW][C]24[/C][C]-0.025083[/C][C]-0.1959[/C][C]0.422667[/C][/ROW]
[ROW][C]25[/C][C]-0.173164[/C][C]-1.3525[/C][C]0.090612[/C][/ROW]
[ROW][C]26[/C][C]-0.004981[/C][C]-0.0389[/C][C]0.484548[/C][/ROW]
[ROW][C]27[/C][C]0.019249[/C][C]0.1503[/C][C]0.440498[/C][/ROW]
[ROW][C]28[/C][C]-0.05699[/C][C]-0.4451[/C][C]0.328908[/C][/ROW]
[ROW][C]29[/C][C]-0.019914[/C][C]-0.1555[/C][C]0.438456[/C][/ROW]
[ROW][C]30[/C][C]-0.034745[/C][C]-0.2714[/C][C]0.393514[/C][/ROW]
[ROW][C]31[/C][C]0.044604[/C][C]0.3484[/C][C]0.364381[/C][/ROW]
[ROW][C]32[/C][C]-0.039694[/C][C]-0.31[/C][C]0.3788[/C][/ROW]
[ROW][C]33[/C][C]0.073924[/C][C]0.5774[/C][C]0.28291[/C][/ROW]
[ROW][C]34[/C][C]-0.131738[/C][C]-1.0289[/C][C]0.153794[/C][/ROW]
[ROW][C]35[/C][C]0.002708[/C][C]0.0211[/C][C]0.491598[/C][/ROW]
[ROW][C]36[/C][C]0.047936[/C][C]0.3744[/C][C]0.354705[/C][/ROW]
[/TABLE]
Source: https://freestatistics.org/blog/index.php?pk=63763&T=2

Globally Unique Identifier (entire table): ba.freestatistics.org/blog/index.php?pk=63763&T=2

As an alternative you can also use a QR Code:  

The GUIDs for individual cells are displayed in the table below:

Partial Autocorrelation Function
Time lag kPACF(k)T-STATP-value
10.9151797.14780
2-0.142711-1.11460.134695
30.0034570.0270.489274
40.1027670.80260.212651
50.0399480.3120.378052
6-0.087615-0.68430.248191
7-0.023-0.17960.429017
8-0.240455-1.8780.032581
90.0823850.64340.261173
100.055760.43550.332368
11-0.10487-0.81910.20797
12-0.018277-0.14280.443478
13-0.211977-1.65560.05147
14-0.102191-0.79810.213944
150.0517020.40380.343884
16-0.082725-0.64610.260318
170.0213950.16710.433923
18-0.034227-0.26730.395062
19-0.057655-0.45030.327045
20-0.053198-0.41550.339622
210.0906480.7080.240827
22-0.008491-0.06630.47367
23-0.064927-0.50710.306959
24-0.025083-0.19590.422667
25-0.173164-1.35250.090612
26-0.004981-0.03890.484548
270.0192490.15030.440498
28-0.05699-0.44510.328908
29-0.019914-0.15550.438456
30-0.034745-0.27140.393514
310.0446040.34840.364381
32-0.039694-0.310.3788
330.0739240.57740.28291
34-0.131738-1.02890.153794
350.0027080.02110.491598
360.0479360.37440.354705


Parameters (Session):
par1 = 36 ; par2 = 1 ; par3 = 0 ; par4 = 0 ; par5 = 12 ; par6 = MA ; par7 = 0.95 ;
Parameters (R input):
par1 = 36 ; par2 = 1 ; par3 = 0 ; par4 = 0 ; par5 = 12 ; par6 = MA ; par7 = 0.95 ;
R code (references can be found in the software module):
if (par1 == 'Default') {
par1 = 10*log10(length(x))
} else {
par1 <- as.numeric(par1)
}
par2 <- as.numeric(par2)
par3 <- as.numeric(par3)
par4 <- as.numeric(par4)
par5 <- as.numeric(par5)
if (par6 == 'White Noise') par6 <- 'white' else par6 <- 'ma'
par7 <- as.numeric(par7)
if (par2 == 0) {
x <- log(x)
} else {
x <- (x ^ par2 - 1) / par2
}
if (par3 > 0) x <- diff(x,lag=1,difference=par3)
if (par4 > 0) x <- diff(x,lag=par5,difference=par4)
bitmap(file='pic1.png')
racf <- acf(x, par1, main='Autocorrelation', xlab='time lag', ylab='ACF', ci.type=par6, ci=par7, sub=paste('(lambda=',par2,', d=',par3,', D=',par4,', CI=', par7, ', CI type=',par6,')',sep=''))
dev.off()
bitmap(file='pic2.png')
rpacf <- pacf(x,par1,main='Partial Autocorrelation',xlab='lags',ylab='PACF')
dev.off()
(myacf <- c(racf$acf))
(mypacf <- c(rpacf$acf))
lengthx <- length(x)
sqrtn <- sqrt(lengthx)
load(file='createtable')
a<-table.start()
a<-table.row.start(a)
a<-table.element(a,'Autocorrelation Function',4,TRUE)
a<-table.row.end(a)
a<-table.row.start(a)
a<-table.element(a,'Time lag k',header=TRUE)
a<-table.element(a,hyperlink('basics.htm','ACF(k)','click here for more information about the Autocorrelation Function'),header=TRUE)
a<-table.element(a,'T-STAT',header=TRUE)
a<-table.element(a,'P-value',header=TRUE)
a<-table.row.end(a)
for (i in 2:(par1+1)) {
a<-table.row.start(a)
a<-table.element(a,i-1,header=TRUE)
a<-table.element(a,round(myacf[i],6))
mytstat <- myacf[i]*sqrtn
a<-table.element(a,round(mytstat,4))
a<-table.element(a,round(1-pt(abs(mytstat),lengthx),6))
a<-table.row.end(a)
}
a<-table.end(a)
table.save(a,file='mytable.tab')
a<-table.start()
a<-table.row.start(a)
a<-table.element(a,'Partial Autocorrelation Function',4,TRUE)
a<-table.row.end(a)
a<-table.row.start(a)
a<-table.element(a,'Time lag k',header=TRUE)
a<-table.element(a,hyperlink('basics.htm','PACF(k)','click here for more information about the Partial Autocorrelation Function'),header=TRUE)
a<-table.element(a,'T-STAT',header=TRUE)
a<-table.element(a,'P-value',header=TRUE)
a<-table.row.end(a)
for (i in 1:par1) {
a<-table.row.start(a)
a<-table.element(a,i,header=TRUE)
a<-table.element(a,round(mypacf[i],6))
mytstat <- mypacf[i]*sqrtn
a<-table.element(a,round(mytstat,4))
a<-table.element(a,round(1-pt(abs(mytstat),lengthx),6))
a<-table.row.end(a)
}
a<-table.end(a)
table.save(a,file='mytable1.tab')