Free Statistics

of Irreproducible Research!

Author's title

Author*The author of this computation has been verified*
R Software Modulerwasp_exponentialsmoothing.wasp
Title produced by softwareExponential Smoothing
Date of computationFri, 04 Dec 2009 08:35:15 -0700
Cite this page as followsStatistical Computations at FreeStatistics.org, Office for Research Development and Education, URL https://freestatistics.org/blog/index.php?v=date/2009/Dec/04/t1259940945k20r5bfoclolf27.htm/, Retrieved Sat, 27 Apr 2024 15:51:53 +0000
Statistical Computations at FreeStatistics.org, Office for Research Development and Education, URL https://freestatistics.org/blog/index.php?pk=63776, Retrieved Sat, 27 Apr 2024 15:51:53 +0000
QR Codes:

Original text written by user:
IsPrivate?No (this computation is public)
User-defined keywords
Estimated Impact97
Family? (F = Feedback message, R = changed R code, M = changed R Module, P = changed Parameters, D = changed Data)
-     [Univariate Data Series] [data set] [2008-12-01 19:54:57] [b98453cac15ba1066b407e146608df68]
- RMP   [Exponential Smoothing] [] [2009-11-27 15:04:36] [b98453cac15ba1066b407e146608df68]
-    D      [Exponential Smoothing] [ws 9: exponential...] [2009-12-04 15:35:15] [ac86848d66148c9c4c9404e0c9a511eb] [Current]
Feedback Forum

Post a new message
Dataseries X:
79.8
83.4
113.6
112.9
104
109.9
99
106.3
128.9
111.1
102.9
130
87
87.5
117.6
103.4
110.8
112.6
102.5
112.4
135.6
105.1
127.7
137
91
90.5
122.4
123.3
124.3
120
118.1
119
142.7
123.6
129.6
151.6
110.4
99.2
130.5
136.2
129.7
128
121.6
135.8
143.8
147.5
136.2
156.6
123.3
104.5
139.8
136.5
112.1
118.5
94.4
102.3
111.4
99.2
87.8
115.8


Summary of computational transaction
Raw Inputview raw input (R code)
Raw Outputview raw output of R engine
Computing time1 seconds
R Server'Gwilym Jenkins' @ 72.249.127.135

\begin{tabular}{lllllllll}
\hline
Summary of computational transaction \tabularnewline
Raw Input & view raw input (R code)  \tabularnewline
Raw Output & view raw output of R engine  \tabularnewline
Computing time & 1 seconds \tabularnewline
R Server & 'Gwilym Jenkins' @ 72.249.127.135 \tabularnewline
\hline
\end{tabular}
%Source: https://freestatistics.org/blog/index.php?pk=63776&T=0

[TABLE]
[ROW][C]Summary of computational transaction[/C][/ROW]
[ROW][C]Raw Input[/C][C]view raw input (R code) [/C][/ROW]
[ROW][C]Raw Output[/C][C]view raw output of R engine [/C][/ROW]
[ROW][C]Computing time[/C][C]1 seconds[/C][/ROW]
[ROW][C]R Server[/C][C]'Gwilym Jenkins' @ 72.249.127.135[/C][/ROW]
[/TABLE]
Source: https://freestatistics.org/blog/index.php?pk=63776&T=0

Globally Unique Identifier (entire table): ba.freestatistics.org/blog/index.php?pk=63776&T=0

As an alternative you can also use a QR Code:  

The GUIDs for individual cells are displayed in the table below:

Summary of computational transaction
Raw Inputview raw input (R code)
Raw Outputview raw output of R engine
Computing time1 seconds
R Server'Gwilym Jenkins' @ 72.249.127.135


Estimated Parameters of Exponential Smoothing
ParameterValue
alpha0.39496296829087
beta0.183094101313385
gamma0.644958687350449

\begin{tabular}{lllllllll}
\hline
Estimated Parameters of Exponential Smoothing \tabularnewline
Parameter & Value \tabularnewline
alpha & 0.39496296829087 \tabularnewline
beta & 0.183094101313385 \tabularnewline
gamma & 0.644958687350449 \tabularnewline
\hline
\end{tabular}
%Source: https://freestatistics.org/blog/index.php?pk=63776&T=1

[TABLE]
[ROW][C]Estimated Parameters of Exponential Smoothing[/C][/ROW]
[ROW][C]Parameter[/C][C]Value[/C][/ROW]
[ROW][C]alpha[/C][C]0.39496296829087[/C][/ROW]
[ROW][C]beta[/C][C]0.183094101313385[/C][/ROW]
[ROW][C]gamma[/C][C]0.644958687350449[/C][/ROW]
[/TABLE]
Source: https://freestatistics.org/blog/index.php?pk=63776&T=1

Globally Unique Identifier (entire table): ba.freestatistics.org/blog/index.php?pk=63776&T=1

As an alternative you can also use a QR Code:  

The GUIDs for individual cells are displayed in the table below:

Estimated Parameters of Exponential Smoothing
ParameterValue
alpha0.39496296829087
beta0.183094101313385
gamma0.644958687350449


Interpolation Forecasts of Exponential Smoothing
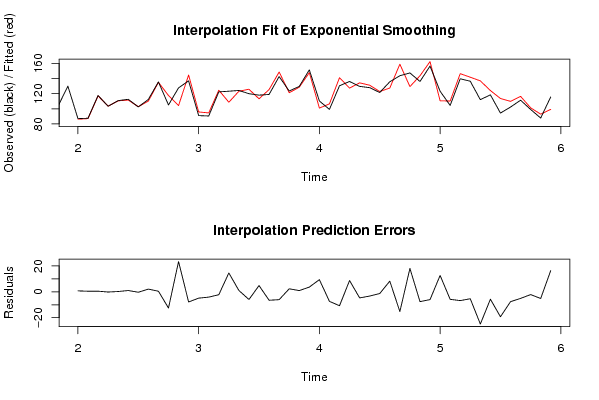
tObservedFittedResiduals
138786.2410064910560.758993508944016
1487.587.01979041419630.480209585803749
15117.6117.0874142004220.512585799578034
16103.4103.528359905879-0.128359905879265
17110.8110.5395937729980.260406227002349
18112.6111.5682910846041.03170891539605
19102.5102.798455794746-0.298455794746488
20112.4110.2752732604982.12472673950171
21135.6135.1138410677390.48615893226085
22105.1117.588315576490-12.4883155764899
23127.7104.27938131087923.4206186891212
24137144.820228932451-7.82022893245136
259195.8538749386248-4.85387493862478
2690.594.5640330111002-4.06403301110021
27122.4124.620095482164-2.22009548216366
28123.3108.69968078321914.6003192167807
29124.3123.2562551824091.04374481759140
30120125.899247386699-5.89924738669933
31118.1113.2358328737774.86416712622336
32119125.486247188026-6.48624718802567
33142.7148.720876219639-6.02087621963935
34123.6121.2493295721092.35067042789126
35129.6128.6163480440540.983651955945533
36151.6147.9102070438993.6897929561014
37110.4100.9609657060539.43903429394676
3899.2106.547012121165-7.34701212116492
39130.5141.209642796919-10.7096427969186
40136.2127.4400073257038.75999267429725
41129.7134.368655182123-4.66865518212265
42128131.245203197272-3.24520319727154
43121.6122.873339460583-1.27333946058297
44135.8127.5215809025078.27841909749326
45143.8159.071824885082-15.2718248850821
46147.5129.39092268528918.1090773147115
47136.2143.773351668667-7.57335166866687
48156.6162.566569237088-5.96656923708829
49123.3110.60657432178212.6934256782176
50104.5110.280899047444-5.78089904744392
51139.8146.549107503577-6.74910750357657
52136.5141.830251885327-5.33025188532682
53112.1136.981192390721-24.8811923907206
54118.5124.184618141031-5.68461814103101
5594.4113.651172273622-19.2511722736216
56102.3109.882769188564-7.58276918856379
57111.4116.459249243814-5.05924924381364
5899.2101.296471086083-2.09647108608323
5987.892.9228304871463-5.12283048714626
60115.899.295017228643216.5049827713568

\begin{tabular}{lllllllll}
\hline
Interpolation Forecasts of Exponential Smoothing \tabularnewline
t & Observed & Fitted & Residuals \tabularnewline
13 & 87 & 86.241006491056 & 0.758993508944016 \tabularnewline
14 & 87.5 & 87.0197904141963 & 0.480209585803749 \tabularnewline
15 & 117.6 & 117.087414200422 & 0.512585799578034 \tabularnewline
16 & 103.4 & 103.528359905879 & -0.128359905879265 \tabularnewline
17 & 110.8 & 110.539593772998 & 0.260406227002349 \tabularnewline
18 & 112.6 & 111.568291084604 & 1.03170891539605 \tabularnewline
19 & 102.5 & 102.798455794746 & -0.298455794746488 \tabularnewline
20 & 112.4 & 110.275273260498 & 2.12472673950171 \tabularnewline
21 & 135.6 & 135.113841067739 & 0.48615893226085 \tabularnewline
22 & 105.1 & 117.588315576490 & -12.4883155764899 \tabularnewline
23 & 127.7 & 104.279381310879 & 23.4206186891212 \tabularnewline
24 & 137 & 144.820228932451 & -7.82022893245136 \tabularnewline
25 & 91 & 95.8538749386248 & -4.85387493862478 \tabularnewline
26 & 90.5 & 94.5640330111002 & -4.06403301110021 \tabularnewline
27 & 122.4 & 124.620095482164 & -2.22009548216366 \tabularnewline
28 & 123.3 & 108.699680783219 & 14.6003192167807 \tabularnewline
29 & 124.3 & 123.256255182409 & 1.04374481759140 \tabularnewline
30 & 120 & 125.899247386699 & -5.89924738669933 \tabularnewline
31 & 118.1 & 113.235832873777 & 4.86416712622336 \tabularnewline
32 & 119 & 125.486247188026 & -6.48624718802567 \tabularnewline
33 & 142.7 & 148.720876219639 & -6.02087621963935 \tabularnewline
34 & 123.6 & 121.249329572109 & 2.35067042789126 \tabularnewline
35 & 129.6 & 128.616348044054 & 0.983651955945533 \tabularnewline
36 & 151.6 & 147.910207043899 & 3.6897929561014 \tabularnewline
37 & 110.4 & 100.960965706053 & 9.43903429394676 \tabularnewline
38 & 99.2 & 106.547012121165 & -7.34701212116492 \tabularnewline
39 & 130.5 & 141.209642796919 & -10.7096427969186 \tabularnewline
40 & 136.2 & 127.440007325703 & 8.75999267429725 \tabularnewline
41 & 129.7 & 134.368655182123 & -4.66865518212265 \tabularnewline
42 & 128 & 131.245203197272 & -3.24520319727154 \tabularnewline
43 & 121.6 & 122.873339460583 & -1.27333946058297 \tabularnewline
44 & 135.8 & 127.521580902507 & 8.27841909749326 \tabularnewline
45 & 143.8 & 159.071824885082 & -15.2718248850821 \tabularnewline
46 & 147.5 & 129.390922685289 & 18.1090773147115 \tabularnewline
47 & 136.2 & 143.773351668667 & -7.57335166866687 \tabularnewline
48 & 156.6 & 162.566569237088 & -5.96656923708829 \tabularnewline
49 & 123.3 & 110.606574321782 & 12.6934256782176 \tabularnewline
50 & 104.5 & 110.280899047444 & -5.78089904744392 \tabularnewline
51 & 139.8 & 146.549107503577 & -6.74910750357657 \tabularnewline
52 & 136.5 & 141.830251885327 & -5.33025188532682 \tabularnewline
53 & 112.1 & 136.981192390721 & -24.8811923907206 \tabularnewline
54 & 118.5 & 124.184618141031 & -5.68461814103101 \tabularnewline
55 & 94.4 & 113.651172273622 & -19.2511722736216 \tabularnewline
56 & 102.3 & 109.882769188564 & -7.58276918856379 \tabularnewline
57 & 111.4 & 116.459249243814 & -5.05924924381364 \tabularnewline
58 & 99.2 & 101.296471086083 & -2.09647108608323 \tabularnewline
59 & 87.8 & 92.9228304871463 & -5.12283048714626 \tabularnewline
60 & 115.8 & 99.2950172286432 & 16.5049827713568 \tabularnewline
\hline
\end{tabular}
%Source: https://freestatistics.org/blog/index.php?pk=63776&T=2

[TABLE]
[ROW][C]Interpolation Forecasts of Exponential Smoothing[/C][/ROW]
[ROW][C]t[/C][C]Observed[/C][C]Fitted[/C][C]Residuals[/C][/ROW]
[ROW][C]13[/C][C]87[/C][C]86.241006491056[/C][C]0.758993508944016[/C][/ROW]
[ROW][C]14[/C][C]87.5[/C][C]87.0197904141963[/C][C]0.480209585803749[/C][/ROW]
[ROW][C]15[/C][C]117.6[/C][C]117.087414200422[/C][C]0.512585799578034[/C][/ROW]
[ROW][C]16[/C][C]103.4[/C][C]103.528359905879[/C][C]-0.128359905879265[/C][/ROW]
[ROW][C]17[/C][C]110.8[/C][C]110.539593772998[/C][C]0.260406227002349[/C][/ROW]
[ROW][C]18[/C][C]112.6[/C][C]111.568291084604[/C][C]1.03170891539605[/C][/ROW]
[ROW][C]19[/C][C]102.5[/C][C]102.798455794746[/C][C]-0.298455794746488[/C][/ROW]
[ROW][C]20[/C][C]112.4[/C][C]110.275273260498[/C][C]2.12472673950171[/C][/ROW]
[ROW][C]21[/C][C]135.6[/C][C]135.113841067739[/C][C]0.48615893226085[/C][/ROW]
[ROW][C]22[/C][C]105.1[/C][C]117.588315576490[/C][C]-12.4883155764899[/C][/ROW]
[ROW][C]23[/C][C]127.7[/C][C]104.279381310879[/C][C]23.4206186891212[/C][/ROW]
[ROW][C]24[/C][C]137[/C][C]144.820228932451[/C][C]-7.82022893245136[/C][/ROW]
[ROW][C]25[/C][C]91[/C][C]95.8538749386248[/C][C]-4.85387493862478[/C][/ROW]
[ROW][C]26[/C][C]90.5[/C][C]94.5640330111002[/C][C]-4.06403301110021[/C][/ROW]
[ROW][C]27[/C][C]122.4[/C][C]124.620095482164[/C][C]-2.22009548216366[/C][/ROW]
[ROW][C]28[/C][C]123.3[/C][C]108.699680783219[/C][C]14.6003192167807[/C][/ROW]
[ROW][C]29[/C][C]124.3[/C][C]123.256255182409[/C][C]1.04374481759140[/C][/ROW]
[ROW][C]30[/C][C]120[/C][C]125.899247386699[/C][C]-5.89924738669933[/C][/ROW]
[ROW][C]31[/C][C]118.1[/C][C]113.235832873777[/C][C]4.86416712622336[/C][/ROW]
[ROW][C]32[/C][C]119[/C][C]125.486247188026[/C][C]-6.48624718802567[/C][/ROW]
[ROW][C]33[/C][C]142.7[/C][C]148.720876219639[/C][C]-6.02087621963935[/C][/ROW]
[ROW][C]34[/C][C]123.6[/C][C]121.249329572109[/C][C]2.35067042789126[/C][/ROW]
[ROW][C]35[/C][C]129.6[/C][C]128.616348044054[/C][C]0.983651955945533[/C][/ROW]
[ROW][C]36[/C][C]151.6[/C][C]147.910207043899[/C][C]3.6897929561014[/C][/ROW]
[ROW][C]37[/C][C]110.4[/C][C]100.960965706053[/C][C]9.43903429394676[/C][/ROW]
[ROW][C]38[/C][C]99.2[/C][C]106.547012121165[/C][C]-7.34701212116492[/C][/ROW]
[ROW][C]39[/C][C]130.5[/C][C]141.209642796919[/C][C]-10.7096427969186[/C][/ROW]
[ROW][C]40[/C][C]136.2[/C][C]127.440007325703[/C][C]8.75999267429725[/C][/ROW]
[ROW][C]41[/C][C]129.7[/C][C]134.368655182123[/C][C]-4.66865518212265[/C][/ROW]
[ROW][C]42[/C][C]128[/C][C]131.245203197272[/C][C]-3.24520319727154[/C][/ROW]
[ROW][C]43[/C][C]121.6[/C][C]122.873339460583[/C][C]-1.27333946058297[/C][/ROW]
[ROW][C]44[/C][C]135.8[/C][C]127.521580902507[/C][C]8.27841909749326[/C][/ROW]
[ROW][C]45[/C][C]143.8[/C][C]159.071824885082[/C][C]-15.2718248850821[/C][/ROW]
[ROW][C]46[/C][C]147.5[/C][C]129.390922685289[/C][C]18.1090773147115[/C][/ROW]
[ROW][C]47[/C][C]136.2[/C][C]143.773351668667[/C][C]-7.57335166866687[/C][/ROW]
[ROW][C]48[/C][C]156.6[/C][C]162.566569237088[/C][C]-5.96656923708829[/C][/ROW]
[ROW][C]49[/C][C]123.3[/C][C]110.606574321782[/C][C]12.6934256782176[/C][/ROW]
[ROW][C]50[/C][C]104.5[/C][C]110.280899047444[/C][C]-5.78089904744392[/C][/ROW]
[ROW][C]51[/C][C]139.8[/C][C]146.549107503577[/C][C]-6.74910750357657[/C][/ROW]
[ROW][C]52[/C][C]136.5[/C][C]141.830251885327[/C][C]-5.33025188532682[/C][/ROW]
[ROW][C]53[/C][C]112.1[/C][C]136.981192390721[/C][C]-24.8811923907206[/C][/ROW]
[ROW][C]54[/C][C]118.5[/C][C]124.184618141031[/C][C]-5.68461814103101[/C][/ROW]
[ROW][C]55[/C][C]94.4[/C][C]113.651172273622[/C][C]-19.2511722736216[/C][/ROW]
[ROW][C]56[/C][C]102.3[/C][C]109.882769188564[/C][C]-7.58276918856379[/C][/ROW]
[ROW][C]57[/C][C]111.4[/C][C]116.459249243814[/C][C]-5.05924924381364[/C][/ROW]
[ROW][C]58[/C][C]99.2[/C][C]101.296471086083[/C][C]-2.09647108608323[/C][/ROW]
[ROW][C]59[/C][C]87.8[/C][C]92.9228304871463[/C][C]-5.12283048714626[/C][/ROW]
[ROW][C]60[/C][C]115.8[/C][C]99.2950172286432[/C][C]16.5049827713568[/C][/ROW]
[/TABLE]
Source: https://freestatistics.org/blog/index.php?pk=63776&T=2

Globally Unique Identifier (entire table): ba.freestatistics.org/blog/index.php?pk=63776&T=2

As an alternative you can also use a QR Code:  

The GUIDs for individual cells are displayed in the table below:

Interpolation Forecasts of Exponential Smoothing
tObservedFittedResiduals
138786.2410064910560.758993508944016
1487.587.01979041419630.480209585803749
15117.6117.0874142004220.512585799578034
16103.4103.528359905879-0.128359905879265
17110.8110.5395937729980.260406227002349
18112.6111.5682910846041.03170891539605
19102.5102.798455794746-0.298455794746488
20112.4110.2752732604982.12472673950171
21135.6135.1138410677390.48615893226085
22105.1117.588315576490-12.4883155764899
23127.7104.27938131087923.4206186891212
24137144.820228932451-7.82022893245136
259195.8538749386248-4.85387493862478
2690.594.5640330111002-4.06403301110021
27122.4124.620095482164-2.22009548216366
28123.3108.69968078321914.6003192167807
29124.3123.2562551824091.04374481759140
30120125.899247386699-5.89924738669933
31118.1113.2358328737774.86416712622336
32119125.486247188026-6.48624718802567
33142.7148.720876219639-6.02087621963935
34123.6121.2493295721092.35067042789126
35129.6128.6163480440540.983651955945533
36151.6147.9102070438993.6897929561014
37110.4100.9609657060539.43903429394676
3899.2106.547012121165-7.34701212116492
39130.5141.209642796919-10.7096427969186
40136.2127.4400073257038.75999267429725
41129.7134.368655182123-4.66865518212265
42128131.245203197272-3.24520319727154
43121.6122.873339460583-1.27333946058297
44135.8127.5215809025078.27841909749326
45143.8159.071824885082-15.2718248850821
46147.5129.39092268528918.1090773147115
47136.2143.773351668667-7.57335166866687
48156.6162.566569237088-5.96656923708829
49123.3110.60657432178212.6934256782176
50104.5110.280899047444-5.78089904744392
51139.8146.549107503577-6.74910750357657
52136.5141.830251885327-5.33025188532682
53112.1136.981192390721-24.8811923907206
54118.5124.184618141031-5.68461814103101
5594.4113.651172273622-19.2511722736216
56102.3109.882769188564-7.58276918856379
57111.4116.459249243814-5.05924924381364
5899.2101.296471086083-2.09647108608323
5987.892.9228304871463-5.12283048714626
60115.899.295017228643216.5049827713568


Extrapolation Forecasts of Exponential Smoothing
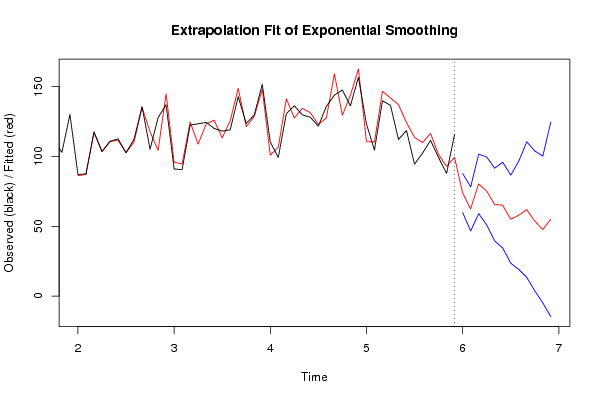
tForecast95% Lower Bound95% Upper Bound
6173.742510212709859.773144095726487.7118763296932
6262.388216202192246.598380608087178.1780517962973
6380.315054429771559.0357735748043101.594335284739
6475.238457854210250.962063617596199.5148520908242
6565.501437444353939.463990621604191.5388842671037
6665.128462486735834.445504100775295.8114208726964
6755.050223569446623.533306190550786.5671409483424
6857.846461633423319.094164472255796.5987587945908
6961.924334854323413.4042716986218110.444398010025
7053.80942649675763.76331594632744103.855537047188
7147.6698718636309-4.86453787945371100.204281606715
7254.9485875501871-14.6951939996628124.592369100037

\begin{tabular}{lllllllll}
\hline
Extrapolation Forecasts of Exponential Smoothing \tabularnewline
t & Forecast & 95% Lower Bound & 95% Upper Bound \tabularnewline
61 & 73.7425102127098 & 59.7731440957264 & 87.7118763296932 \tabularnewline
62 & 62.3882162021922 & 46.5983806080871 & 78.1780517962973 \tabularnewline
63 & 80.3150544297715 & 59.0357735748043 & 101.594335284739 \tabularnewline
64 & 75.2384578542102 & 50.9620636175961 & 99.5148520908242 \tabularnewline
65 & 65.5014374443539 & 39.4639906216041 & 91.5388842671037 \tabularnewline
66 & 65.1284624867358 & 34.4455041007752 & 95.8114208726964 \tabularnewline
67 & 55.0502235694466 & 23.5333061905507 & 86.5671409483424 \tabularnewline
68 & 57.8464616334233 & 19.0941644722557 & 96.5987587945908 \tabularnewline
69 & 61.9243348543234 & 13.4042716986218 & 110.444398010025 \tabularnewline
70 & 53.8094264967576 & 3.76331594632744 & 103.855537047188 \tabularnewline
71 & 47.6698718636309 & -4.86453787945371 & 100.204281606715 \tabularnewline
72 & 54.9485875501871 & -14.6951939996628 & 124.592369100037 \tabularnewline
\hline
\end{tabular}
%Source: https://freestatistics.org/blog/index.php?pk=63776&T=3

[TABLE]
[ROW][C]Extrapolation Forecasts of Exponential Smoothing[/C][/ROW]
[ROW][C]t[/C][C]Forecast[/C][C]95% Lower Bound[/C][C]95% Upper Bound[/C][/ROW]
[ROW][C]61[/C][C]73.7425102127098[/C][C]59.7731440957264[/C][C]87.7118763296932[/C][/ROW]
[ROW][C]62[/C][C]62.3882162021922[/C][C]46.5983806080871[/C][C]78.1780517962973[/C][/ROW]
[ROW][C]63[/C][C]80.3150544297715[/C][C]59.0357735748043[/C][C]101.594335284739[/C][/ROW]
[ROW][C]64[/C][C]75.2384578542102[/C][C]50.9620636175961[/C][C]99.5148520908242[/C][/ROW]
[ROW][C]65[/C][C]65.5014374443539[/C][C]39.4639906216041[/C][C]91.5388842671037[/C][/ROW]
[ROW][C]66[/C][C]65.1284624867358[/C][C]34.4455041007752[/C][C]95.8114208726964[/C][/ROW]
[ROW][C]67[/C][C]55.0502235694466[/C][C]23.5333061905507[/C][C]86.5671409483424[/C][/ROW]
[ROW][C]68[/C][C]57.8464616334233[/C][C]19.0941644722557[/C][C]96.5987587945908[/C][/ROW]
[ROW][C]69[/C][C]61.9243348543234[/C][C]13.4042716986218[/C][C]110.444398010025[/C][/ROW]
[ROW][C]70[/C][C]53.8094264967576[/C][C]3.76331594632744[/C][C]103.855537047188[/C][/ROW]
[ROW][C]71[/C][C]47.6698718636309[/C][C]-4.86453787945371[/C][C]100.204281606715[/C][/ROW]
[ROW][C]72[/C][C]54.9485875501871[/C][C]-14.6951939996628[/C][C]124.592369100037[/C][/ROW]
[/TABLE]
Source: https://freestatistics.org/blog/index.php?pk=63776&T=3

Globally Unique Identifier (entire table): ba.freestatistics.org/blog/index.php?pk=63776&T=3

As an alternative you can also use a QR Code:  

The GUIDs for individual cells are displayed in the table below:

Extrapolation Forecasts of Exponential Smoothing
tForecast95% Lower Bound95% Upper Bound
6173.742510212709859.773144095726487.7118763296932
6262.388216202192246.598380608087178.1780517962973
6380.315054429771559.0357735748043101.594335284739
6475.238457854210250.962063617596199.5148520908242
6565.501437444353939.463990621604191.5388842671037
6665.128462486735834.445504100775295.8114208726964
6755.050223569446623.533306190550786.5671409483424
6857.846461633423319.094164472255796.5987587945908
6961.924334854323413.4042716986218110.444398010025
7053.80942649675763.76331594632744103.855537047188
7147.6698718636309-4.86453787945371100.204281606715
7254.9485875501871-14.6951939996628124.592369100037


Parameters (Session):
par1 = 12 ; par2 = Triple ; par3 = multiplicative ;
Parameters (R input):
par1 = 12 ; par2 = Triple ; par3 = multiplicative ;
R code (references can be found in the software module):
par1 <- as.numeric(par1)
if (par2 == 'Single') K <- 1
if (par2 == 'Double') K <- 2
if (par2 == 'Triple') K <- par1
nx <- length(x)
nxmK <- nx - K
x <- ts(x, frequency = par1)
if (par2 == 'Single') fit <- HoltWinters(x, gamma=0, beta=0)
if (par2 == 'Double') fit <- HoltWinters(x, gamma=0)
if (par2 == 'Triple') fit <- HoltWinters(x, seasonal=par3)
fit
myresid <- x - fit$fitted[,'xhat']
bitmap(file='test1.png')
op <- par(mfrow=c(2,1))
plot(fit,ylab='Observed (black) / Fitted (red)',main='Interpolation Fit of Exponential Smoothing')
plot(myresid,ylab='Residuals',main='Interpolation Prediction Errors')
par(op)
dev.off()
bitmap(file='test2.png')
p <- predict(fit, par1, prediction.interval=TRUE)
np <- length(p[,1])
plot(fit,p,ylab='Observed (black) / Fitted (red)',main='Extrapolation Fit of Exponential Smoothing')
dev.off()
bitmap(file='test3.png')
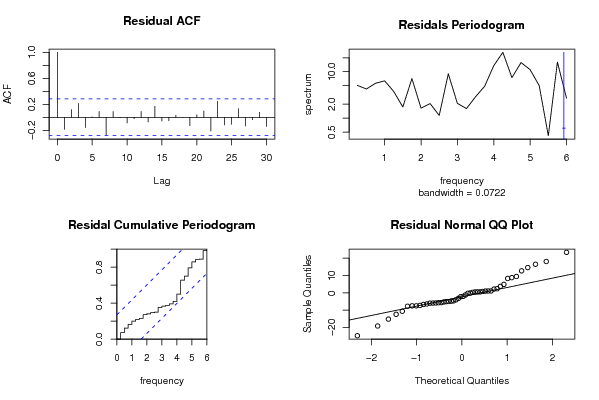
op <- par(mfrow = c(2,2))
acf(as.numeric(myresid),lag.max = nx/2,main='Residual ACF')
spectrum(myresid,main='Residals Periodogram')
cpgram(myresid,main='Residal Cumulative Periodogram')
qqnorm(myresid,main='Residual Normal QQ Plot')
qqline(myresid)
par(op)
dev.off()
load(file='createtable')
a<-table.start()
a<-table.row.start(a)
a<-table.element(a,'Estimated Parameters of Exponential Smoothing',2,TRUE)
a<-table.row.end(a)
a<-table.row.start(a)
a<-table.element(a,'Parameter',header=TRUE)
a<-table.element(a,'Value',header=TRUE)
a<-table.row.end(a)
a<-table.row.start(a)
a<-table.element(a,'alpha',header=TRUE)
a<-table.element(a,fit$alpha)
a<-table.row.end(a)
a<-table.row.start(a)
a<-table.element(a,'beta',header=TRUE)
a<-table.element(a,fit$beta)
a<-table.row.end(a)
a<-table.row.start(a)
a<-table.element(a,'gamma',header=TRUE)
a<-table.element(a,fit$gamma)
a<-table.row.end(a)
a<-table.end(a)
table.save(a,file='mytable.tab')
a<-table.start()
a<-table.row.start(a)
a<-table.element(a,'Interpolation Forecasts of Exponential Smoothing',4,TRUE)
a<-table.row.end(a)
a<-table.row.start(a)
a<-table.element(a,'t',header=TRUE)
a<-table.element(a,'Observed',header=TRUE)
a<-table.element(a,'Fitted',header=TRUE)
a<-table.element(a,'Residuals',header=TRUE)
a<-table.row.end(a)
for (i in 1:nxmK) {
a<-table.row.start(a)
a<-table.element(a,i+K,header=TRUE)
a<-table.element(a,x[i+K])
a<-table.element(a,fit$fitted[i,'xhat'])
a<-table.element(a,myresid[i])
a<-table.row.end(a)
}
a<-table.end(a)
table.save(a,file='mytable1.tab')
a<-table.start()
a<-table.row.start(a)
a<-table.element(a,'Extrapolation Forecasts of Exponential Smoothing',4,TRUE)
a<-table.row.end(a)
a<-table.row.start(a)
a<-table.element(a,'t',header=TRUE)
a<-table.element(a,'Forecast',header=TRUE)
a<-table.element(a,'95% Lower Bound',header=TRUE)
a<-table.element(a,'95% Upper Bound',header=TRUE)
a<-table.row.end(a)
for (i in 1:np) {
a<-table.row.start(a)
a<-table.element(a,nx+i,header=TRUE)
a<-table.element(a,p[i,'fit'])
a<-table.element(a,p[i,'lwr'])
a<-table.element(a,p[i,'upr'])
a<-table.row.end(a)
}
a<-table.end(a)
table.save(a,file='mytable2.tab')